How to Think Like an Analyst
Thinking like an analyst means replacing "will it go up?" with an if-then process: observe what happened, add context, form a hypothesis, and define what proves it wrong. The skill is the process, nothing more mysterious than that. Everything else, indicators, screeners, news feeds, sits on top of this foundation or it sits on nothing.

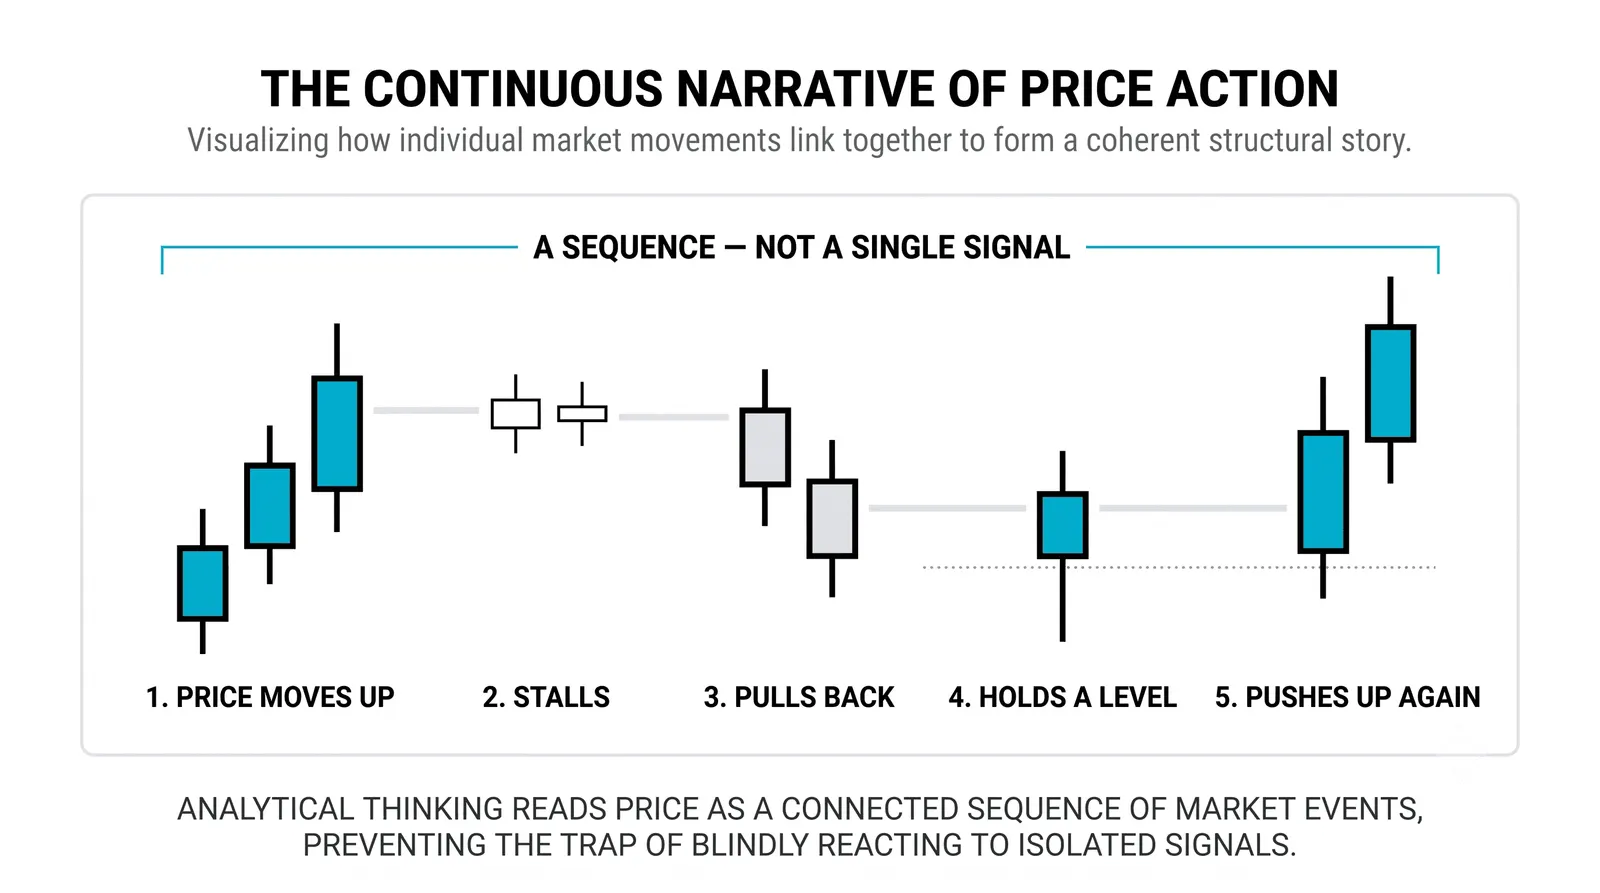
Most new traders skip straight to prediction. They look at a chart and ask where price is going. An analyst asks something different: what is price doing, what would I do if it continues, and what would tell me I'm wrong. The first question has no answer. The second set always does.
Think of it like a doctor reading symptoms. A doctor does not guess a diagnosis from one cough. She notes the symptoms, checks history, forms a working theory, and knows which test result would rule it out. You can do the same with a chart.
The Analyst's Four Steps
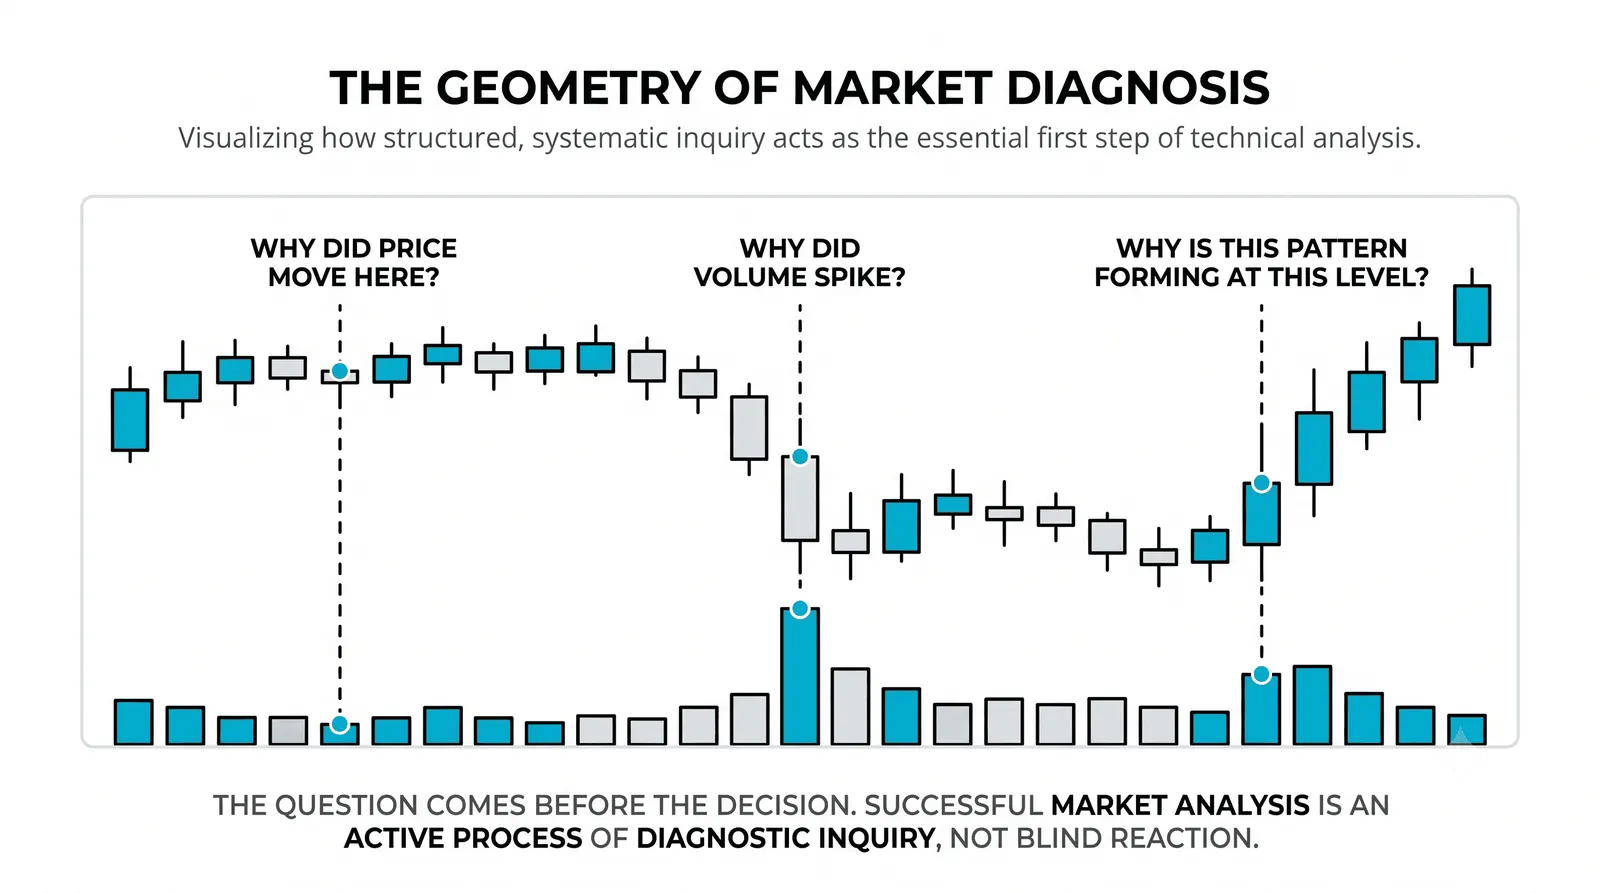
The process has four steps, and they always run in the same order. Skip one and you are gambling with extra steps.
Step one: observe. Write down what actually happened, with no opinion attached. "Price rose from 96 to 102 over five days, then pulled back to 99 on lower volume." That is an observation. "Price looks strong" is not. If your sentence contains a feeling, rewrite it.
Step two: context. Zoom out. Where does this move sit on the bigger chart? Is price near old highs, in the middle of a range, or at a level that rejected it twice before? A rally into prior resistance means something different than a rally into empty space. Same candles, different meaning.
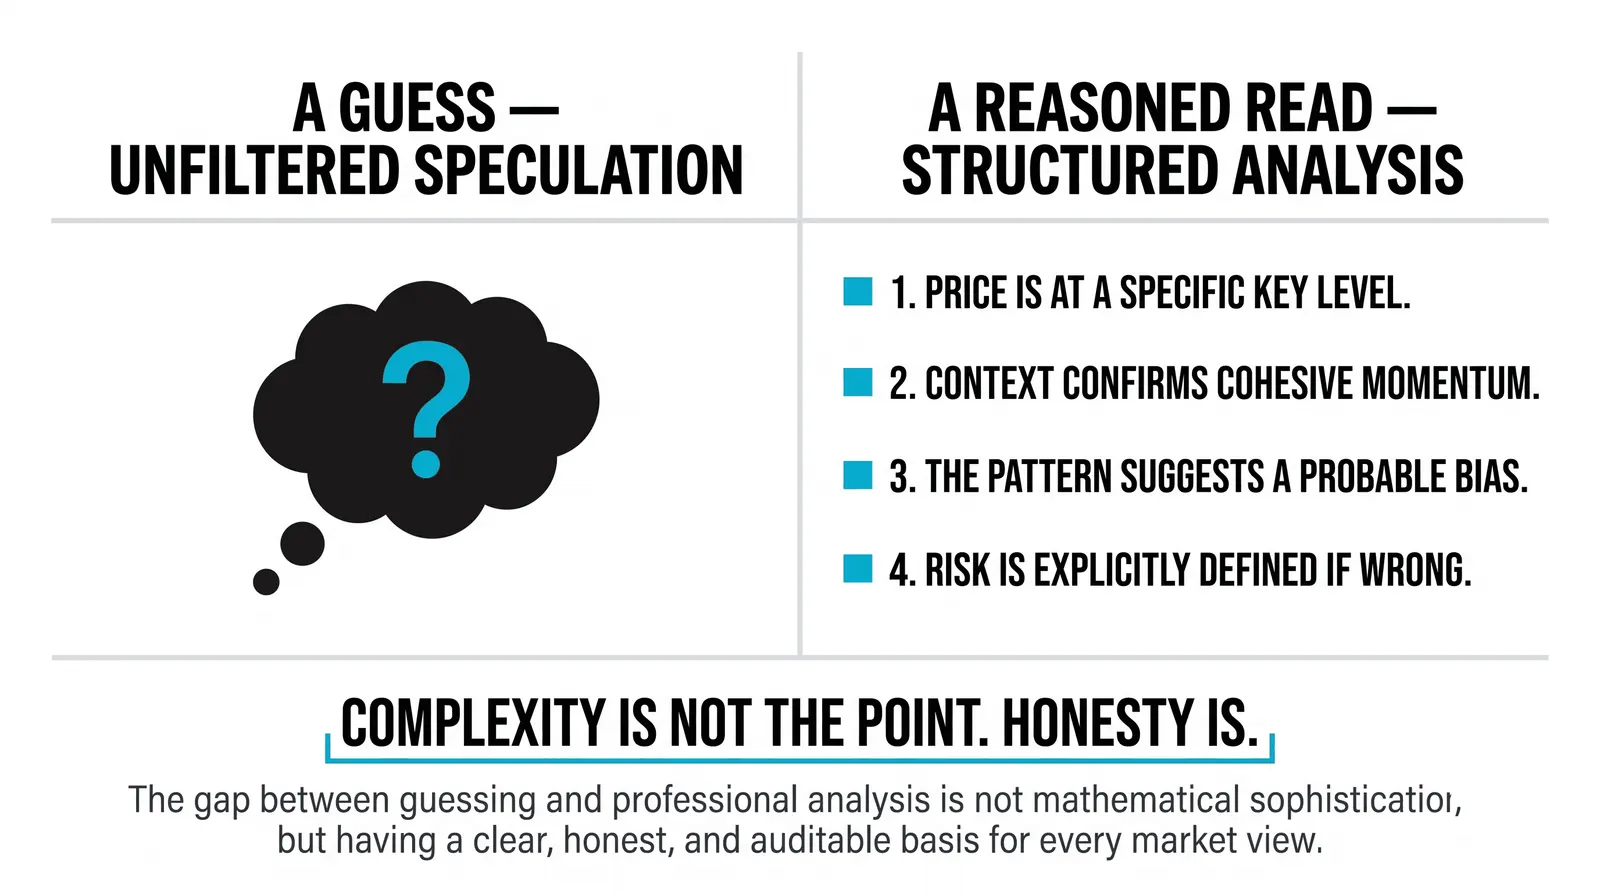
Step three: hypothesis. Now you earn an opinion, but it must be a sentence with a number in it. "If price holds above 99, I expect a test of 104." Weak hypotheses sound like "this looks bullish." Strong ones name a condition and a target. If you cannot put a number in the sentence, you do not have a hypothesis yet.
Step four: invalidation. Decide, before entering, the exact price that kills the idea. "If price closes below 96, my hypothesis is wrong." This is the step that separates analysts from hopeful people. The invalidation level is not a suggestion. It is the deal you make with yourself before money is involved. You cannot define invalidation on a chart you cannot read; reading a basic price chart is the prerequisite.
A Worked Example
Here is the full process on one stock, using round numbers.
Observe: The stock trades at 100. It made prior highs at 104 and 108 over the past two months. Last week it pulled back and buyers stepped in at 96. It has since climbed back to 100.
Context: Price sits below two clear resistance levels, 104 and 108. The pullback found support at 96, which means buyers defended that zone once. The stock is in a rising pattern of higher lows, but it has not proven it can break 104.
Hypothesis: "If price holds above 96 and breaks 104, I expect a move toward 108." Notice the structure. A condition (holds 96, breaks 104), and a target (108). Both are numbers you can check on the chart.
Invalidation: "If price closes below 96, the idea is dead." Below 96, the buyers who defended that level have failed, and your reason for the trade no longer exists.
Now look at what you have. You know where you would enter, where you would exit if right, and where you would exit if wrong. You have not predicted anything. You have prepared for two outcomes and priced both of them.
Gambler vs Analyst
The difference shows up in habits, not intelligence. Here is the side-by-side.
| Gambler | Analyst | |
|---|---|---|
| Question asked | "Will it go up?" | "What conditions make this work, and what kills it?" |
| Plan timing | Figures it out after entering | Writes the plan before entering |
| Reaction to being wrong | Holds, hopes, or doubles down | Exits at the invalidation level, logs the loss |
| What they track | Wins, profits, hot streaks | Win rate, average loss, whether the process was followed |
Read the last row again. The gambler tracks outcomes. The analyst tracks behavior. Outcomes are noisy over any short stretch. Behavior is the only thing you fully control, so it is the only thing worth measuring early on.
Being Wrong Is the Job
New traders treat a losing trade as a failure of analysis. Analysts treat it as a data point. This is the hardest mental shift in the whole post.
Every honest analyst expects a loss rate. Many profitable traders are wrong 40 to 50 percent of the time. They stay profitable because their invalidation levels keep losses small and their hypotheses give winners room to run. The math works even when the predictions often do not.
So measure your loss rate instead of hiding from it. After twenty planned trades, you should know how many hit invalidation, how much the average loss cost, and whether you actually exited where you said you would. That third number matters most. A trader who follows a mediocre plan beats a trader who abandons a good one. Your available hours and style shape that plan; the fit is covered in types of traders.
A planned loss is a completed trade, not a mistake.
The unplanned loss is the mistake. When you skip invalidation and hold a loser "to give it room," you have stopped analyzing and started hoping. Hope is not a position sizing strategy.
What to Practice This Week
You build this skill with reps, not reading. Here is the assignment.
- Pull up ten charts of stocks or pairs you do not currently trade. No positions means no bias.
- For each chart, write four sentences: one observation, one context note, one hypothesis with a number, one invalidation level.
- Do not take any of these trades. The goal is the writing, not the winning.
- Come back in a week and score yourself. How many hypotheses played out? How many hit invalidation first? How clean were your observations?
Forty sentences total. The exercise stays that small on purpose. Most people will not do it because it feels like homework. The ones who do will notice something by chart seven or eight: their hypotheses start getting tighter, and their invalidation levels stop being arbitrary.
Keep the sentences in a notebook or a simple document. In a month you will have a record of how your thinking has changed, and that record is worth more than any single trade. None of it needs live money: the whole exercise runs on a demo account.
Questions About Thinking Like an Analyst
Do analysts predict the market?
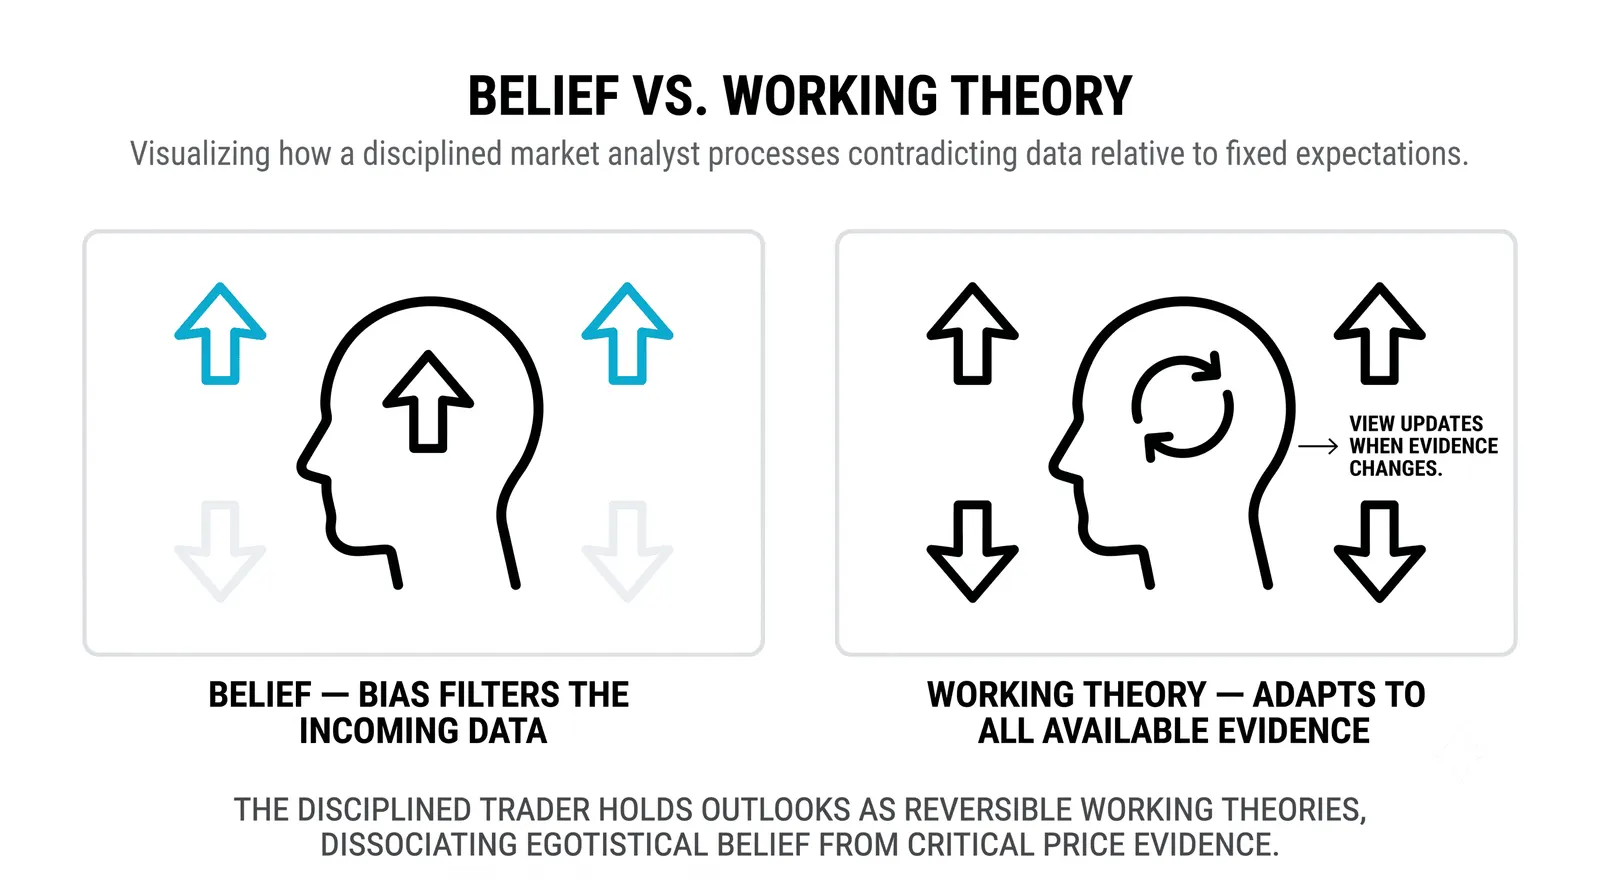
No, analysts prepare for scenarios, and prediction is a byproduct of that preparation. When you write "if price holds 96 and breaks 104, I expect 108," you have not forecast the future. You have stated a conditional. If the conditions never appear, you do nothing, and doing nothing is a valid analyst decision. Professionals spend most of their time waiting for conditions, not calling direction.
How long until this feels natural?
It feels unnatural until your first planned loss, and then it clicks. Reading about invalidation is abstract. Actually exiting at your level, watching the loss stay small, and seeing the stock collapse another 10 percent without you, that experience rewires you fast. Expect a few weeks of awkward, forced sentence-writing before the process starts running on its own.
Do I need more indicators to think like an analyst?
No. Process comes first, tools later. The four steps work on a naked chart with nothing but price. Indicators can sharpen an observation or refine a level, but they cannot write your hypothesis or enforce your invalidation. Adding tools before you have a process just gives you more ways to be vague.
Is this what professional analysts actually do?
Yes, the skeleton is the same, with better data and stricter risk math on top. A desk analyst observes, contextualizes, hypothesizes, and defines invalidation exactly as described here. What they add is deeper information, position sizing formulas, and portfolio-level risk limits. You can learn those layers later. The skeleton you practice this week is the one they still use.
Next, learn how to size a position from your invalidation level, so the distance between entry and "I'm wrong" determines how much you buy. That is where analysis turns into risk management.