What Is a Trend in Trading
A trend is a sustained directional drift in price, defined by the pattern of its highs and lows, not by a feeling. If you can point to the highs and lows on a chart and describe their sequence, you can say whether a trend exists. If you cannot, you are guessing. In trading, that pattern is the difference between reading a market and betting on one.

This is the most useful idea in Level 2. Almost everything else you will learn, entries, exits, risk placement, hangs off this one skill. So we will build it slowly and precisely.
Defining a Trend by Its Structure
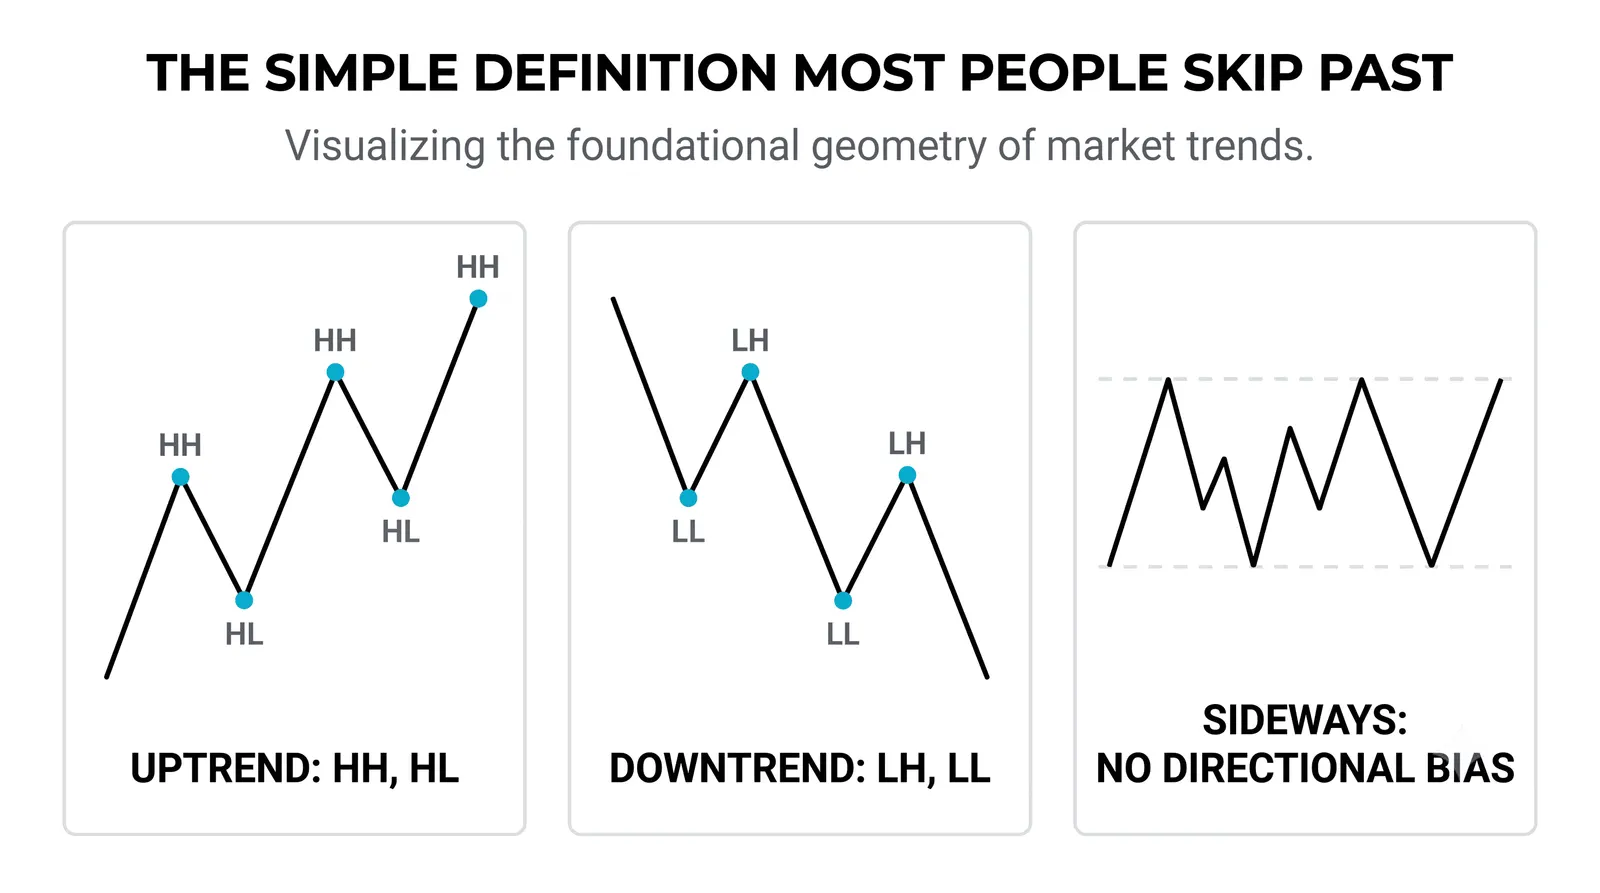
Forget opinions about where price "should" go. Structure is mechanical. A swing high is a peak with lower prices on both sides. A swing low is a trough with higher prices on both sides. If marking them on a live chart still feels new, warm up with reading a basic price chart first. Once you can mark those, the definitions are simple:
- Uptrend: price makes higher highs and higher lows. Both conditions must hold.
- Downtrend: price makes lower highs AND lower lows. Again, both.
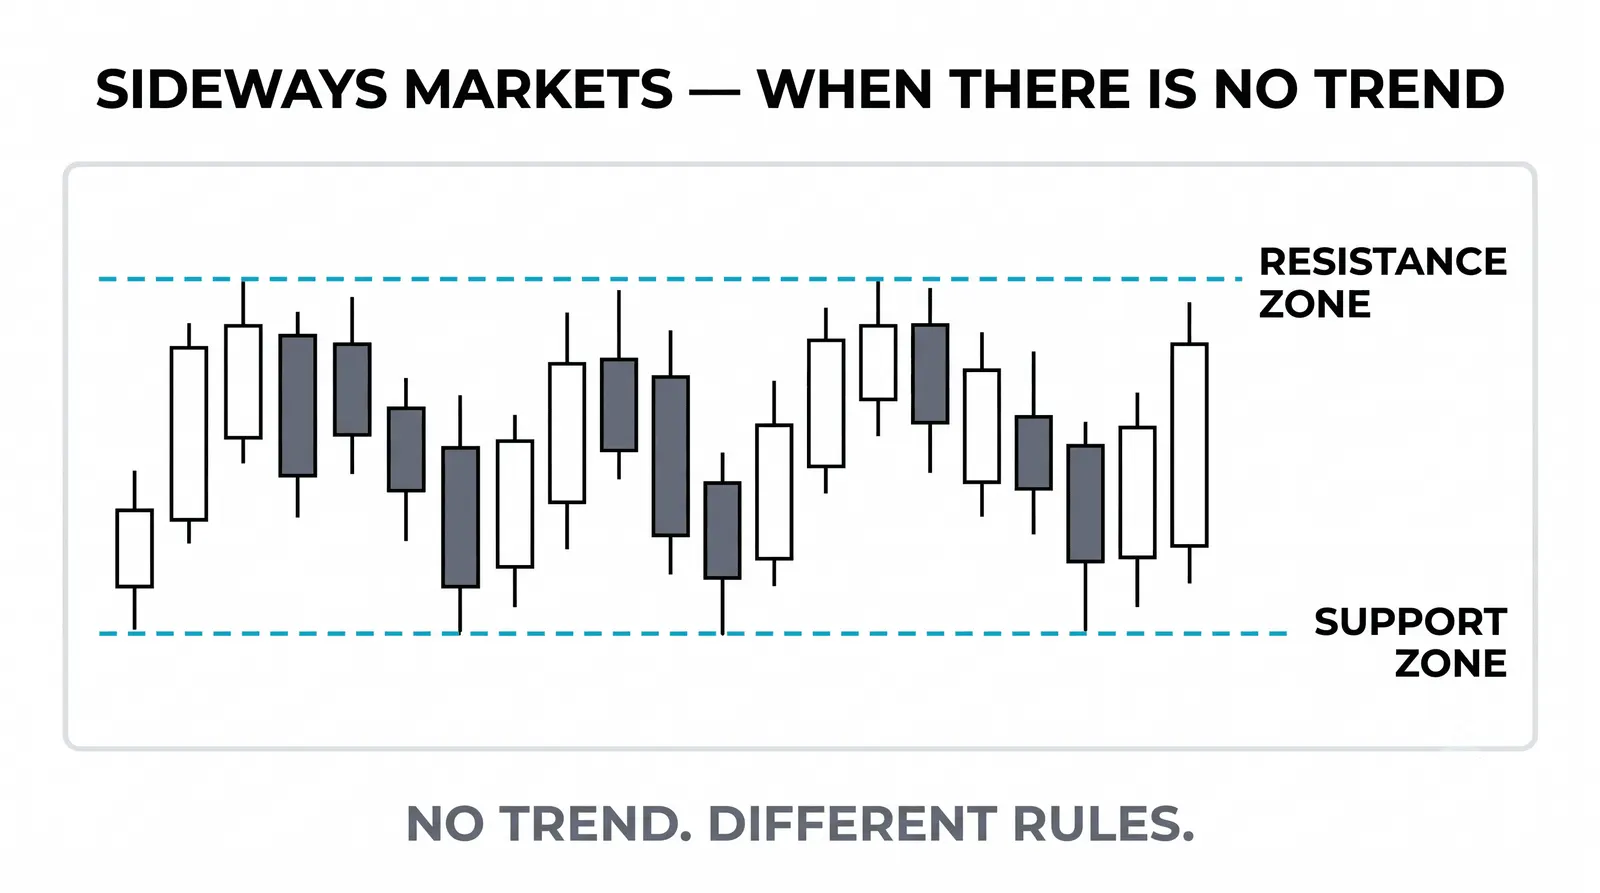
- Range: neither condition holds. Highs and lows arrive in no consistent order.
Notice the word "and." One higher high alone proves nothing. A market can print a single higher high inside a downtrend and keep falling. You need the full pattern: each push reaches further than the last, and each pullback stops higher than the one before.
Think of a trend like a staircase. In an uptrend, both the steps and the landings keep rising. If the landings start sinking, the staircase is broken even if one step still pokes up.
Why Structure Beats a Straight-Line Guess
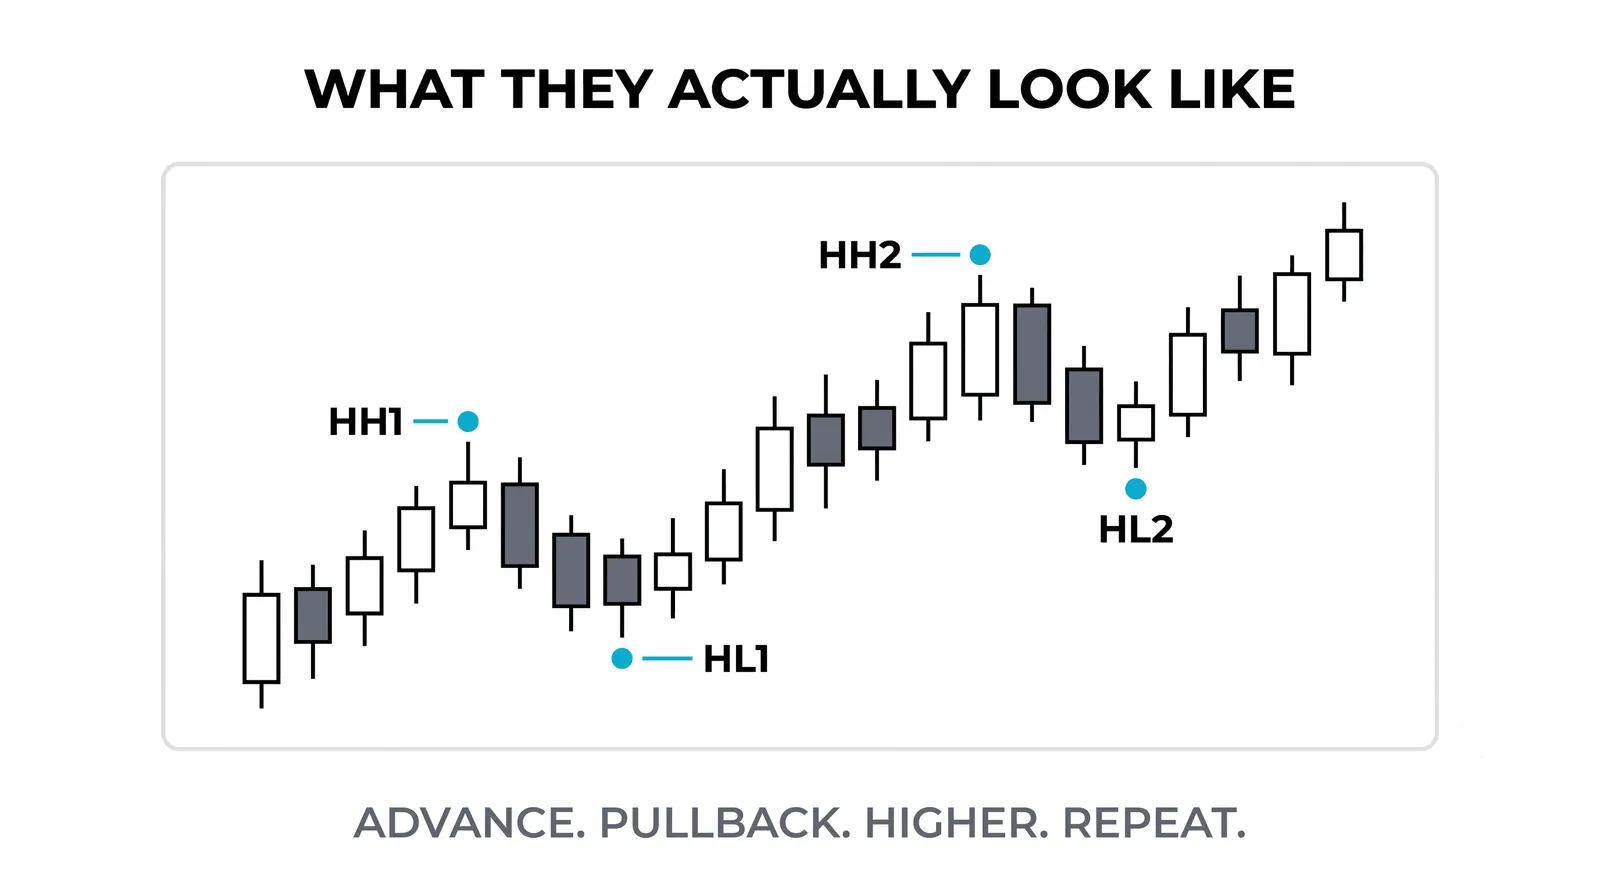
New traders often expect a trend to look like a clean diagonal line. Real trends almost never do. They breathe. Price pushes forward, pulls back, pushes again.
Those pullbacks are not the trend failing. They are the trend working. In a healthy uptrend, buyers step in at higher and higher prices on each dip, which is exactly what produces the higher lows. A pullback that holds above the previous low is evidence of strength, not weakness.
This matters because most beginners exit good trades on normal pullbacks. They see red candles, assume the move is over, and sell. Then price makes a new high without them. If you judge the trend by structure instead of by the last three candles, you stop making that mistake.
Be blunt with yourself here: a pullback feels scary and a breakout feels safe, and structure is often the opposite of both feelings.
A Worked Example, Bar by Bar
Take a series of daily closes: 50, 52, 54, 53, 56, 55, 58. To keep it simple, treat each close as that day's swing point and read the sequence left to right.
- Price starts at 50. This becomes our first reference low.
- Price rises to 52, then 54. The move stalls at 54, so 54 is our first swing high.
- Price dips to 53. That dip holds above the prior low of 50. So 53 is a higher low.
- Price pushes to 56. That exceeds the prior high of 54. So 56 is a higher high.
- Price dips to 55. Again it holds above the prior low of 53. Another higher low.
- Price pushes to 58, above the prior high of 56. Another higher high.
Count the structure: higher highs at 56 and 58, higher lows at 53 and 55. Both conditions are met, repeatedly. This is an uptrend, and you did not need an indicator, a trendline, or anyone's opinion to say so.
Also notice the dips to 53 and 55. At the moment they happened, they looked like the move might be over. Structure said otherwise, because each dip held above the last low.
What Actually Breaks a Trend
A trend ends when its structure fails, not when price has a bad day. The first warning sign in an uptrend is a failed high: price tries to push past the last high and cannot. That alone is a caution, not a conclusion.
The real break comes when price then falls below the most recent higher low. In our example, if price dropped under 55 after stalling below 58, the sequence of higher lows would be broken. At that point the uptrend, as defined, no longer exists. It might become a range, or the start of a downtrend. You do not have to predict which. You just have to stop calling it an uptrend. The mirror image, a failed low followed by a break of the last lower high, ends downtrends the same way, and it is the mechanics behind every bull and bear market in history.
Distinguish this from noise. A one-bar dip that holds above the last low is noise. A deep pullback that still holds above the last low is still noise, structurally. Only a violation of the last confirmed swing low changes the label. This rule will save you from both panic exits and stubborn holding.
Uptrend, Downtrend, and Range Side by Side
| Market State | Structure | Who Is in Control | What Ends It |
|---|---|---|---|
| Uptrend | Higher highs and higher lows | Buyers, willing to pay more on each dip | A failed high followed by a break of the last higher low |
| Downtrend | Lower highs and lower lows | Sellers, willing to sell lower on each bounce | A failed low followed by a break of the last lower high |
| Range | Highs and lows with no consistent order | Neither side; price rotates between boundaries | A sustained break beyond the range boundary that holds |
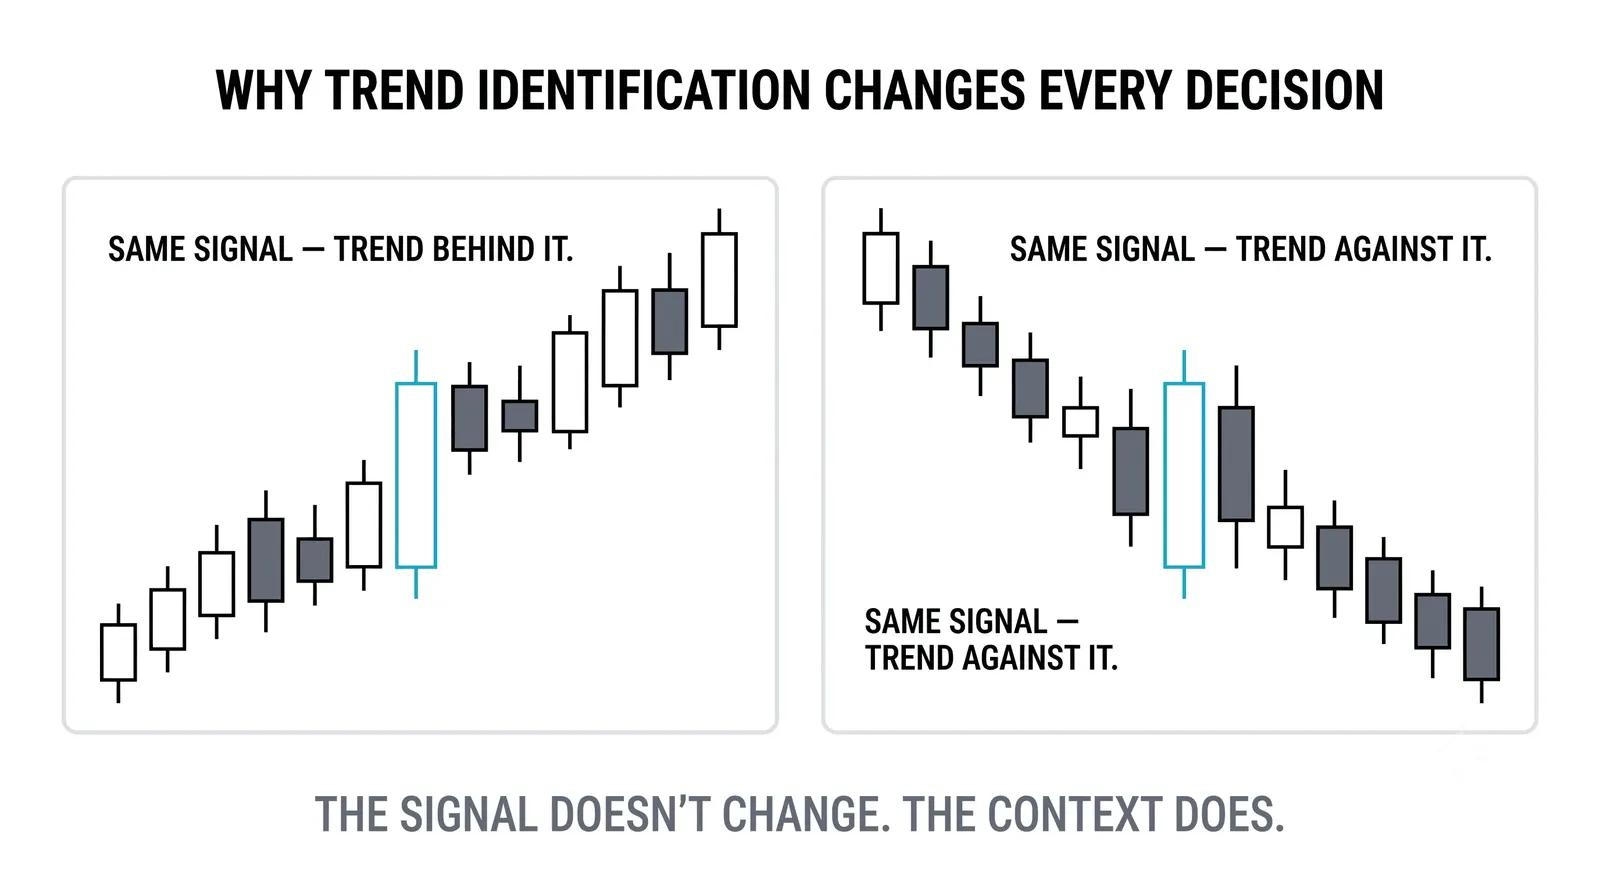
Keep this table in mind whenever you open a chart. Before you think about entries, ask which row you are looking at. If you cannot answer, the honest answer is range, and ranges call for different behavior than trends.
Questions About Trends
How many highs and lows before a trend exists?
Two of each is the minimum honest answer. Two higher highs and two higher lows give you a confirmed uptrend; two lower highs and two lower lows confirm a downtrend. One higher high is just an event. Two of each is a pattern. More than two is stronger evidence, but two is where you are allowed to start using the word trend.
Can a trend be traded from the middle?
Yes, but with worse odds and a tighter plan. Entering mid-move means your stop sits further from the obvious structural level (the last swing low in an uptrend), so your risk per trade grows or your position shrinks. Many experienced traders wait for the next pullback toward structure instead. If you do enter mid-trend, define your invalidation point before you enter, not after.
Does a trendline define the trend?
No. Structure defines the trend; a trendline only draws a rough sketch of it. You can draw three different trendlines on the same chart and get three different answers, which tells you how much information they carry. A broken trendline with intact higher lows means nothing has changed. A broken swing low means everything has changed. Learn structure first, then use trendlines as a visual aid if they help you.
Do trends exist on all timeframes?
Yes, and they nest inside each other. A downtrend on the daily chart can contain a clean uptrend on the 15-minute chart, which itself contains small ranges. Neither is wrong; they are different resolutions of the same market. This is why you must state your timeframe before you state your trend. "The market is trending" is meaningless. "The 1-hour chart is in an uptrend inside a daily downtrend" is a usable statement.
Your next step: open any chart, mark the swing highs and lows by hand, and label the structure on three different timeframes. The core logic of higher highs and higher lows turns those labels into a repeatable read. Do this daily for two weeks before you learn anything about entries, because every entry technique you will meet later assumes you can already do this without thinking.