Tape Reading: Time and Sales, Live
Tape reading is the craft of reading time and sales, the raw print-by-print record of every executed trade with its price, size, time, and aggressor side, and judging the speed and size of that stream to tell who is actually initiating. Every other order flow tool in this block is an organized view of this one feed. The delta lines sum it. The per-bar charts split it. Cumulative delta stacks it. This lesson goes to the source they all summarize.

Think of it like the clatter of a telegraph in an old newsroom: a steady tick is a quiet day, a sudden burst of clatter is breaking news, and one long clatter does not by itself mean the news is big. The raw tape works the same way. Rhythm first, content second.
The Four Columns
Every print on the tape carries four facts. Price tells you where the trade executed. Size tells you how many shares, contracts, or lots changed hands. The timestamp fixes the exact moment, down to fractions of a second on modern feeds. The aggressor side tells you who crossed the spread: a trade that lifted the offer was initiated by a buyer, a trade that hit the bid was initiated by a seller.
That fourth column is the one new traders underestimate. A 500-lot trade means one thing if a buyer reached up to take the ask and the opposite if a seller reached down to hit the bid. Same size, same price sometimes, opposite intent.
A tick, in this context, is simply one print, one executed transaction appearing in the window. Older usage ties the word to the smallest price increment, and both meanings survive, so context tells you which is meant. On the tape, a tick is a heartbeat of the market: one trade, recorded, gone.
Read the four columns together and each print answers a small question. Who acted, how much, where, and when. One answer alone is trivia. A stream of answers in sequence is a story.
Speed, Size, and Sequence
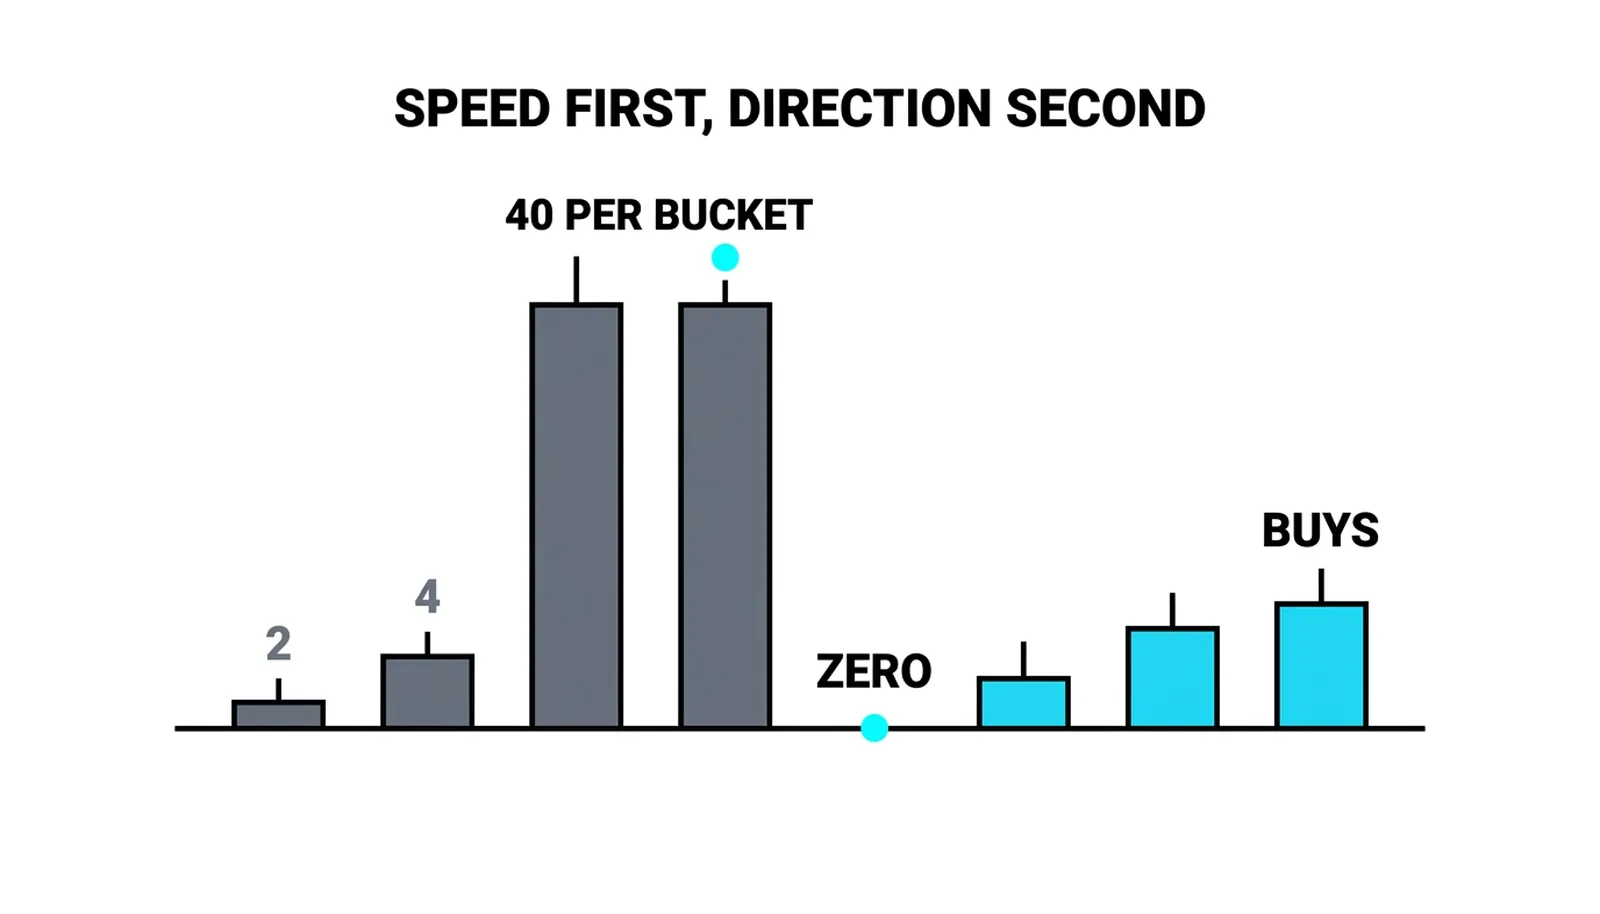
Speed is the first thing experienced readers feel before they can explain it. A market drifting along at a few prints per second that suddenly fires dozens per second near a level is telling you something changed. Acceleration is the pre-warning. Order flow analysis flags exactly this pattern close to turns, the burst of activity that arrives at a level before price itself confesses.
Size needs more skepticism. One huge print feels decisive and usually is not. A single 2,000-lot sell can be one trader exiting a winner, liquidation dressed as aggression. It says nothing about what comes next. Trust size only when it repeats in an area, when large prints keep appearing at the same prices. Repeated size is a position being built or defended. Lone size is often just someone leaving.
Sequence is where the tape earns its reputation. Watch for clusters of one-sided prints driving into a level, then drying up. The sellers were aggressive, the prints were fast, and then the flow thins. That drying is information: the initiative is exhausting itself. The prints that follow matter most. The first trades on the other side, buyers lifting the offer after a sell-side storm, are the tape's version of a turn.
None of this is new. The classic tape readers made their deductions from every succeeding transaction, every shift of the market kaleidoscope, reading a paper ribbon in a bucket shop. Today the same feed arrives in the time and sales window, plus the organized views built on top of it. The raw material has not changed in over a century. Only the display has.
Reading the Tape Today
Two honest cautions belong here.
First, on fast markets the raw tape scrolls faster than any human reads it. During a news release or a stop run, prints blur past by the hundreds per second. This is exactly why the organized views exist. The per-bar chart splits the stream by price within each candle, and the delta lines sum it into a running total. Modern tape reading is usually reading those views, not chasing the raw stream. The raw window still matters at slow moments and at key levels, when every individual print is legible and each one counts.
Second, prints are executed trades only. They never show the resting orders that absorbed them. A furious run of sell prints into a price that will not fall is absorption happening in front of you, but the tape alone cannot tell you the size that sat beneath. It shows the hits landing, never the pillow. That is why the tape earns its keep alongside the order book and the per-bar charts, never alone. The book shows intent, the tape shows action, and the turn lives in the gap between them.
Ninety Seconds at 47.80
A hypothetical illustration, round numbers, invented for teaching. Price has been sliding for the last hour toward 47.80, a level that held twice earlier in the week. You are watching the raw tape because the market is slow enough to read print by print.
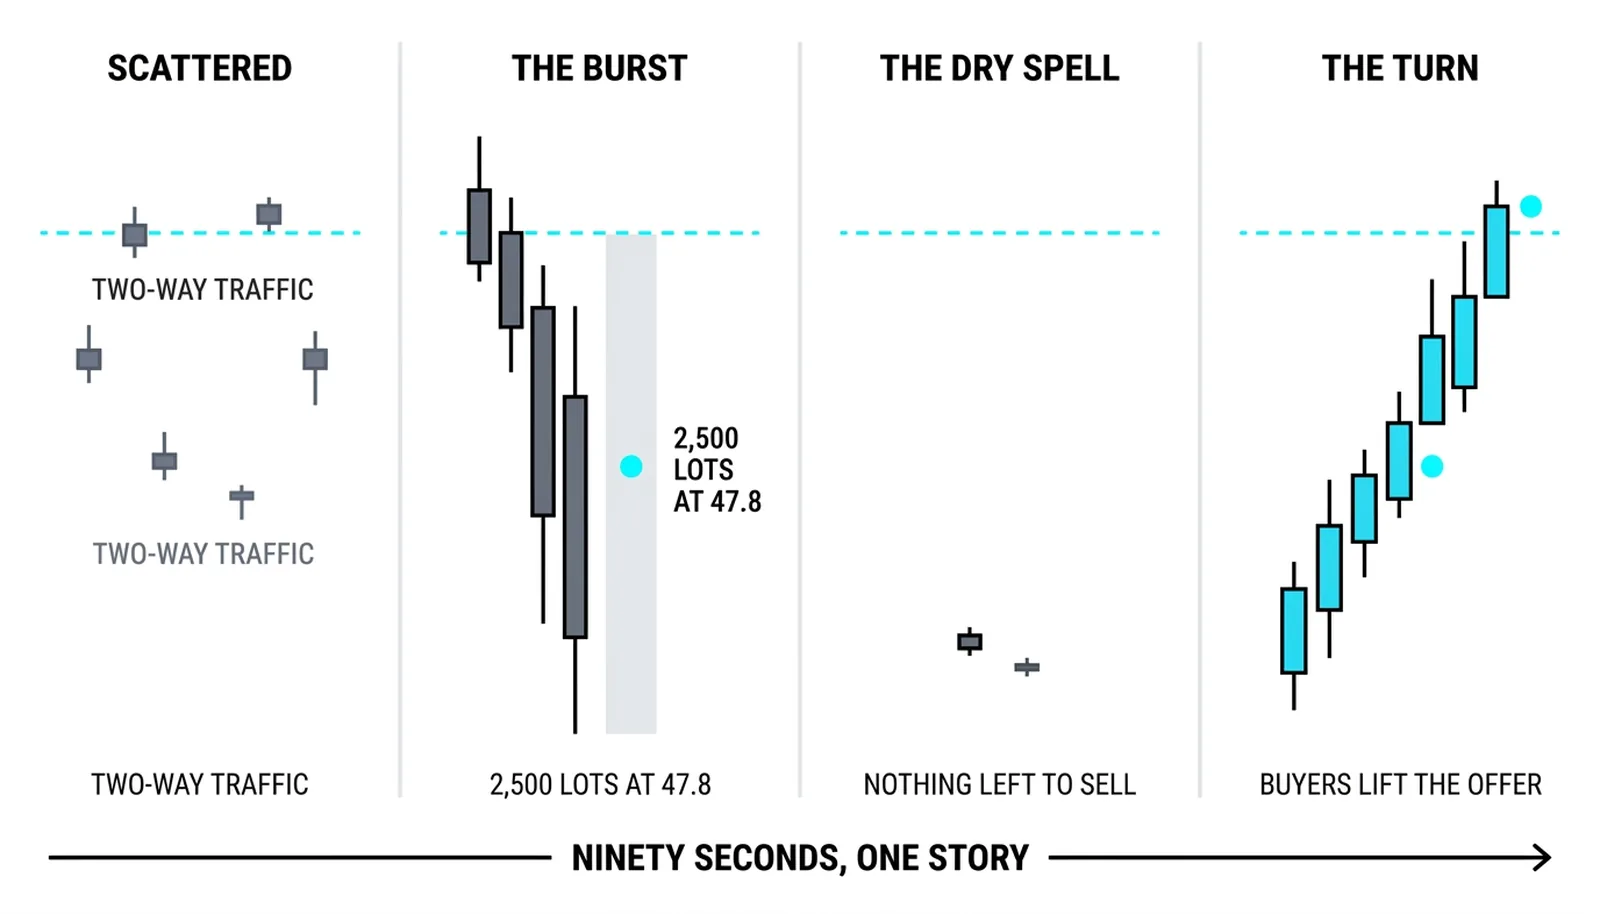
Stage one: scattered 100 to 300 lot sells print as price drifts from 48.10 down toward 47.90. Ordinary two-way traffic with a sell lean. Nothing to act on.
Stage two: the flurries accelerate. A burst of roughly forty sell prints fires in twenty seconds as price touches 47.82. Speed is screaming. Taken alone, this looks like a breakdown beginning.
Stage three: one 2,500 lot sell hits at 47.80. Price does not move a single tick. The biggest print of the session produced zero progress. Someone absorbed all of it.
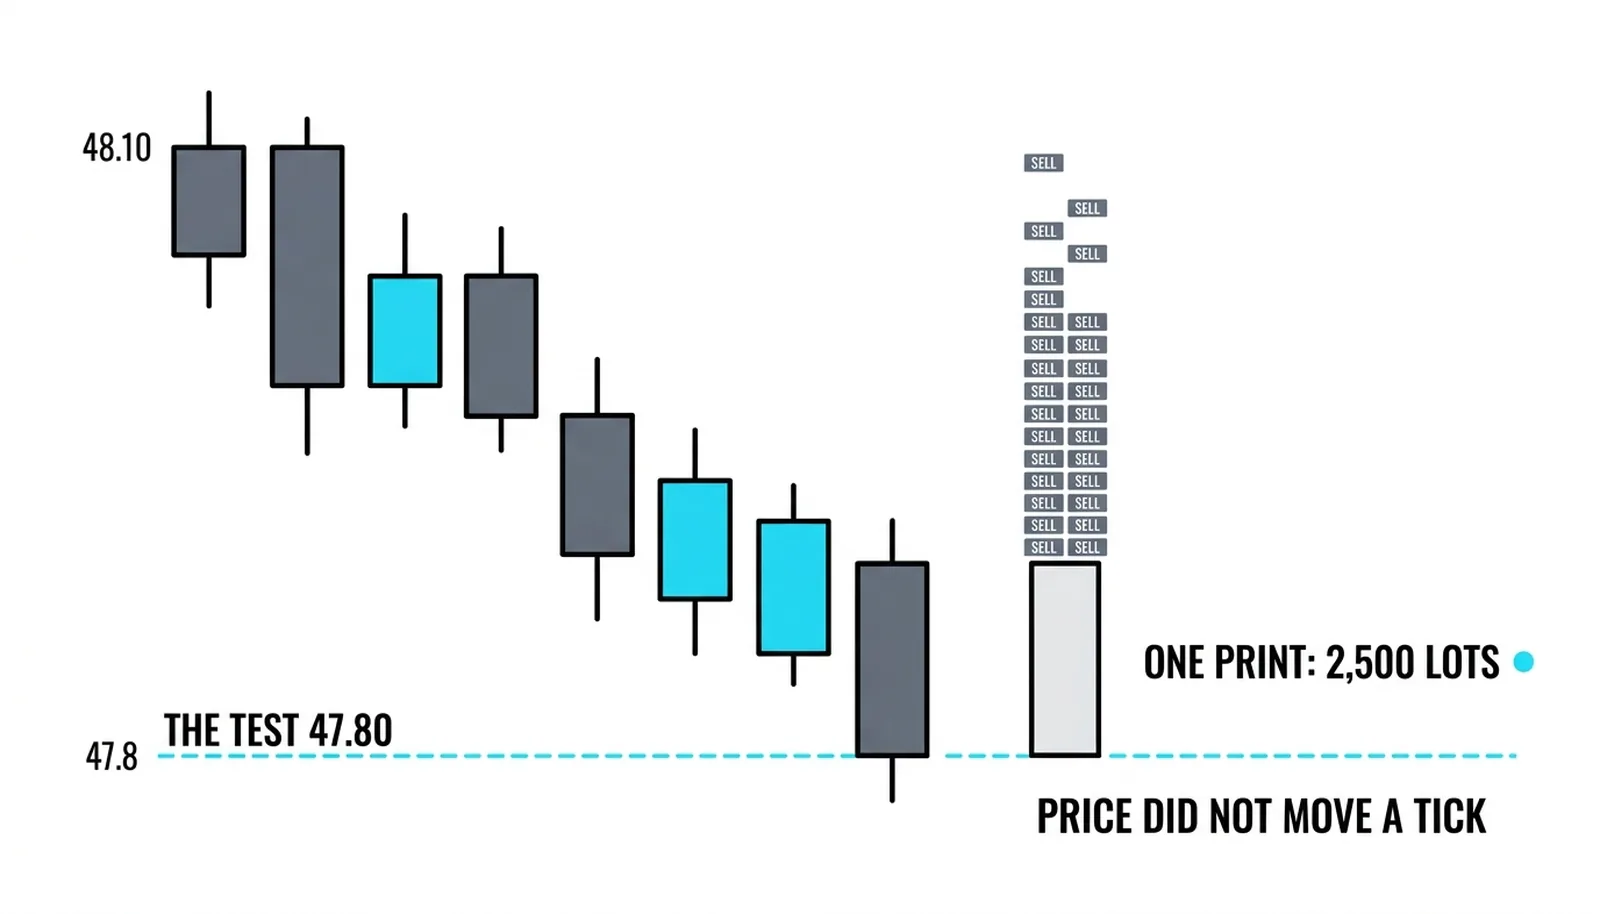
Stage four: within a minute the sells dry up. The stream thins back to scattered small prints, then the first 500 lot buy lifts the ask at 47.83. Another follows. Price walks up through 47.95 over the next few minutes.
Read as a sequence, the story is clean. Aggression accelerated into the level, the largest effort failed to move price, the aggressive side exhausted itself, and the other side took the initiative. Each element in isolation would have misled you. The forty-print burst alone suggested a break. The 2,500 lot sell alone suggested massive supply. Only the order of events, and price's refusal to fall, revealed the absorption and the turn.
| Print pattern | What it says | What it might mean | The trap |
|---|---|---|---|
| Scattered small sells | Routine two-way flow | Normal drift, no urgency | Reading trend into noise |
| Fast burst of sells at a level | Aggression accelerating | A test of the level is under way | Assuming the break has already happened |
| One huge sell, price unmoved | Large seller met larger absorption | Resting demand is defending the level | Reading size as bearish by itself |
| Sells dry, first buys lift the ask | Initiative changing hands | The turn is starting | Entering before the drying is confirmed |
Tape Reading, Answered
What is tape reading in trading?
Tape reading is the practice of judging a market from its stream of executed trades, the time and sales feed, rather than from charts or indicators. The reader watches price, size, timing, and aggressor side as they unfold and draws conclusions about who is initiating, who is absorbing, and when the initiative is changing hands.
What is time and sales?
Time and sales is the official record of every executed trade in an instrument, listed in order with its price, size, timestamp, and usually the aggressor side. It is the rawest market data available to a retail trader. Every order flow tool, from delta to the per-bar charts, is a reorganized version of this single feed.
Does tape reading still work with algorithms?
Yes, though the job has changed shape. Algorithms generate much of the modern flow, and their prints are as real as anyone's, so the tape still records genuine executed intent. What has changed is speed: during fast periods no human can read the raw stream, so the skill has shifted toward reading the organized views and reserving raw tape reading for slow moments at important levels.
How is tape reading different from reading a chart?
A chart summarizes completed trades into bars; the tape shows the trades themselves as they happen. The chart tells you price fell to a level and bounced. The tape can show you the burst of selling, the huge print that failed to move price, and the drying of the flow that made the bounce readable before the candle closed. One is the summary, the other is the source.
With the raw feed now readable, the block's final piece is the residue high frequency algorithms leave behind in that stream, the repeating patterns that reveal machine behavior hiding inside the prints.