Cumulative Delta: The Running Total
Cumulative Delta adds every bar's Delta into one running total for the session, a single line that shows whether buyers or sellers have done more initiating since the open. Where the per-bar number tells you who won a single exchange, the running total tells you who has been winning all day. Its divergences from price are among the sharpest turn warnings the tape offers.

Think of a marathon split clock: each mile's split matters less than whether your running total keeps you ahead of the pace, and a runner whose splits are slowing while the leaders push on is a runner about to be dropped. Price is the leader on the road. Cumulative Delta is the running total that tells you whether the pace underneath is still there.
Building the Running Total
The previous lesson covered the per-bar Delta, the net of aggressive buys minus aggressive sells inside one bar. This lesson owns what happens when you chain those numbers together. The construction is mechanical: take the first bar's Delta, add the second bar's Delta to it, keep adding. Each bar extends the line by its own contribution.
The slope is the information. A rising line means net buyer initiation across the session; more market orders are lifting offers than hitting bids. A falling line means net seller initiation. A flat line means the aggression has been balanced, whatever price has been doing in the meantime.
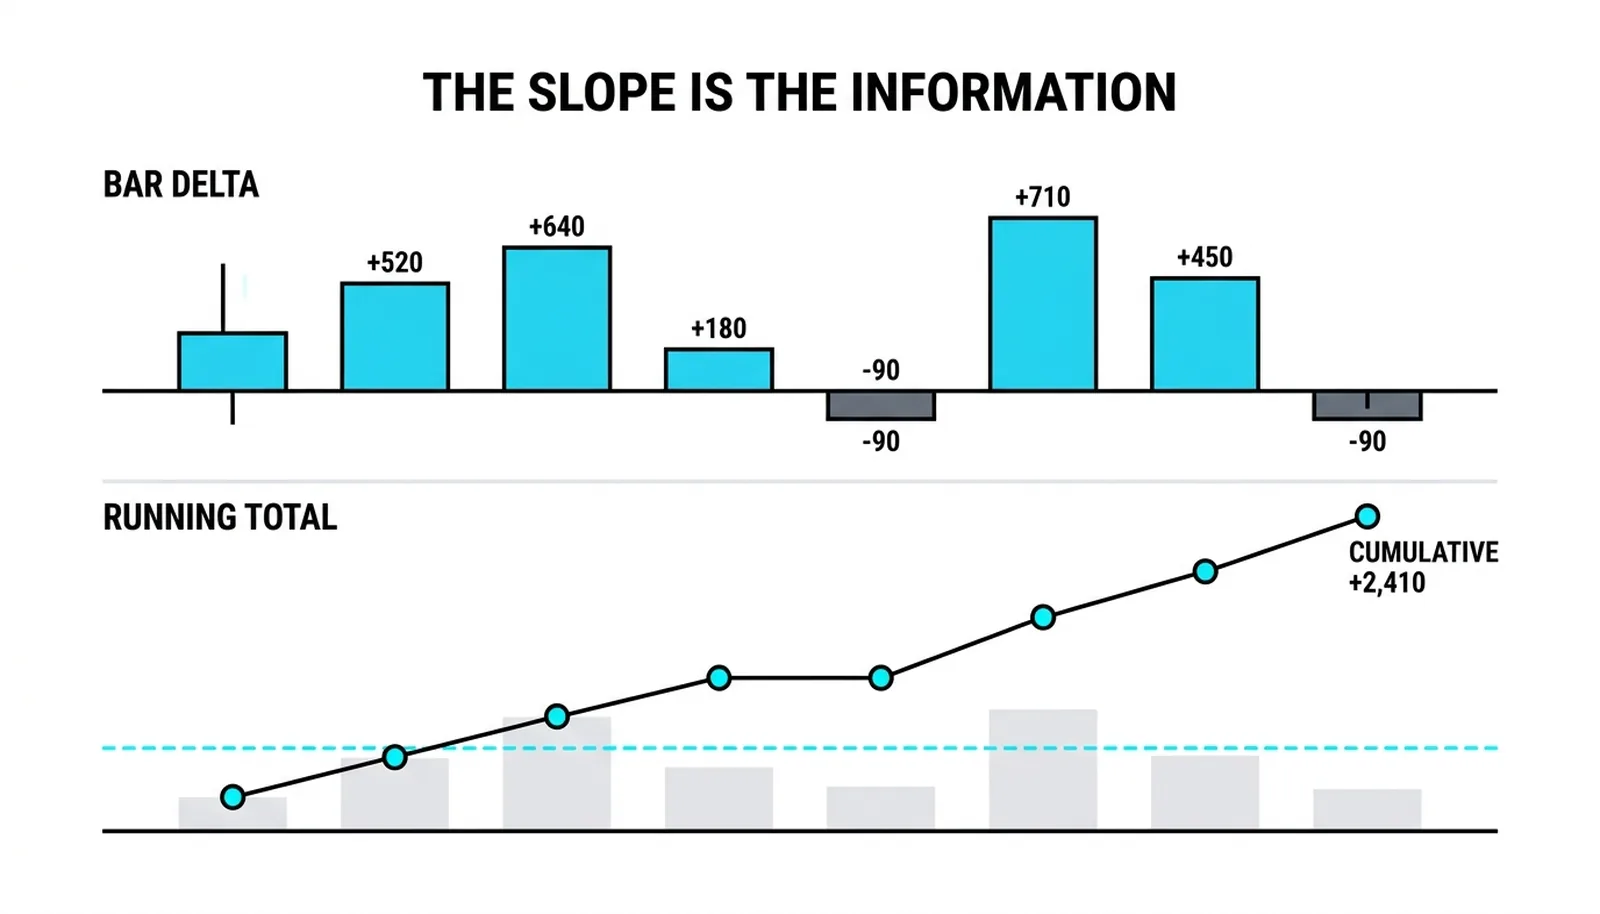
One detail matters more than most traders expect: the line depends on the session window. Most platforms reset cumulative Delta at each new session open, so the line answers the question "who has initiated more since today's open?" Anchored versions exist that start from an event, a news release, a gap, a specific low, and those answer a different question. Know which one your chart is drawing before you read anything into it.
The healthy read is agreement. Price makes a new high, cumulative Delta makes a new high alongside it. Buyers are initiating, price is responding, and the move is fueled. That alignment is the default state of a genuine trend, and it is the baseline every warning is measured against.
The Divergence Catalog
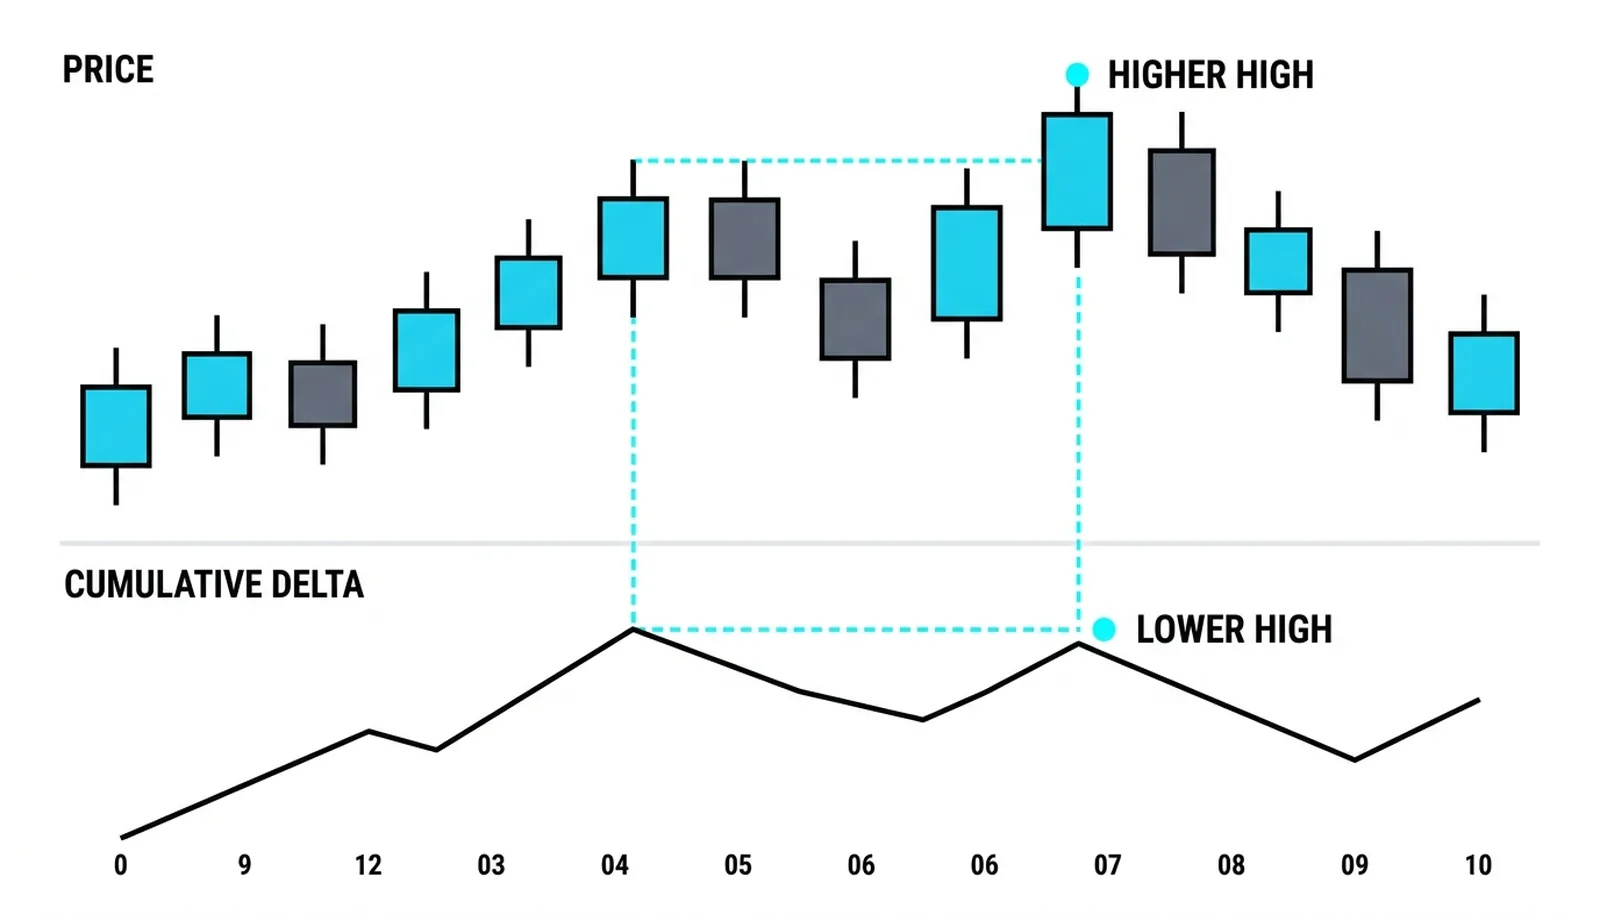
The first divergence is the one that ends rallies. Price prints a new high while cumulative Delta prints a lower high. The tape is rising, but the net initiation behind it is shrinking. Sellers are absorbing the buying under a rising tape, resting offers taking everything the market orders bring, and the move is running on thinner fuel than the chart suggests.
The mirror image ends declines. Price makes a new low while cumulative Delta refuses to, printing a higher low instead. Sellers are still hitting bids, price still ticks down, but the net aggression is fading. Buyers are absorbing the flush with resting bids, quietly taking the other side of every sell order.
The absorbed flush is the sharpest version of that pattern. Order flow analysis documented a Nasdaq session where retail selling drove cumulative Delta to a record low while price barely fell, a wall of resting institutional buys catching everything. Shortly after, a stacked imbalance printed and the market turned up. Price looked weak. The tape said the selling was being absorbed by someone with deeper pockets.
The pattern to carry forward: price shows you where trades printed, cumulative Delta shows you who had to chase to get filled. When those two disagree, the disagreement itself is the signal worth examining.
Reading Divergence Without Overclaiming
A divergence is a warning about the move's fuel, not a sell or buy signal in itself. Skipping that is how traders blow up on a real edge. Cumulative Delta can diverge for most of a trend day while the trend keeps going. Initiated aggression can fade for hours while passive flow and short covering carry price further than the divergence implied.
So the divergence earns attention at reference levels, not in a vacuum. A lower high in cumulative Delta at a prior swing high, a value area edge, or a major level from the higher timeframe is a warning with context. The same divergence in the middle of nowhere is noise with a story attached. Location decides whether the warning deserves a trade or just a tightened stop.
The window problem comes next. The line resets with each new session, so a divergence measured from today's open says nothing about yesterday's flow. An anchored line from a specific event answers a different question than a session line, and mixing the two produces confident readings of the wrong data. Check what your platform resets on before you treat any divergence as meaningful.
Confirmation closes the loop. After a divergence warns, you want evidence the fuel actually ran out: a failure to reclaim the level, a shift in the per-bar Delta, an imbalance printing against the old direction. The warning gets you watching. The confirmation gets you acting.
The Peak the Price Never Saw
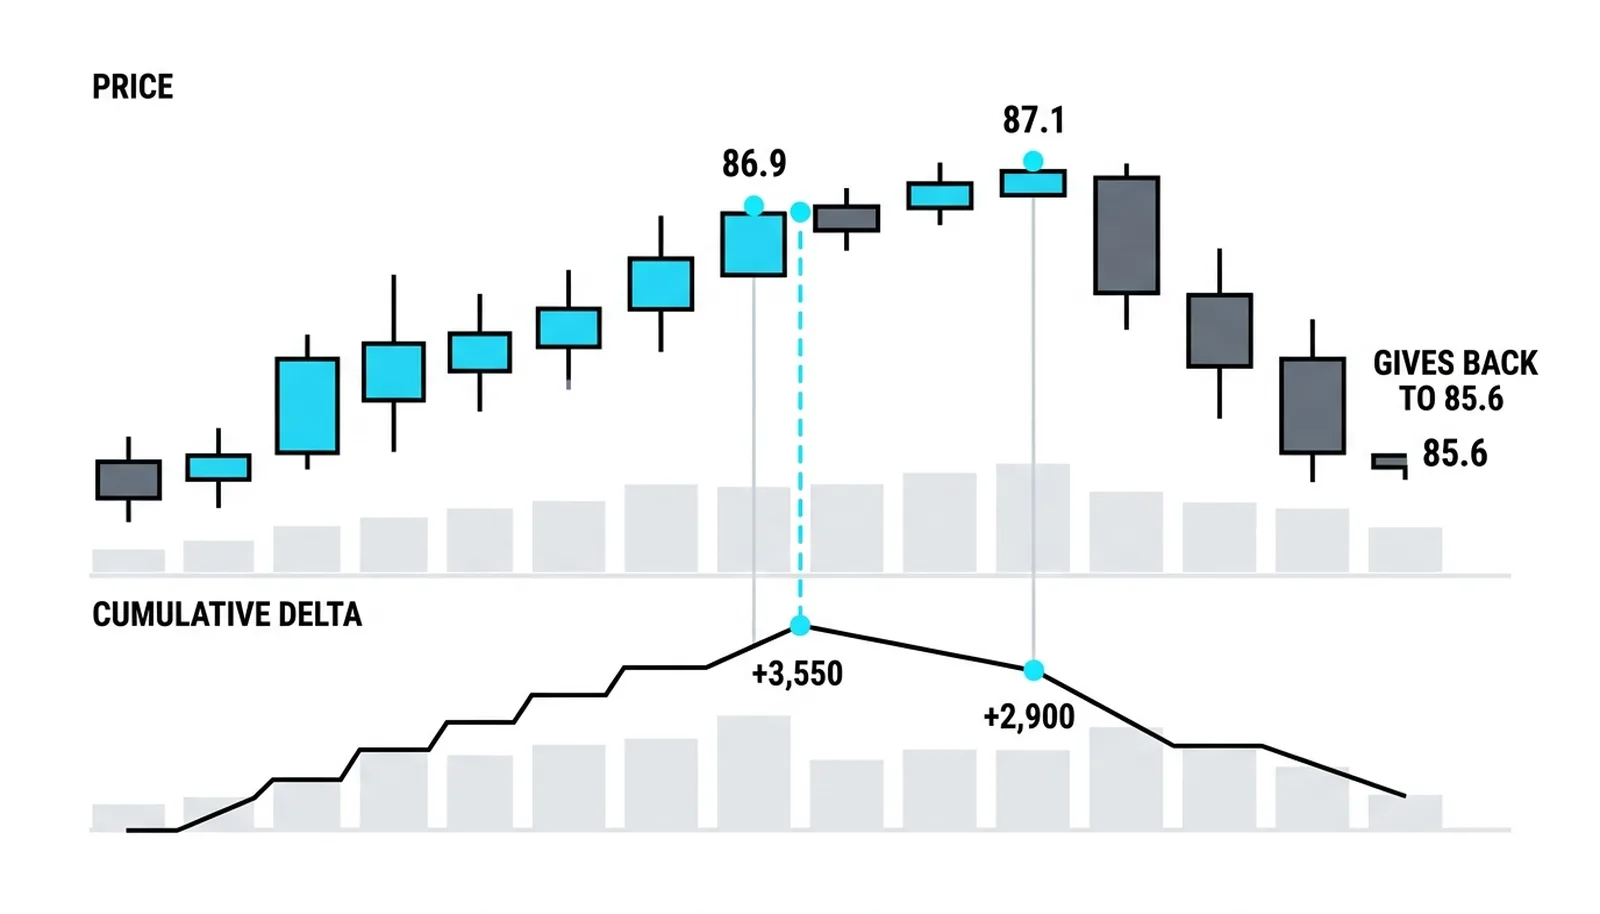
A stock opens at 84.2 and rallies through the morning. All numbers here are hypothetical and round, built to show the mechanics. By midday, price prints 86.9 and cumulative Delta sits at positive 3,550. Both are making highs together. The morning move is aligned: buyers are initiating, price is responding, nothing about the tape argues with the chart.
Early afternoon, price edges to a marginal new high at 87.1. Cumulative Delta only manages positive 2,900, a lower high. The runners' splits have slowed while the tape pushed on. Price is technically higher, but the net initiation that carried the morning is no longer there. Someone is selling into the strength, and the market orders are being absorbed rather than rewarded.
Forty minutes later, price trades 85.6. The divergence has been answered. The rally's fuel gauge flashed its warning at 87.1, and the move gave back the afternoon within the hour.
Read each stage on its own terms. The aligned morning said the rally was real and participation backed it. The midday divergence said the marginal buyer was gone and the new high was being sold into. Had the rally resumed instead, confirmation would have looked like cumulative Delta reclaiming and exceeding 3,550 on the next push, with price holding above 86.9. That never came.
| Session phase | Price | Cumulative Delta | The read |
|---|---|---|---|
| Midday high | 86.9 | +3,550 | Aligned, rally fueled by real initiation |
| Early afternoon | 87.1 | +2,900 | Divergence, new price high on shrinking aggression |
| Warning window | 86.9-87.1 | Failing to reclaim 3,550 | No confirmation, longs on borrowed time |
| Forty minutes later | 85.6 | Fading further | Divergence answered, move unwound |
The trader who watched only price saw a breakout to 87.1. The trader who watched the running total saw a move that had stopped refueling twenty minutes earlier.
Cumulative Delta, Answered
What is cumulative Delta in trading?
Cumulative Delta is the running sum of every bar's Delta across a session, one line showing net buyer or seller initiation since the open. A rising line means buyers have been the aggressors on balance; a falling line means sellers have.
What does a divergence between price and cumulative Delta mean?
It means the move is losing the initiated flow that built it. Price making a new high on a lower cumulative Delta high shows sellers absorbing the buying; price making a new low on a higher cumulative Delta low shows buyers absorbing the selling. It is a fuel warning, not an automatic entry.
When does cumulative Delta reset?
On most platforms it resets at each new session open, so the line measures aggression since today's open only. Anchored versions can start from a chosen event instead, and the two answer different questions, so confirm which one your chart displays.
Is cumulative Delta useful on its own?
No, and treating it as standalone is the most common misuse. Divergences can persist for hours inside a working trend, so the line earns its keep at reference levels and alongside confirmation from imbalances, per-bar Delta shifts, and price acceptance or rejection.
Next in the order flow block: the charts that read every transaction, where the running total stops being an abstraction and you can watch each fill hit the tape in sequence.