High Frequency Order Flow: Reading Algos
High frequency order flow is the machine layer of the tape: algorithms that fire thousands of orders per second, working positions for ticks at a time, far faster than any human hand. You will never out-race these systems, and you do not need to. Their activity leaves readable residue in the same tools this block has taught, and that residue is what this lesson trains you to read.

Think of footsteps heard through a ceiling: you rarely see who is moving upstairs, but the vibration tells you someone is there, and a steady walk sounds different from a sprint. The earlier lessons in this block read human-scale order flow, the absorption, exhaustion, and delta shifts that traders produce. This lesson names the other participant in the room and sets your stance toward it.
How Machines Trade
Most high frequency activity is not prediction. A large institution wants to buy or sell a position far too big for the visible book, so an algorithm slices that parent order into hundreds or thousands of child orders, each small enough to avoid shocking the price. Speed is the edge because the machine's profit per trade is often a tick or less, so it needs enormous volume of tiny wins and instant reaction to any order that crosses its path.
Two consequences follow for you. First, the machine does not care about your chart pattern; it cares about liquidity, where resting orders sit. Second, because the machine earns in ticks, it operates inside the noise zone where most retail stops live. That overlap is the source of nearly every frustration covered below.
The Residue They Leave
Machines are invisible in intent but visible in behavior. Four signatures show up again and again on the tape and the book.
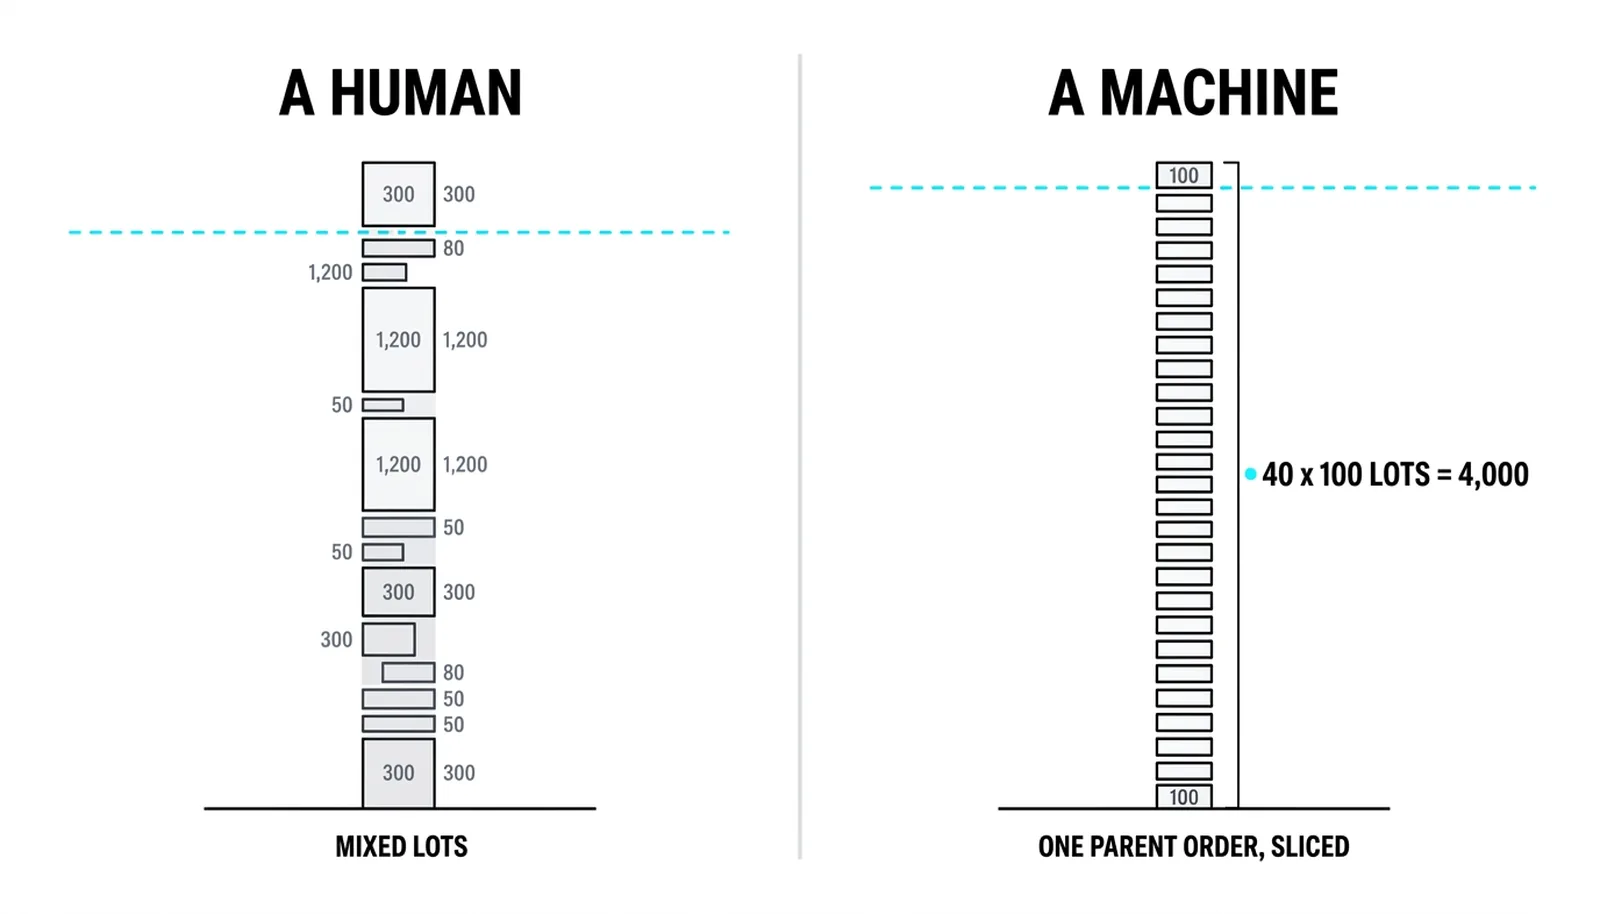
Clipped fills. Watch time and sales during a fast move and you will see trades printing in many small, same-size fills at one price, a string of 100-lot prints repeating like a metronome. That is a parent order being worked in slices. A human does not click the identical size forty times in a row; a machine does.
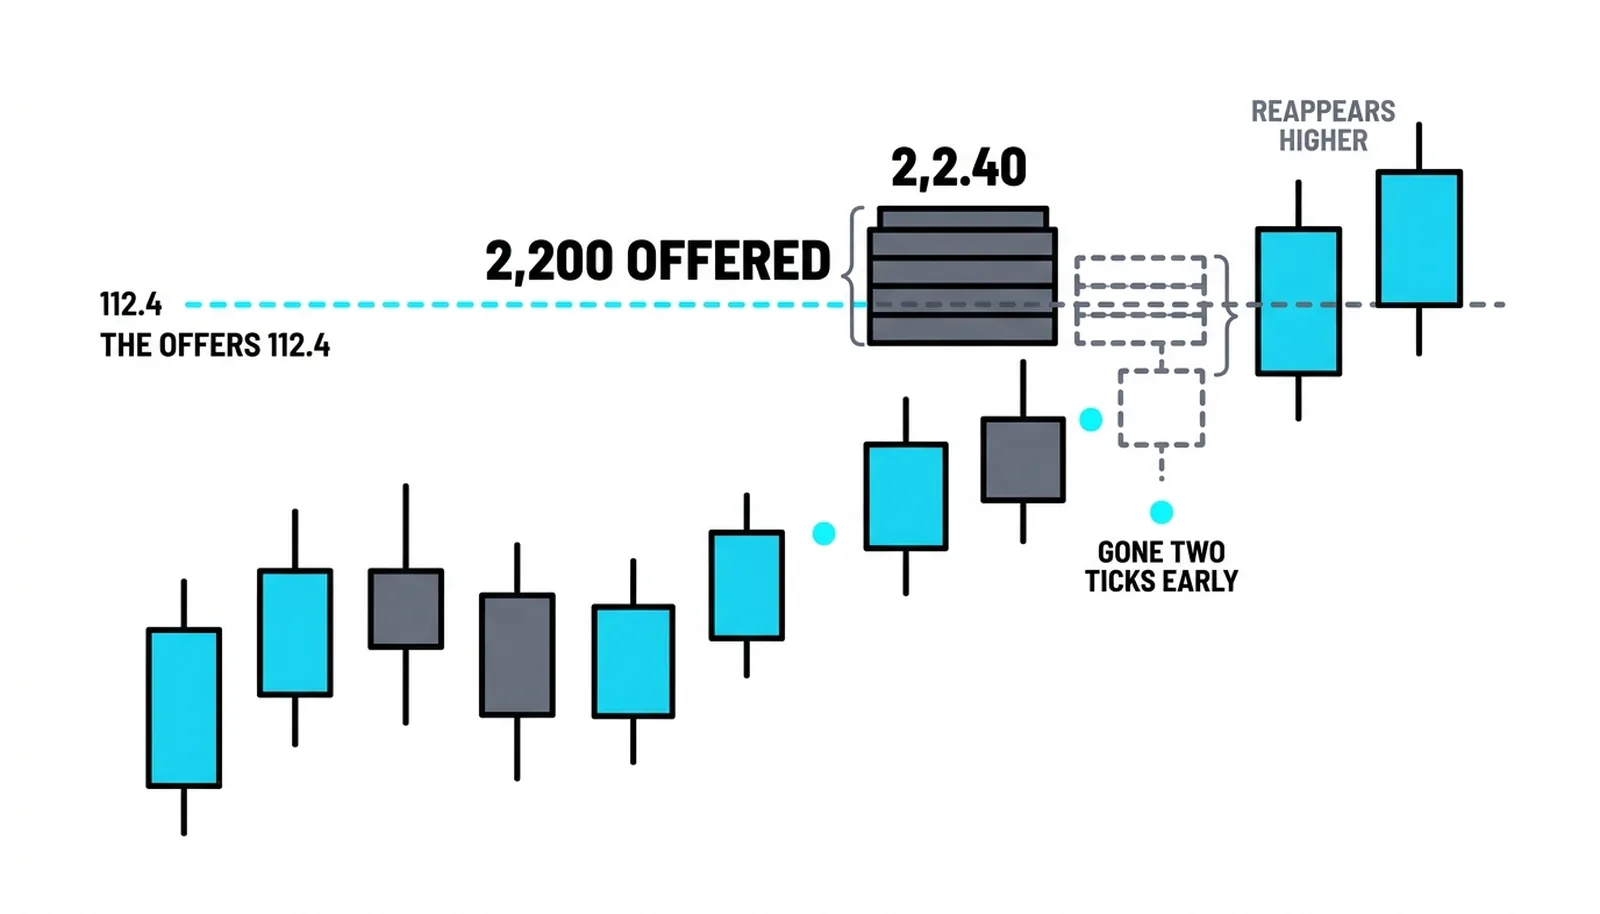
Flickering liquidity. Offers sit visible on the book, looking like a wall of supply, until price closes the distance. Then they vanish a tick or two before contact and reappear higher. Order flow analysis warns about this deceptive-order family: displayed size that was never intended to trade, placed to shape perception and pulled before it can be hit. The lesson is simple. The book shows intention, not commitment, and only executed trades count as fact.
Stop cascades. Day trading practice makes the point directly: algorithms hunt liquidity where trailing stops pile up. Stops cluster at obvious places, just beyond round numbers, just past yesterday's high, just under a well-watched trendline. A machine can push price those few extra ticks, trigger the stop chain, and fill its own orders against the forced flow. This is why markets print more false breakouts than they used to. The breakout is not a signal failing; it is a harvest.
The iceberg rhythm. A bid gets hit, and instead of breaking, it refills in identical chunks after every hit. Sell 200 at the bid, 200 more appear, again and again, while the traded volume at that price swells far beyond anything the book ever displayed. That is a machine absorbing, and it connects straight back to the absorption lesson earlier in this block. Same phenomenon, different author.
None of these signatures requires special software. Clipped fills and iceberg refills show on ordinary time and sales. Flickering liquidity shows on any depth display. Stop cascades show on a plain candlestick chart as long wicks through obvious levels that close back inside the range.
The Stance
The order flow framework's stance is worth keeping in spirit: the order flow day trader does not fear the high frequency systems, but trades like a leopard, patient, acting only when sure. Patience, in practice, means levels and confirmation rather than speed. You let the machine make its move through the level, you watch the residue it leaves, and you act on what the tape proves rather than what the breakout promises.
The first caution is the false break epidemic. A breakout through a well-known level is exactly where resting stop orders cluster, so expect engineered pushes through obvious levels as a routine event, not a rare manipulation. The defense is to demand confirmation instead of anticipation. A break that holds, retests, and accepts above the level is a different animal from a break that spikes and slams back inside. Waiting for that distinction costs you a few ticks of entry and saves you from most of the harvest.
The second caution cuts the other way. Do not sharpen stops to survive the flicker. Stop hunting thrives on tight stops sitting just beyond structure, because that is the cheapest liquidity in the market. The defenses are to trade fewer, better levels, to size the position so the stop can sit beyond the noise zone, or to stand aside entirely. Sitting with a stop inside the machine's reach is not caution; it is donation.
Blunt version: you cannot beat the machine at its game, and you do not have to play it.
The Break That Was Not
A hypothetical illustration with round numbers. A stock coils for an hour under 112.40, an obvious level everyone has marked, which means buy stops from breakout traders and short-sellers' exits rest just above it.
Stage one, the probe. Price clips upward in a string of 1-lot prints, tiny orders stepping the price toward the level. That is machine testing, cheap feelers checking how much sits above. A human does not buy one share at a time.
Stage two, the thinning book. The offers at 112.41 and 112.42 sit bright and heavy on the depth display, looking like resistance. When price comes within two ticks, those offers pull. The wall was decoration. Nothing real stood between price and the stop cluster.
Stage three, the pop and the flood. Price pops to 112.42, the buy stops fire, and instantly 4,000 contracts hit the bid in clipped 100-lot slices. A machine is distributing into the break, selling its position to the very breakout buyers and triggered stops it just engineered. The breakout print at the high is the loudest moment of the move and the least informative.
Stage four, the failure. Within three minutes, price closes back inside the range under 112.40. Every breakout buyer is trapped. The residue told the story at each stage: the probing 1-lots said testing, the pulled offers said no real supply above, the clipped 100-lot flood into the pop said distribution, and the close back inside said the break was a harvest, not a move.
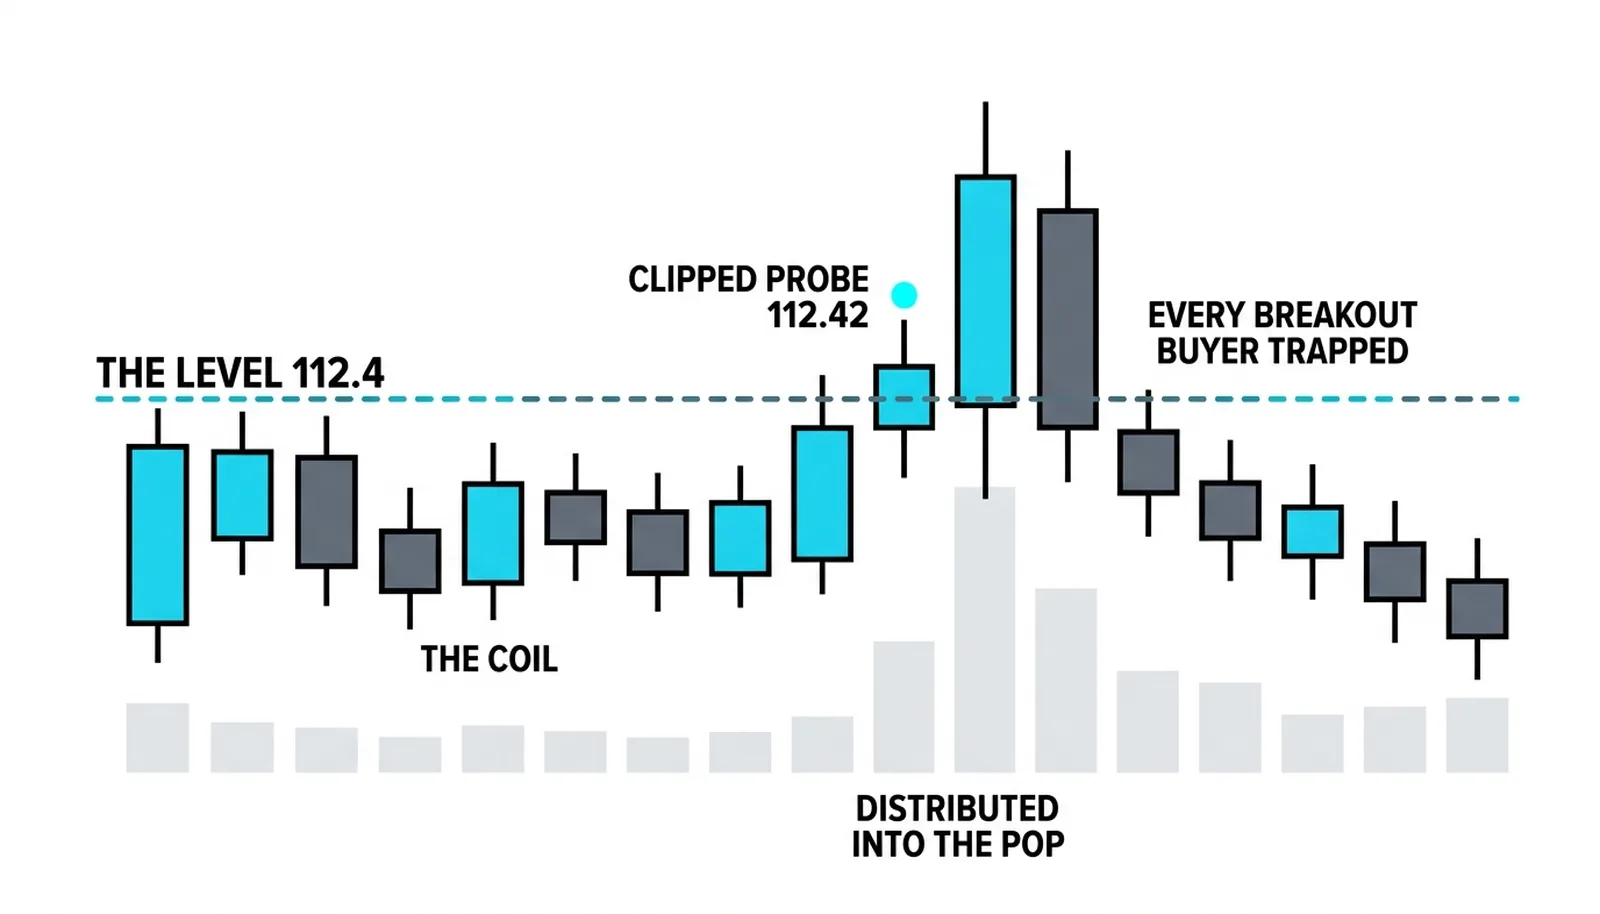
A trader who bought the break at 112.42 owns the top tick. A trader who waited for acceptance above the level never entered. The leopard read the residue and stayed flat, which in this case was the winning trade.
| Machine signature | What it looks like | What it means | The retail response |
|---|---|---|---|
| Clipped fills | Many small same-size prints at one price | A parent order being worked in slices | Note the side being worked; do not front-run it |
| Flickering liquidity | Offers or bids that vanish as price approaches | Displayed size was never meant to trade | Trust executed trades, not displayed orders |
| Stop cascades | Spike through an obvious level, fast reversal | Machines harvesting clustered stops | Demand confirmation; keep stops beyond the noise |
| Iceberg rhythm | A bid or offer refilling in identical chunks | Hidden size absorbing the flow | Respect the level; absorption often precedes reversal |
High Frequency Order Flow, Answered
What is high frequency order flow?
High frequency order flow is the stream of orders generated by algorithms trading thousands of times per second for ticks at a time, mostly slicing large parent orders or harvesting small pockets of liquidity. It dominates raw volume on most liquid markets, which is why the tape looks and behaves differently than it did decades ago.
How do algorithms affect retail traders?
They shape the two moments retail traders feel most: the false breakout through an obvious level and the stop run that tags a tight stop before price reverses. Both happen because algorithms seek resting liquidity, and retail stops are the most predictable liquidity in the market.
Can you see algorithmic trading on a chart?
Indirectly, yes. Long wicks through obvious levels that close back inside the range are the chart signature of stop cascades. Time and sales shows the clipped same-size fills and iceberg refills directly, and a depth display shows liquidity that flickers and pulls as price approaches.
How do you trade around high frequency systems?
Trade fewer, better levels, demand confirmation after a break instead of anticipating it, and size positions so stops sit beyond the noise zone rather than just past structure. Patience is the edge, since the machine cannot take anything from a trader who refuses to hand over a cheap stop.
This lesson closes the order flow block of Level 9. The next block turns from reading the tape to confirmation: how volume confirms price action signals, breakouts, and reversals, built on everything this block taught about who is actually initiating.