Internal vs External Structure
Internal structure is the family of smaller counter-swings that live inside a major price leg, real movements that never grow large enough to change the label on the trend itself. External structure is the sequence of major swing highs and swing lows that defines the trend on the frame you actually trade. Every trend you will ever read is built from both at once, and telling them apart is what keeps a chart honest.

Think of a cathedral's nave and its side chapels: the nave is the one long sweep the building is named for, and the chapels open off it as small rooms of their own that never move the walls. The external sequence is the nave. The internal swings are the chapels. A visitor can spend an hour in a chapel and the building is still the same cathedral.
The previous lesson gave you precise rules for marking swing highs and swing lows, so every label on the chart now means something exact. This lesson uses those same labels but asks a harder question: which of these swings run the trend, and which merely live inside it. The rules stay identical. Only the sorting changes.
Two Frames, One Truth
The same stretch of price can be one clean leg on the daily chart and a five-swing story on the one-hour chart. Neither view is wrong. They answer different questions.
On the daily frame, a move from one major low to the next major high may contain no counter-swing large enough to qualify under the marking rules. It reads as a single impulse. Drop to the one-hour frame and that identical stretch of price breaks into pushes and pullbacks, each with its own marked highs and lows.
Both readings are correct at the same time, because structure is frame-relative. A swing only exists in relation to the frame it is measured on. The daily chart is not hiding the smaller swings, and the one-hour chart is not inventing them. Each frame reports what qualifies at its own scale.
This is why arguments about which frame shows the real structure go nowhere. There is no single real structure. There is the structure of the frame you trade, the structure of the frame above it, and the structure of the frame below it, all layered over the same price.
The practical consequence is simple. Before you label anything, decide which frame owns the trade. Then read that frame's external sequence as the trend, and treat everything smaller as internal detail.
What Each Layer Decides
The external sequence owns two things: direction and invalidation. Direction comes from the order of the major swings, higher highs and higher lows for an uptrend, lower lows and lower highs for a downtrend. Invalidation comes from the swing that would break that order, the level where the trend label can no longer be defended.
The internal swings own two different things: location and stop tightness. A pullback inside a leg marks the closest place the trend's participants recently proved they will buy, and that proof is where entries live. The tighter the internal swing you build the trade around, the tighter the stop you can justify.
These jobs must not be swapped. When the external sequence says up, internal swings are shopping locations, not reasons to sell. When an internal swing breaks, the trend label does not change, because the trend was never written at that scale.
The test is always the same. Does the break touch the external sequence, or only the swings inside the leg? An internal break changes nothing about the external label. It only changes where the next entry lives.
Keep that test literal. Find the most recent external swing low in an uptrend. Anything that happens above it is internal weather, however dramatic it looks on a smaller frame.
The Frame Mix-Up Trap
Here is the expensive version of this lesson. A trader watching the one-hour frame sees price break below an internal swing low. On that frame, in isolation, it looks exactly like a change of character. The trader calls the trend over, exits longs, maybe even goes short.
But the daily frame owns the trend, and the daily sequence has not been touched. The break was internal. The premature reversal calls that follow this confusion are the most costly reading error in this whole section, because they put traders against trends that never actually ended.
The trap works because the two events look identical on the frame where they appear. A break of a swing low is a break of a swing low. Only the frame context tells you whether it was a load-bearing wall or a chapel door.
The tape-reading framework states the rule that prevents it: the frame above decides the direction, the frame being traded supplies the entry. The price action canon treats these as two separate jobs, and mixing them is how a trader ends up short a daily uptrend because a one-hour swing broke.
Build the habit in a fixed order. Read the external sequence first and write down the trend and its invalidation level. Only then drop to the internal swings to look for location. If the two ever seem to conflict, the external read wins by default.
One Leg, Two Stories
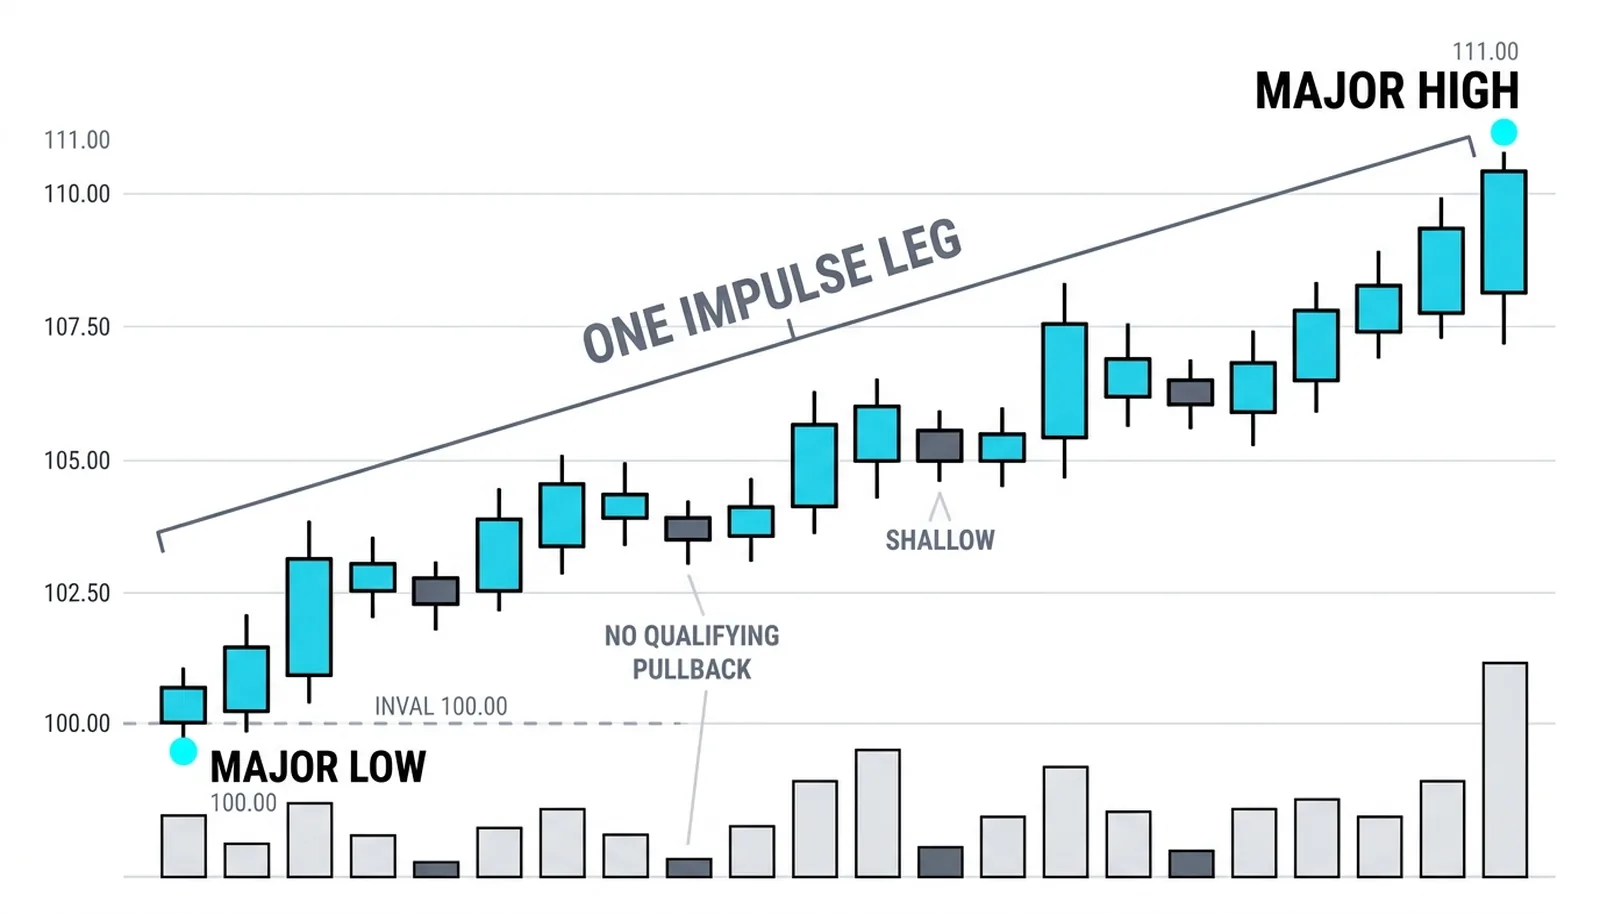
Here is a fully hypothetical illustration with round numbers. A daily uptrend leg runs from 100.00 to 111.00.
On the daily chart, using the marking rules, that entire leg is one impulse. No counter-swing inside it is large enough to qualify as a marked swing. The external structure says: one leg, uptrend intact, invalidation down at the origin of the move.
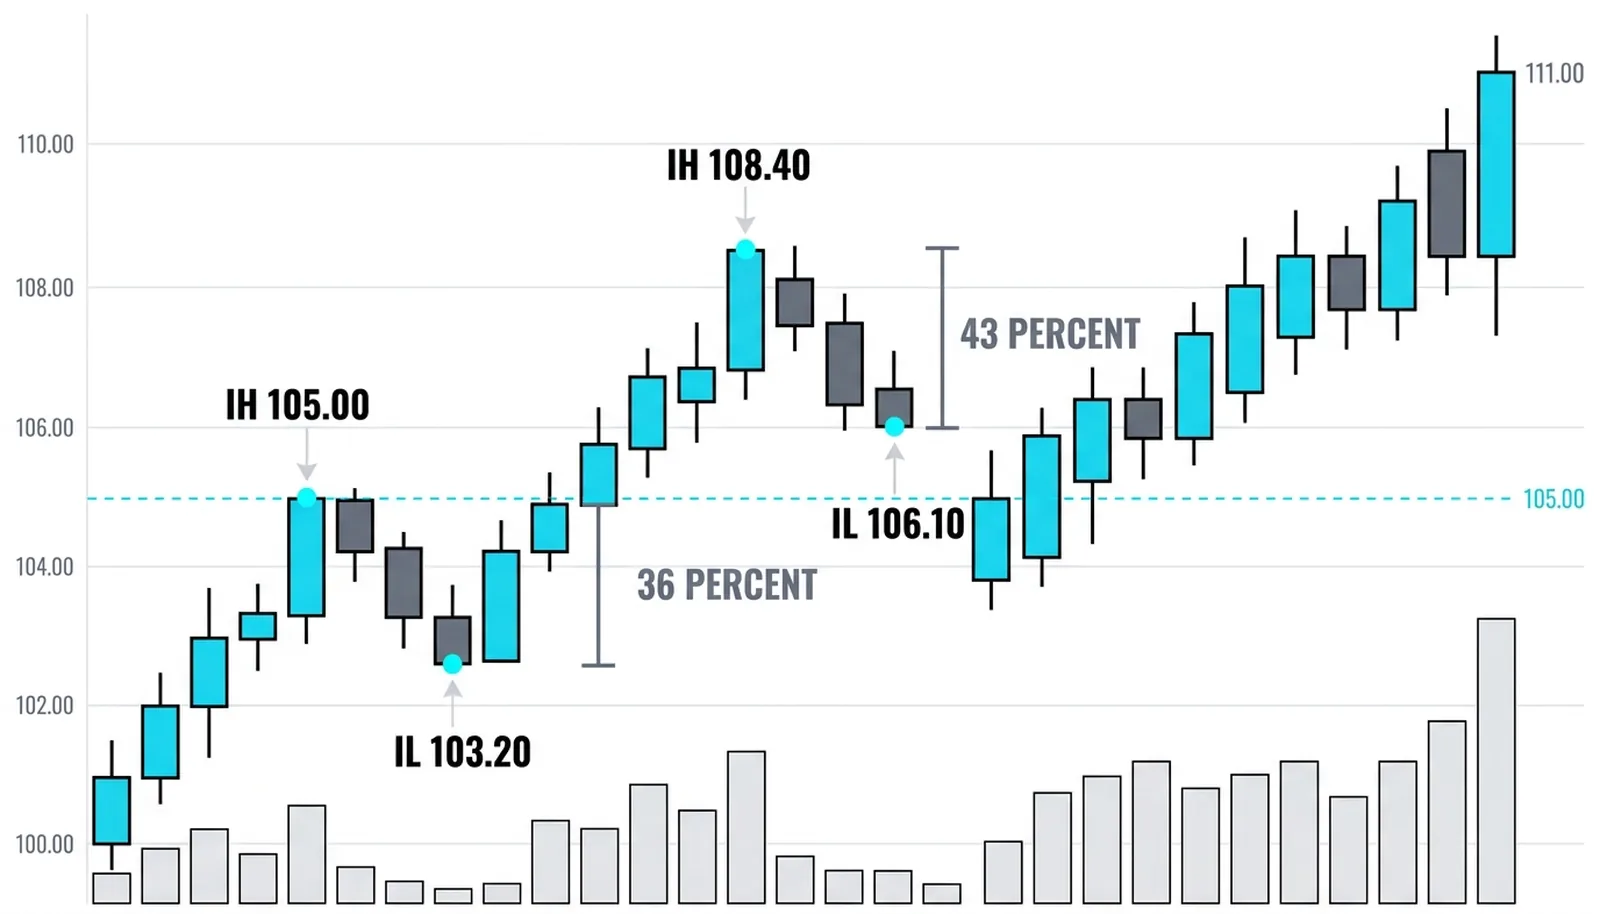
On the one-hour chart, the same stretch of price tells a longer story. It contains an internal high at 105.00, an internal low at 103.20, a second internal high at 108.40, and a second internal low at 106.10. Four internal swings, none of which appear on the daily at all.
Measure the corrections. The first pullback is 1.80 against a 5.00 first push, about 36 percent. The second is 2.30 against a 5.40 second push, about 43 percent. Both are ordinary corrections inside a healthy leg, and the one-hour sequence of higher highs and higher lows confirms it.
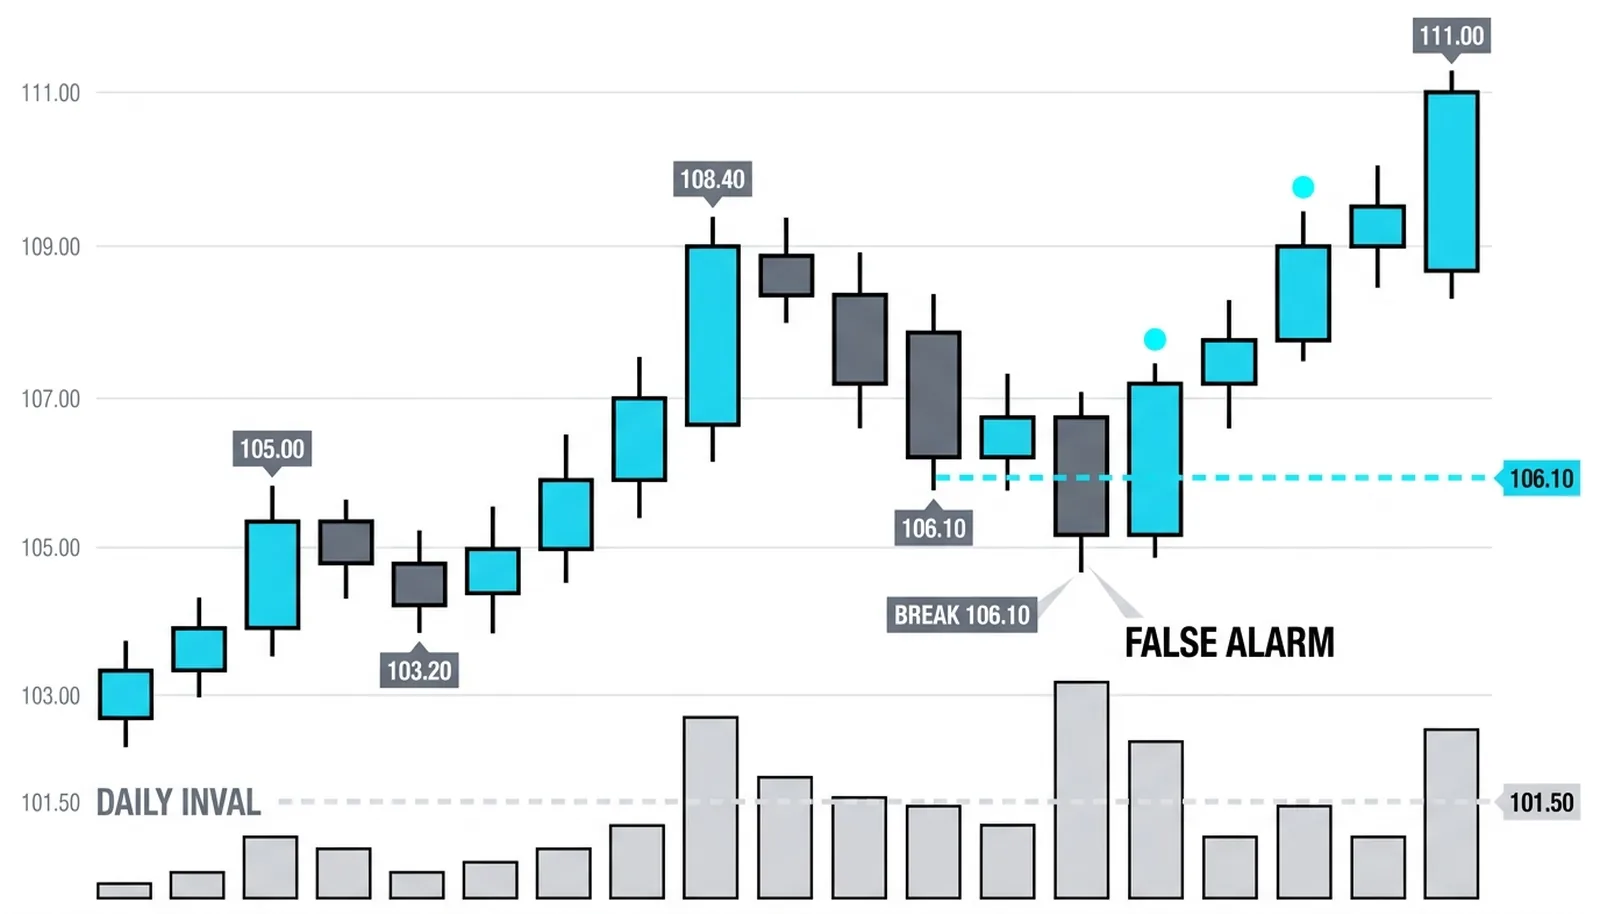
Now the trap in numbers. A trader watching the one-hour frame sees price break below 106.10 and calls a change of character. The daily sequence has not changed at all. The external leg is intact, its invalidation far below, and price runs on to 111.00 without the trader.
Now the internal-entry version, done correctly. The trader knows the daily trend is up and uses the one-hour internals only for location. The long is taken at 106.30, just off the second internal higher low at 106.10. The stop sits at 105.90, just below that low, risking 0.40. The first target sits under the internal high at 108.30, a gain of 2.00, roughly five times the risk.
The honest cost comes with that tight stop. A 0.40 stop is reachable by ordinary noise, the random jitter that means nothing at any scale. The reward for precision is a higher rate of small losses. Some of those 106.30 entries will be stopped at 105.90 and then watch price rally without them, and that is the price of admission for five-to-one geometry.
The internal read is also one more thing to get wrong. Every extra layer you consult is an extra layer you can misread. That is why the external sequence is checked first, last, and always, while the internal swings are consulted, never obeyed.
| Swing | Frame | Price | What it changes |
|---|---|---|---|
| External leg low | Daily | 100.00 | Trend invalidation if broken |
| Internal low 1 | One-hour | 103.20 | Entry location only |
| Internal low 2 | One-hour | 106.10 | Entry location and stop placement |
| External leg high | Daily | 111.00 | Confirms the uptrend continues |
Internal vs External Structure Questions, Answered
What is internal structure in trading?
Internal structure is the set of smaller counter-swings that live inside a major price leg. These swings are real, markable movements, but none of them grows large enough to change the trend label on the frame being traded. Their job is to provide entry locations and reference points for stop placement, not to define direction.
What is external structure?
External structure is the sequence of major swing highs and swing lows that defines the trend on the frame you actually trade. It is read with the same marking rules as any swing, but at the scale that owns the trade. The external sequence alone decides direction and the level at which the trend is invalidated.
Does an internal break change the trend?
No. A break of an internal swing changes nothing about the external label, because the trend was never written at that scale. It only changes where the next entry lives. The trend changes when the external sequence itself is broken, and not before.
Which frame should you trade?
Trade the frame whose external sequence you are prepared to respect, and let the frame above it confirm direction. A common pairing is the daily for the trend and the one-hour for entries, but the principle matters more than the pairing. Pick the frames before the trade, assign each one its job, and never let the lower frame overrule the higher one mid-trade.
Next, this deep dive turns to what happens when structure actually does change: how a trend ends, how a range begins, and how to read the transition without jumping early.