Impulse Moves vs Corrective Moves
An impulse move is the fast, directional leg of a trend, the stretch where one side dominates and price covers real distance, and a corrective move is the slower counter-drift that follows, the market digesting the impulse without undoing it. Every trend you will ever read alternates between these two speeds. Learn to tell them apart and the chart stops looking like noise and starts looking like a rhythm.

Think of a canoe crossing a lake: sudden surges of paddling, then long glides between them, the bow holding one heading all the way across. The surges are impulses. The glides are corrections. The heading is the trend.
The earlier lesson labeled the swing sequence itself, and the break-of-structure lesson covered the event that extends it. This lesson names the two speeds the sequence alternates between, because the shape of a trend is about how price travels, not only where it ends up.
The Three-Part Test
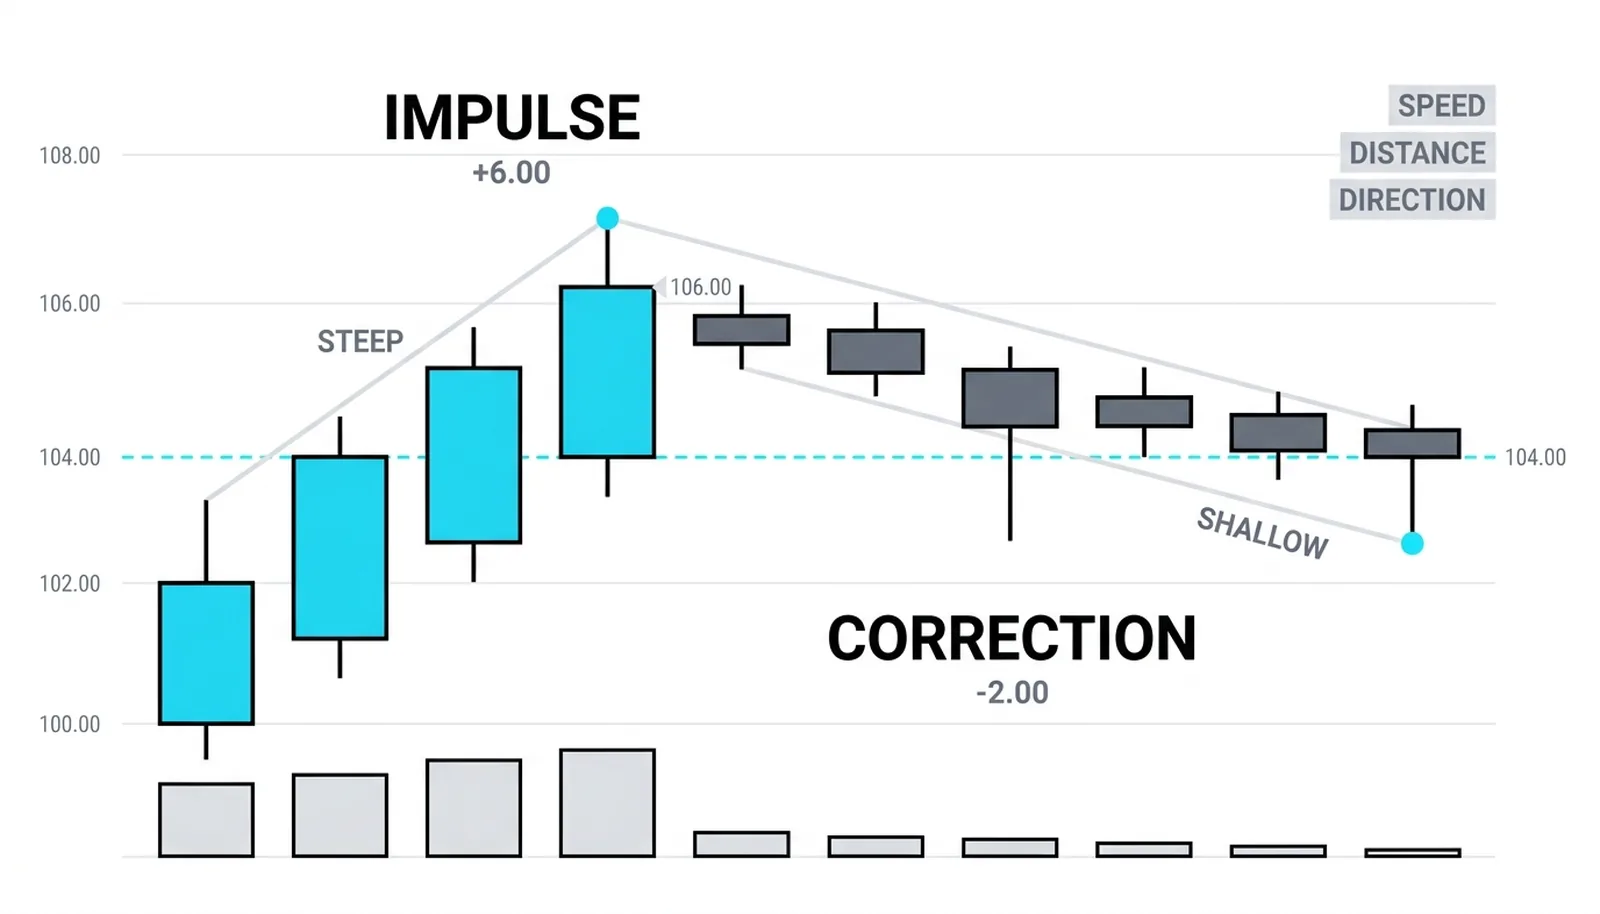
Speed, distance, and direction. Those three measurements separate an impulse from a correction with almost no ambiguity.
An impulse covers more distance in less time and moves with the trend. A correction takes more time to cover less distance and moves against the trend. If a leg is fast, long, and aligned with the prevailing direction, it is an impulse. If a leg is slow, shallow, and pointed the other way, it is a correction.
The price action canon gives the vocabulary its precision. A trend bar is a bar with a real body and a close near its extreme, and the impulse is built from sequences of exactly those bars. A pullback in an upswing is simply a bar whose low dips below the prior bar's low, and a correction is a sequence of those bars strung together. The price action canon also names the smallest tradable version: the breakout pullback, a pause of roughly one to five bars after a breakout, which is the correction in miniature.
Apply the test in order and the label usually falls out on its own:
- Speed. Count the bars. An impulse packs its travel into few bars; a correction sprawls across many.
- Distance. Measure the leg. Impulses are deep; corrections typically give back only a fraction, often a third to a half of the prior impulse.
- Direction. Check alignment. With the trend means impulse; against the trend means correction.
When two of the three agree, trust them. When all three agree, the label is as close to certain as this craft gets.
Why the Two Speeds Exist
Kam Dhadwar's auction market theory explains the mechanics underneath. During imbalance, one side of the market is effectively absent, so price moves directionally and fast. That absence is the impulse. But the market keeps advertising prices, searching for an opposite response, and the correction is exactly that search: the auction probing for the side that can slow the move.
So the two speeds are not decoration. They are the market doing its two jobs in turn. The impulse discovers where price can go when one side refuses to trade. The correction discovers where the other side is willing to step back in.
This is also what keeps the labeled sequence honest. Each impulse should extend the trend beyond the prior impulse's extreme, printing a new high in an uptrend or a new low in a downtrend. Each correction should hold above the prior correction's low in an uptrend, preserving the chain of higher lows. When an impulse fails to extend, or a correction travels too far, the sequence itself is telling you the imbalance is fading.
Watch what each speed does to the structure:
- Impulses build. Each one adds a new extreme and confirms the dominant side still has control.
- Corrections test. Each one asks whether the other side can do real damage, and the shallow answer confirms the trend.
- Corrections that deepen warn. A correction retracing most of its impulse is the auction finding genuine opposition.
A trend is healthy when its impulses are long and its corrections are short. When that ratio inverts, the trend is aging.
Trading Each Speed at Its Own Edge
In an established uptrend, the discipline is to buy the end of corrections, not the middle of impulses. The middle of an impulse is where late entries get punished by the next pullback, and where profits get handed back by traders who chase. The end of a correction is the cheapest place to join the trend with the tightest stop.
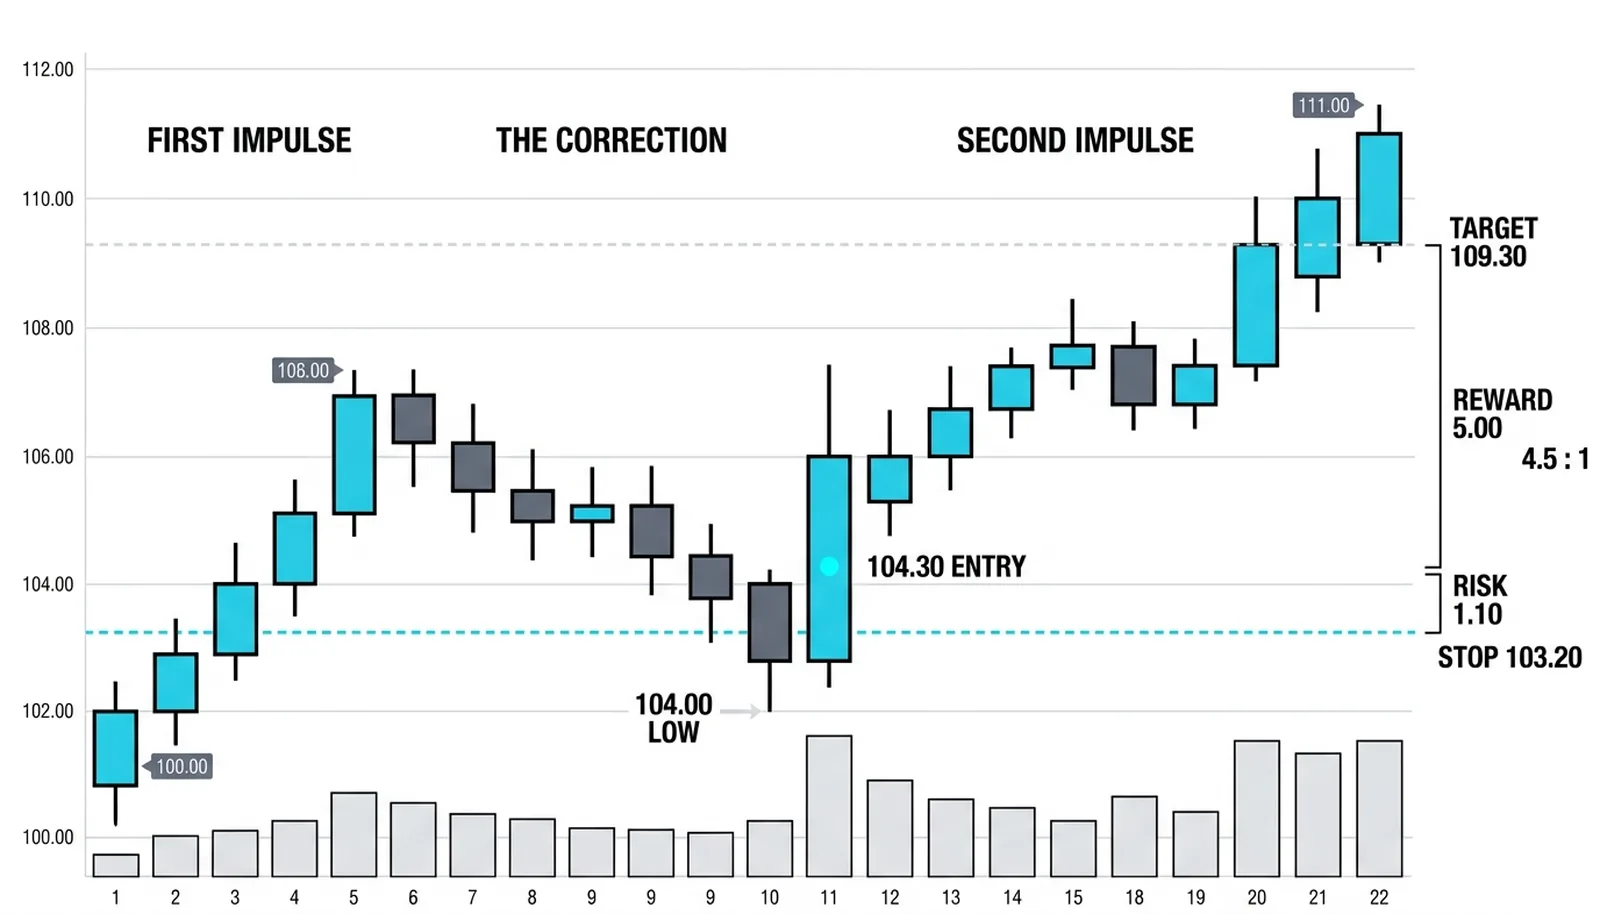
The mechanics are simple. The entry comes when the correction turns, when price stops printing lower lows and starts moving with the trend again. The stop sits below the correction's low, because that is the price where the corrective story would become something worse. Targets sit at the next structure ahead: the prior impulse high, a round level, a known supply zone.
Impulses have their own job in the plan. They are where trailing stops earn their keep. Once the correction has turned and the new impulse is running, the trader's work shifts from entering to holding, letting the fast leg do the earning while the stop ratchets up behind each new higher low.
Now the honesty, stated plainly. The label is assigned after the fact more often than during. A fast leg can stall into a correction mid-flight. A slow drift can accelerate into an impulse. And the correction that keeps extending is the trend changing underneath the trader. That is why the invalidation level matters more than the label. When price breaks the correction low that the trade was built on, the disciplined response is to stand down, not to argue with it.
The trade thesis lives and dies at that low. Everything else is commentary.
Two Speeds, Four Legs
Here is a hypothetical uptrend, all numbers invented and round, showing the alternation and the trade it offers.
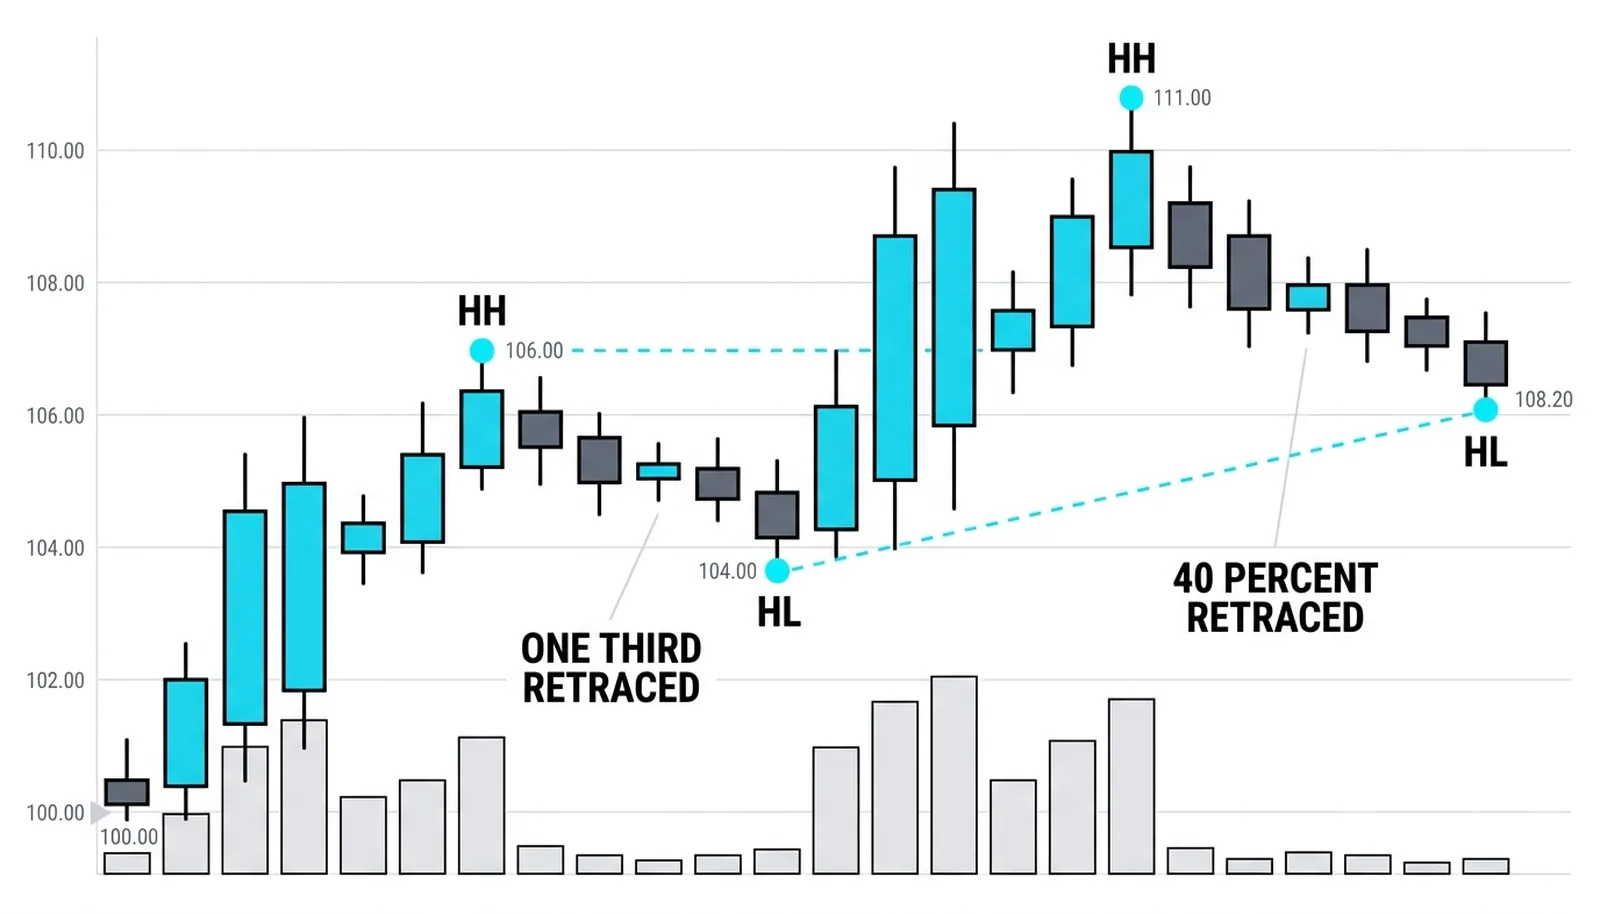
An uptrend begins at 100.00. The first impulse carries price to 106.00 in four sessions, a gain of 6.00. Fast, long, with the trend. The correction then drifts down to 104.00 over the next six sessions, giving back 2.00, one third of the impulse. Slower, shallower, against the trend. The second impulse runs from 104.00 to 111.00 in five sessions, a gain of 7.00. The next correction eases to 108.20 over seven sessions, giving back 2.80, about 40 percent of that impulse. Four legs, two speeds, one heading.
| Leg | Sessions | Distance | What It Tells |
|---|---|---|---|
| Impulse 1: 100.00 to 106.00 | 4 | +6.00 | Fast and long; buyers in control |
| Correction 1: 106.00 to 104.00 | 6 | -2.00 | Slower, one-third retraced; healthy digestion |
| Impulse 2: 104.00 to 111.00 | 5 | +7.00 | New extreme; the sequence extends |
| Correction 2: 111.00 to 108.20 | 7 | -2.80 | About 40 percent given back; higher low holds |
The trade: the long is taken when the first correction turns, at 104.30. The stop sits at 103.20, below the correction low of 104.00, risking 1.10. The target rests just under the round 110.00 level at 109.30, a gain of 5.00, roughly 4.5 times the risk. The correction supplied the cheap entry; the impulse did the earning.
The failed version matters just as much. Suppose the second correction keeps extending and price closes below 104.00. The higher low is gone. The correction has become something else, and the long stands down. No debate, no averaging, no waiting for the chart to apologize.
Impulse and Correction Questions, Answered
What is an impulse move in trading?
An impulse move is the fast, directional leg of a trend, built from trend bars that close near their extremes. It covers large distance in few bars, moves with the prevailing trend, and typically prints a new extreme beyond the prior impulse.
What is a corrective move?
A corrective move is the slower counter-drift that follows an impulse, a sequence of pullback bars moving against the trend. It takes more time to cover less distance, usually retracing a third to a half of the prior impulse while the market searches for the opposing side.
How do you tell an impulse from a correction?
Apply the three-part test: speed, distance, and direction. Fast, long, and with the trend means impulse; slow, shallow, and against the trend means correction. When all three agree, the label is reliable; when they conflict, wait for the next few bars to settle it.
When does a correction become a reversal?
A correction becomes a reversal when it breaks the level the trend depends on, the prior correction low in an uptrend or the prior correction high in a downtrend. A close beyond that level destroys the sequence of higher lows or lower highs, and the corrective label no longer applies.
Next in this level: the rules for marking swing highs and swing lows precisely, so the impulses and corrections you have just learned to separate get anchored to exact prices instead of impressions.