Market Structure: the Full Framework
Market structure is the complete sequence of swing highs and swing lows a market has printed, read in order, and the full framework is the discipline of labeling that sequence and letting it answer three questions in order: which direction is in control, where control is being tested, and when the evidence has changed. The method is those three questions, in that order. Everything else in this lesson is the working detail.

An earlier lesson introduced the raw material, the swing highs and swing lows themselves, and the habit of reading them before touching any indicator. This lesson assembles that raw material into the framework you will use for the rest of this section. Think of a canyon wall of rock strata, layer pressed onto layer with the oldest at the bottom, the whole history of the place readable in one honest look at the sequence. A chart works the same way. The swings are already there. The job is to read them in order and believe what they say.
The Static Record
The price action framework draws the distinction cleanly: price action is the market's movement in a dynamic state, and structure is the static record that movement leaves behind. The chart on your screen is a completed record. It is never a forecast.
That distinction sounds academic until you watch it change behavior. A trader who treats the chart as a forecast keeps asking what the market will do next. A trader who treats the chart as a record keeps asking what the market has already proven. The second question has an answer. The first one never does.
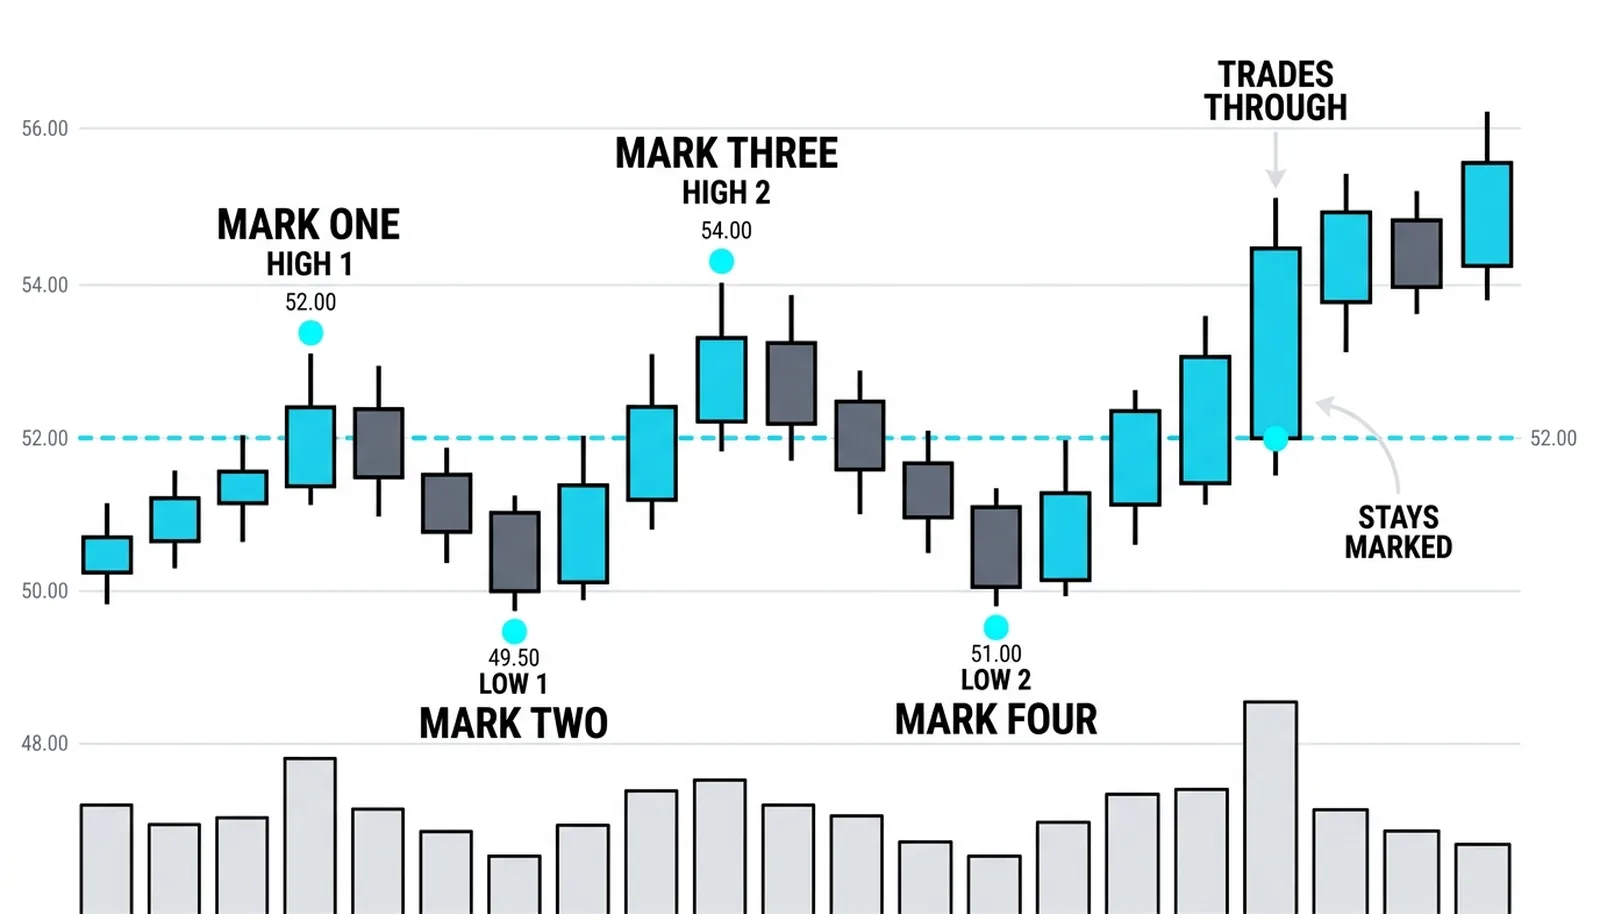
The record updates bar by bar. Each new bar either extends the current swing, completes it, or does nothing of interest. When a swing completes, it earns a label, and the label enters the sequence. Nothing is erased. Nothing is revised in secret. A swing high marked last week stays marked, even when price later trades through it, because the record of where the market once stopped is itself evidence.
This is why the framework tolerates uncertainty so well. You are never required to predict. You are required to keep the record accurate and to notice when the record changes character. The discipline is clerical before it is analytical, and that is a strength, because clerical work can be done the same way on a good day and a bad one.
The Three States
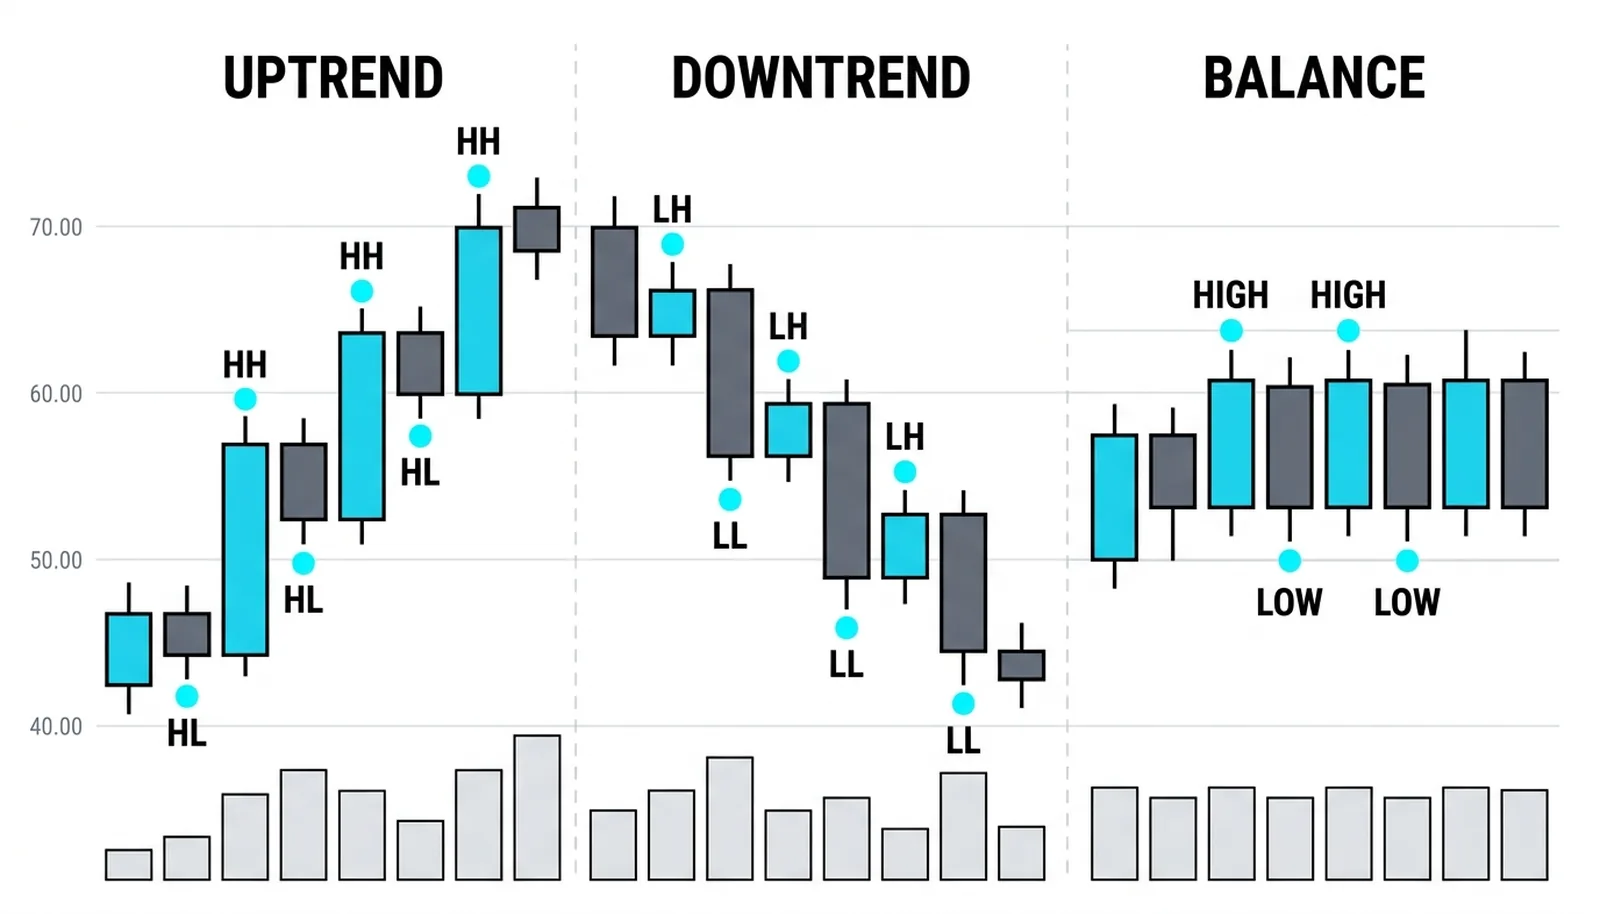
The price action canon defines the labels with useful precision: a higher high is a swing high above a previous swing high, a higher low is a swing low above a previous swing low, and a real uptrend requires the two to arrive together, several pairs in a row. A market printing higher highs but lower lows is not trending. It is fighting itself.
The uptrend, then, is the first state: higher highs and higher lows in sequence. Each new high proves buyers still control the peaks. Each new higher low proves sellers could not even push price back to the previous swing low. Both halves must be present. One without the other is an argument, not a trend.
The downtrend is the mirror. Lower highs and lower lows together, several pairs in a row. Sellers control the troughs, buyers cannot reclaim the prior ceiling, and the sequence descends. The logic is identical, only the direction flips.
The third state is the one beginners mislabel most. When highs and lows stop progressing and start arriving at roughly the same levels, the market is two-sided. Kam Dhadwar, building on auction market theory, names this state balance: the market rotating while it searches for prices both sides will accept. Its opposite is imbalance, the directional move that dominates while one side is effectively absent. Trends are imbalance. Ranges are balance. The labeled sequence tells you which one you are looking at.
Each state permits a different belief. In an uptrend you may believe pullbacks are temporary until the sequence says otherwise. In a downtrend you may believe rallies are temporary on the same terms. In balance you may believe neither, and you trade the rotation or stand aside. What you may never do is hold a belief the sequence has stopped supporting.
The Three Questions the Sequence Answers
The framework reduces to three questions, asked in a fixed order. Order matters because each answer constrains the next.
First, direction. Read the last few labeled swings. Higher highs with higher lows means long is the permitted side. Lower highs with lower lows means short. Overlapping swings at similar levels means the market is balanced and direction is undecided. This answer decides which side you are allowed to trade, and it forbids the other side.
Second, location. Read the most recent swing points, because those are the lines the current move is testing. In an uptrend the last higher low is the level the sequence currently rests on, and the last higher high is the level the market must clear to extend the proof. Location tells you where a trade is allowed, not merely which direction. A long taken far above the last higher low is a long taken with no structure underneath it.
Third, change. Read the events that would break the pattern. Every trend carries its own invalidation built in: the swing point whose loss would break the chain of higher lows or lower highs. That point is where the trade is wrong, defined before entry, not negotiated after. The next two lessons in this section cover these events in full, the break of structure as the trend's proof of continued control, and the change of character as the earliest warning that control is changing hands.
Direction chooses the side. Location chooses the place. Change chooses the exit if the evidence turns. A trade built on all three answers has a reason to exist. A trade missing any one of them is a guess, not a plan.
One Trend, Five Swings
The numbers below are invented and round, an illustration only, but the labeling procedure is exactly what you would do on a live chart.
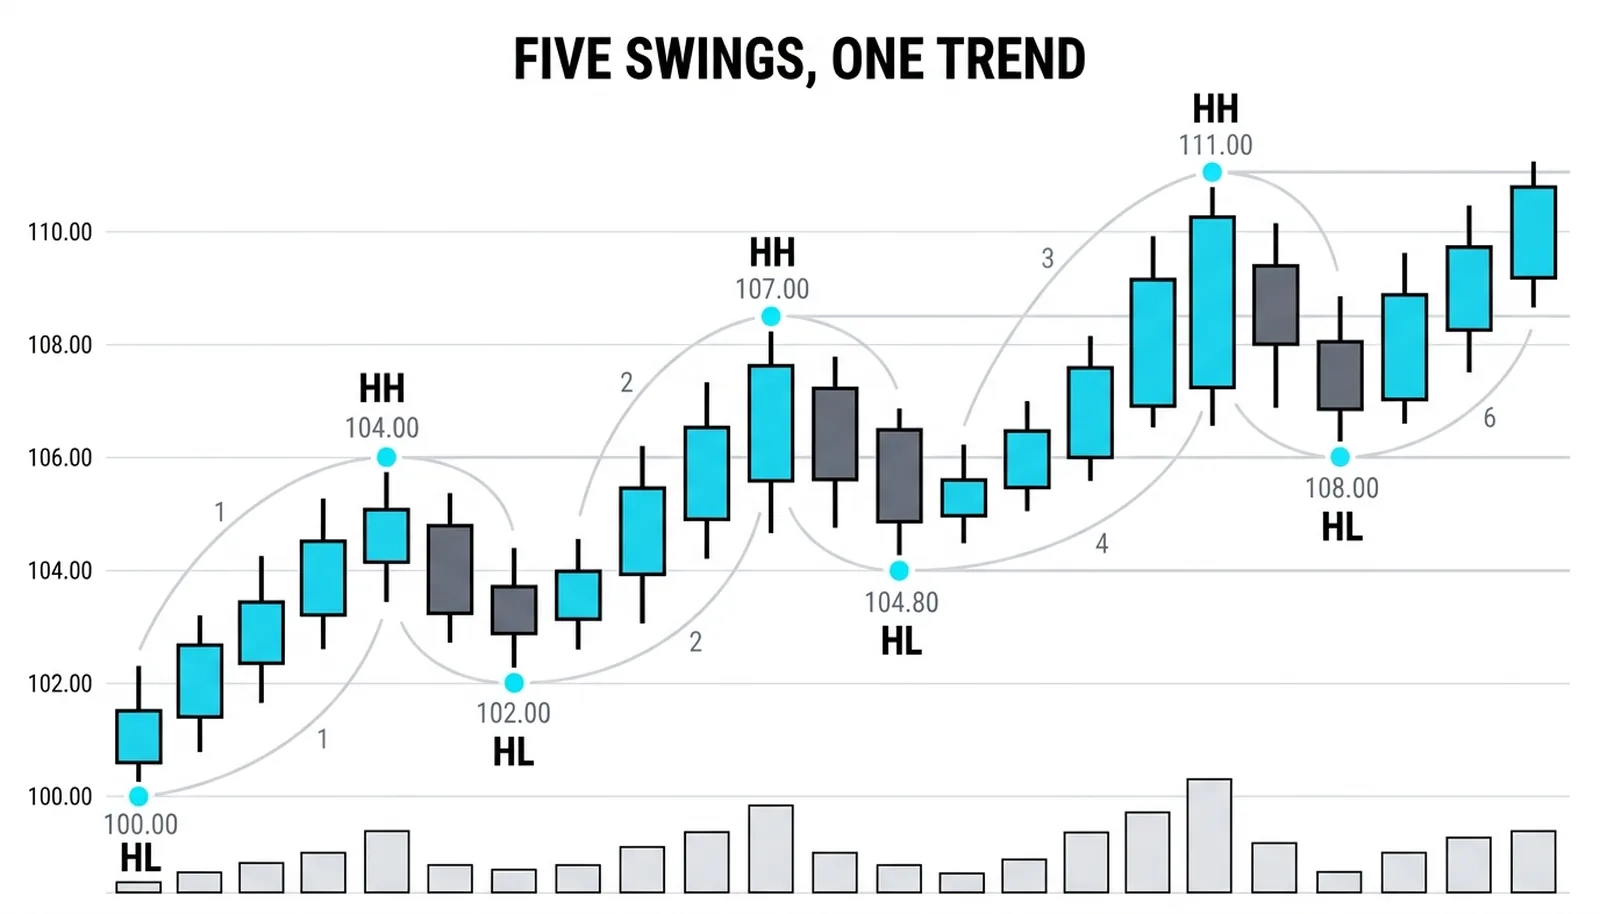
An uptrend begins at a low of 100.00. Price rallies to a swing high at 104.00, then pulls back to 102.00, a higher low that gave back half of the 4.00 leg. Price rallies again to 107.00, a higher high on a second leg of 5.00, then pulls back to 104.80, a higher low that gave back 2.20, just under half of the 5.00 leg. A third rally reaches 111.00, a higher high on a leg of 6.20, and the pullback that follows finds its low at 108.00, giving back 3.00, just under half of the 6.20 leg.
Five swings, labeled in order. Every high sits above the high before it. Every low sits above the low before it.
| Swing | Price | Label | What it proves |
|---|---|---|---|
| Low 1 | 102.00 | Higher low | Sellers could not reach 100.00; the first higher low holds above the origin |
| High 2 | 107.00 | Higher high | Buyers extended control beyond 104.00 |
| Low 2 | 104.80 | Higher low | Profit-taking stopped above the prior low; shallow give-back |
| High 3 | 111.00 | Higher high | Third consecutive extension; imbalance persists |
| Low 3 | 108.00 | Higher low | The sequence's current foundation; the line the trend rests on |
The read takes three sentences. Direction: uptrend intact, so long is the permitted side. Location: the last higher low at 108.00 is the line the sequence currently stands on, so entries belong near that support, not chasing 111.00. Change: a close below 108.00 breaks the chain of higher lows, and that close is the invalidation, the point where the long idea is wrong by the framework's own definition.
Notice what the read never did. It never predicted 115.00. It never estimated odds. It described the record, drew the line the record implies, and stated in advance what would falsify the idea.
The honesty deserves its own paragraph. Structure is descriptive evidence, a record of what already happened, and it never guarantees the next swing. Two careful traders can mark the same chart slightly differently at the margins, which is exactly why the marking rules must be precise and why the record, not the forecast, is the object of the discipline. A label that changes is information, not an embarrassment. When 108.00 breaks in this example, the correct response is to update the record and the belief together.
Market Structure Questions, Answered
What is market structure in trading?
Market structure is the ordered sequence of swing highs and swing lows a market has printed, plus the labels that sequence earns. It is the market's own record of where buyers and sellers each lost control, read in the order events happened.
How do you identify market structure on a chart?
Mark each completed swing high and swing low in order, then read the labels. Higher highs with higher lows is an uptrend, lower highs with lower lows is a downtrend, and swings repeating at similar levels is balance. The most recent swing points give you location, and the swing whose loss would break the pattern gives you invalidation.
Is market structure the same as a trend?
No. A trend is one of the three states structure can be in. Structure is the full record and the labeling method; uptrend, downtrend, and balance are the readings that method produces. Structure also tells you when a trend has ended, which the trend itself cannot do.
Does market structure work on every timeframe?
Yes, because swings and their labels are defined the same way on any timeframe. A five-minute chart and a weekly chart each produce their own sequence, and the higher timeframe's state should govern the direction you permit yourself on the lower one.
The framework now gives you the record, the three states, and the three questions. The next lesson puts the record to work on its most important event: the break of structure, the moment the trend proves, in writing, that control still belongs to the same side.