Static vs Dynamic Support and Resistance
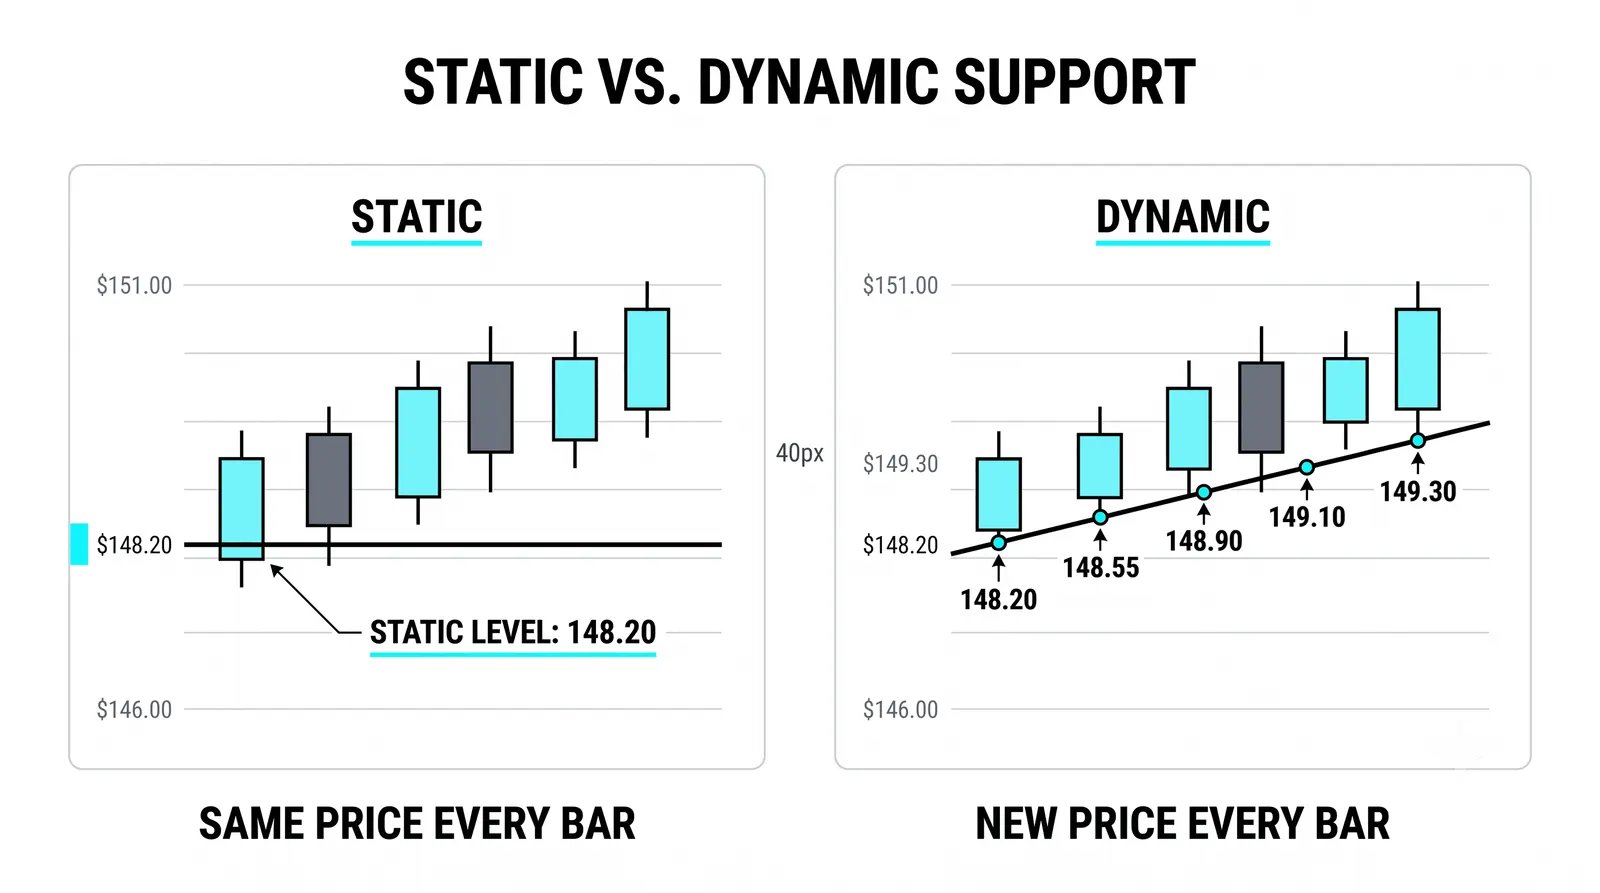
Support and resistance levels come in two forms, and telling them apart changes how you trade them. Every zone on your chart is either static, a fixed price band left behind by past swings, or dynamic, a moving line that travels with the trend. Static levels come from memory. Dynamic levels come from math. When the two disagree, the static one wins.

A static level is a dock fixed to the shore, while a dynamic level is a raft that drifts with the current, handy while it floats alongside and useless as an address.
Two Different Kinds of Level
A fixed level sits at the same price today, next week, and next month. It was built by real transactions at a real price, and it stays put until the market trades through it decisively.
A moving level re-prices itself constantly. A trendline climbs or falls with every new bar. A moving average recalculates with every close. The level you see at noon is not the level that existed at the open.
Beginners run into trouble when they apply fixed-line rules to moving lines. They mark a moving average touch as "the level at 84.60" and expect that exact price to matter tomorrow. It will not. Tomorrow the line has moved. Treating a drifting line like a fixed address produces trades built on a price that no longer exists.
Keep the categories separate in your head. Fixed levels answer the question "where did the market react before?" Moving lines answer "where is the trend's current edge?"
Static Levels: Memory on the Chart
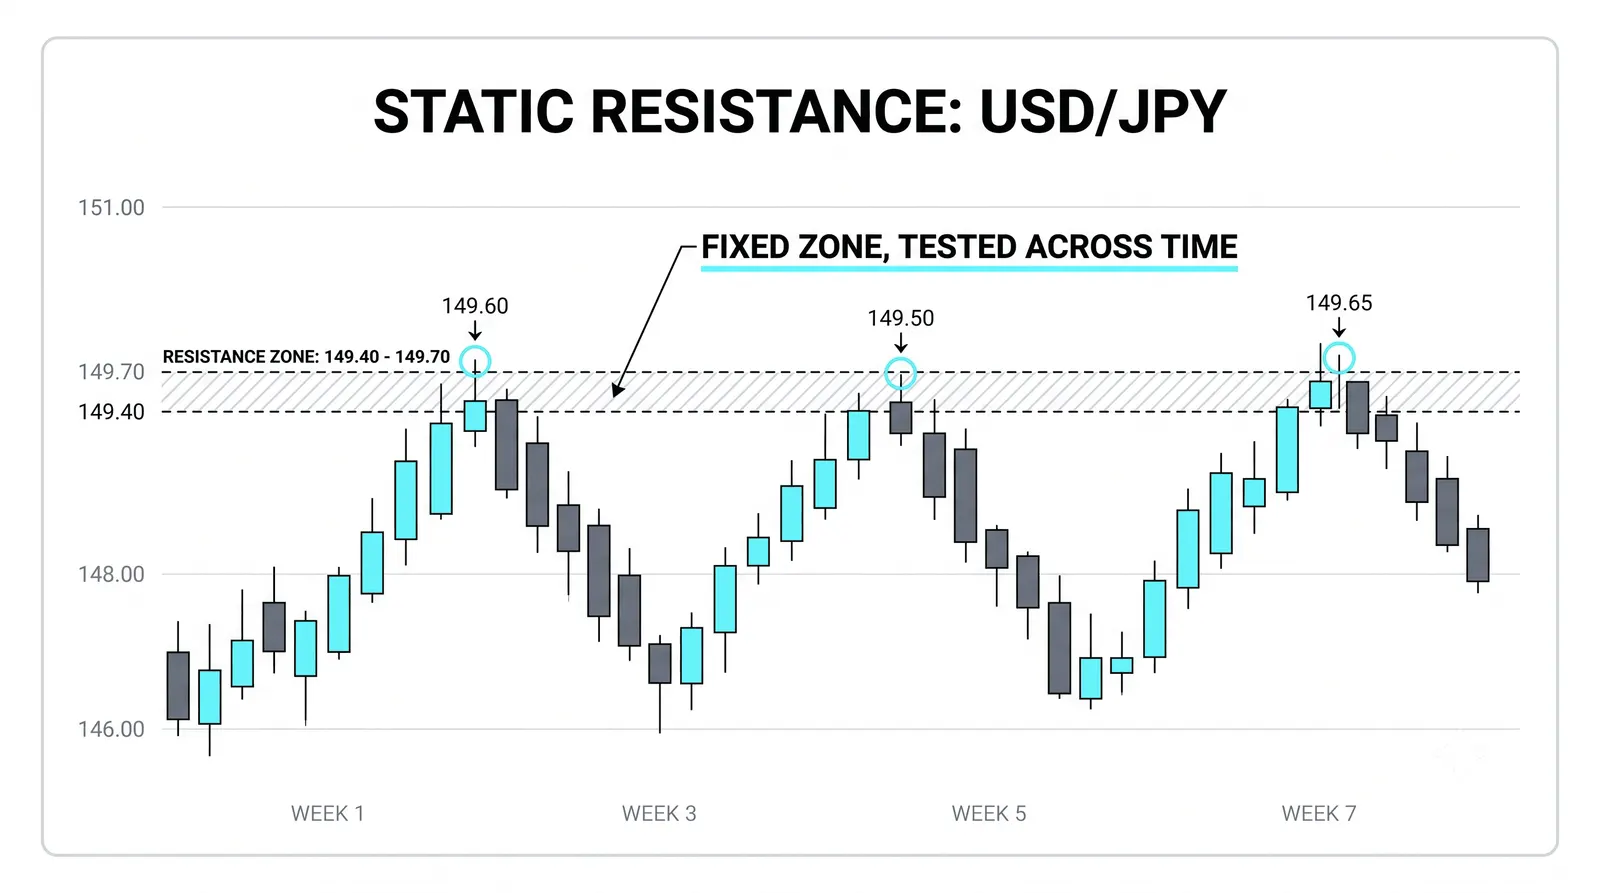
Static zones are built from anchor swings, the highs and lows where price previously stalled, reversed, or broke out. Each anchor is a record of actual buying and selling at that band.
The zone's price and width never change. If three prior touches define a band from 84.00 to 85.00, that band stays 84.00 to 85.00 until price breaks cleanly through it. You never redraw it to fit new candles.
What changes is trust, not location. Each fresh test that holds adds evidence that the band still matters. Each test that slices through weakens it. The zone is a fixed object with a shifting reputation.
That reputation comes from memory. Traders who bought at 84.00 and profited remember it. Traders who sold at 85.00 and watched price fall remember it. Orders cluster where people have unfinished business, and those orders are what make the band hold.
Dynamic Levels: Lines That Travel
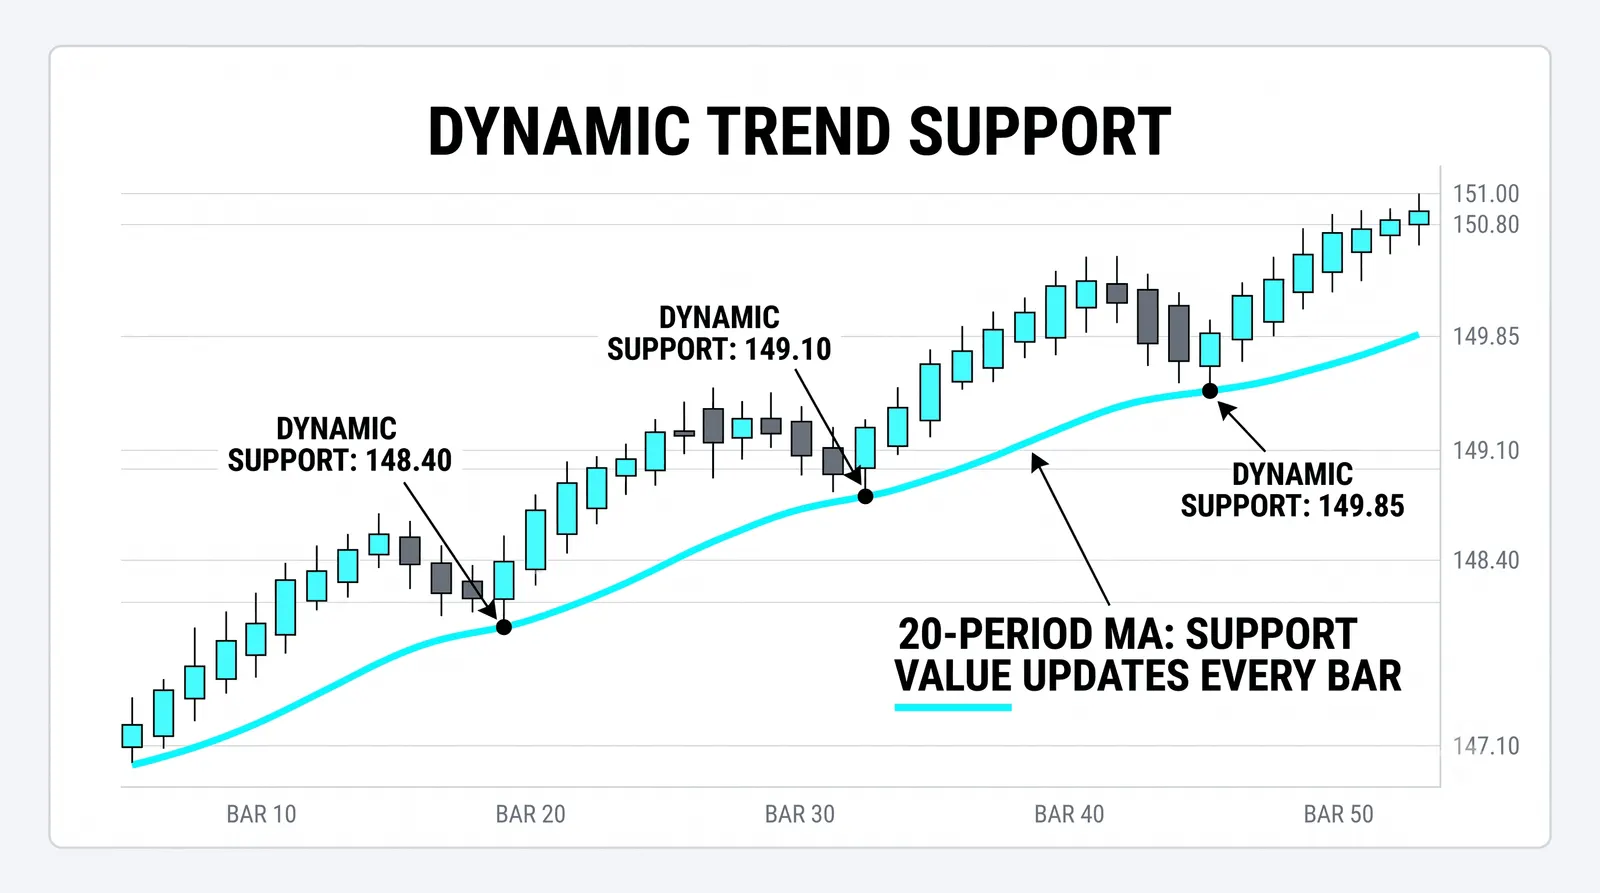
Dynamic levels move because they are calculated, not remembered. A trendline connecting rising lows re-prices every bar as time passes along its slope. A moving average, the most common dynamic line, recalculates with every closing price. Both are floating floors in uptrends and floating ceilings in downtrends.
Drawing trendlines is its own lesson with its own mechanics, so treat it here only as one example of a moving line. Moving averages get a full lesson later in the program, so no periods or settings here either. What matters now is the category.
The slope of a dynamic line carries information a horizontal line cannot. A steeply rising average tells you the trend is aggressive and pullbacks are shallow. A flattening average tells you momentum is cooling before any static level gets tested. The angle is a message.
Dynamic levels also fail differently. A static zone breaks with a decisive push through a known price. A dynamic line breaks quietly, because the line itself keeps moving and price can simply drift sideways until the line catches up and passes through. There is no single dramatic price to watch.
When Static and Dynamic Line Up
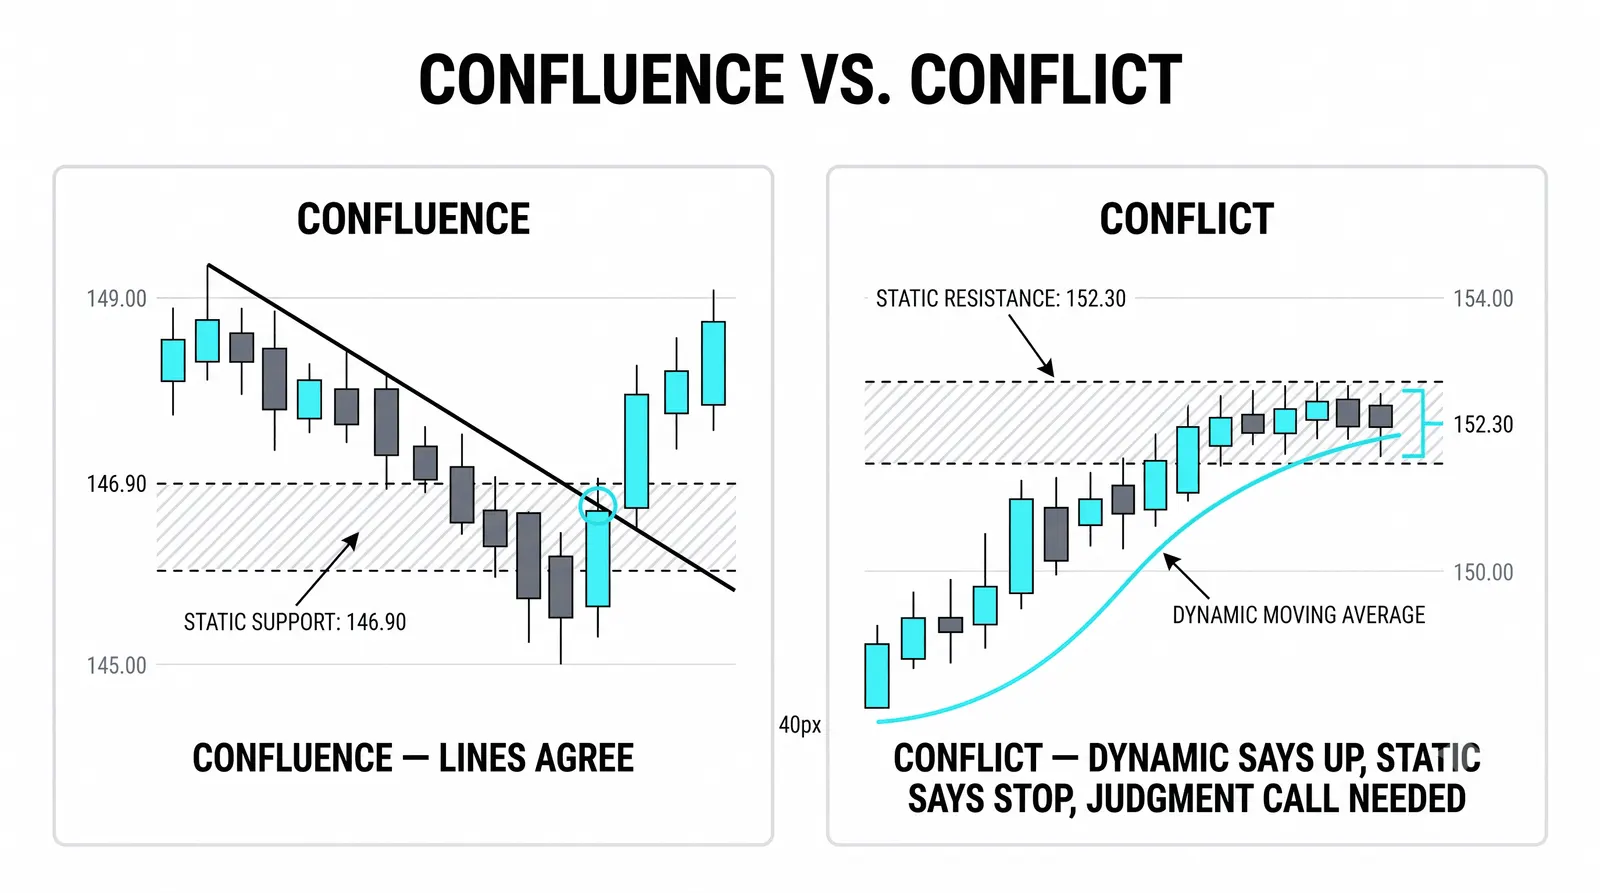
Agreement between the two is the strongest setup this pairing offers. Picture a falling moving average descending into an old static ceiling. Now two independent reasons sit at one price: the math says the downtrend's edge is here, and memory says sellers live here. Stacked reasons attract stacked orders.
Confluence as a general idea was covered earlier in the program. This is that idea applied to one specific pairing, nothing broader.
Disagreement is where traders get hurt. The moving average says the trend is up and price should hold. The static zone overhead says sellers are waiting. These are not equal claims. The static zone represents committed capital at fixed prices. The moving average represents an average of closes, a calculation with no orders behind it.
Memory holds more capital than math. When the two conflict, weight the static zone and treat the dynamic line as context, not as a reason to trade through a fixed band.
Never weight them equally. A coin-flip mindset between memory and math will have you buying directly under resistance because a line on your screen is rising.
The Pullback That Had Both
Here is a hypothetical with round numbers. A stock is trending up. Its static support zone sits at 84.00 to 85.00, built from three prior touches. Its rising moving average has climbed into that same band and currently passes through at 84.60.
Price pulls back into the zone. At 84.60 the moving average offers its reason: the trend's floating floor. Across the whole 84.00 to 85.00 band, memory offers its reason: three prior defenses. Both reasons occupy the same stretch of price.
The plan writes itself from the structure. Long interest inside the zone. A stop at 83.40, below the bottom of the band and below where the moving average will sit in the coming sessions. A first target at the prior high of 89.50. Risk is defined by the static band's lower edge, and the dynamic line simply adds confidence to the location.
Now flip it. In a downtrend, a falling moving average hovers just above a static resistance band at 90.00 to 90.50. A trader holding a long from lower prices watches the average and hopes it will pull price up through the band. The two disagree, and the disagreement has a verdict: the static band outranks the math. The average is a calculation drifting through space. The band at 90.00 to 90.50 is where sellers actually showed up before. Hoping the average rescues a long sitting under that ceiling is hoping arithmetic beats committed capital.
Same tools, opposite verdicts. Agreement earns conviction. Disagreement earns deference to the fixed level.
The Pairing at a Glance
| What it is | Where it comes from | How much weight it gets | |
|---|---|---|---|
| Static level | A fixed price band that never moves | Past anchor swings and the orders left behind | Full weight; trust grows or fades with each test |
| Dynamic level | A moving line that re-prices every bar | Calculation: trendline slopes, averaged closes | Context weight; useful for trend, weak against memory |
| The two agreeing | Two independent reasons at one price | Memory and math landing on the same band | Highest conviction; stacked reasons attract stacked orders |
| The two disagreeing | Trend's edge versus a fixed band of prior business | Math pointing one way, memory standing in the way | Static wins; treat the dynamic line as background |
Static and Dynamic Levels, Answered
Are moving averages the only dynamic levels?
No. Trendlines are the other common one, and any line that re-prices with time or new data qualifies. Moving averages are simply the most widely used, which is why they get their own lesson later.
Which should I trust when the two disagree?
Trust the static level. It represents real orders at fixed prices, while the dynamic line represents a calculation. Use the moving line for trend context and let the fixed band make the final call.
Do dynamic levels work inside ranges?
Poorly. In a sideways market, moving averages flatten and price whips back and forth through them, so they stop acting as floors or ceilings. Inside ranges, static zones at the range edges do most of the useful work.
Can a dynamic level become static?
Not directly, but a moving line can leave behind a static one. If price stalls repeatedly where a moving average sits, those reactions create anchor swings, and those anchors form a fixed band that outlives the line's visit.
Next in the program, you will learn the actual mechanics of drawing static zones: how wide to make them, which swings qualify as anchors, and when a zone is broken for good. That lesson turns the fixed half of this pairing into something you can mark on a chart in under a minute.