How to Draw Support and Resistance
To draw support and resistance correctly, mark only the zones where price visibly reversed more than once, set the band's edges with wick extremes on the outside and the cluster of closes inside, and keep only levels that had a reason to exist. That is the method in one sentence, and everything below is just the discipline of applying it without lying to yourself.

Most beginners draw too many lines, in the wrong places, for reasons they cannot explain. Then they wonder why price ignores half of them. The fix is not a better indicator. It is a stricter filter.
Start With the Obvious Swings
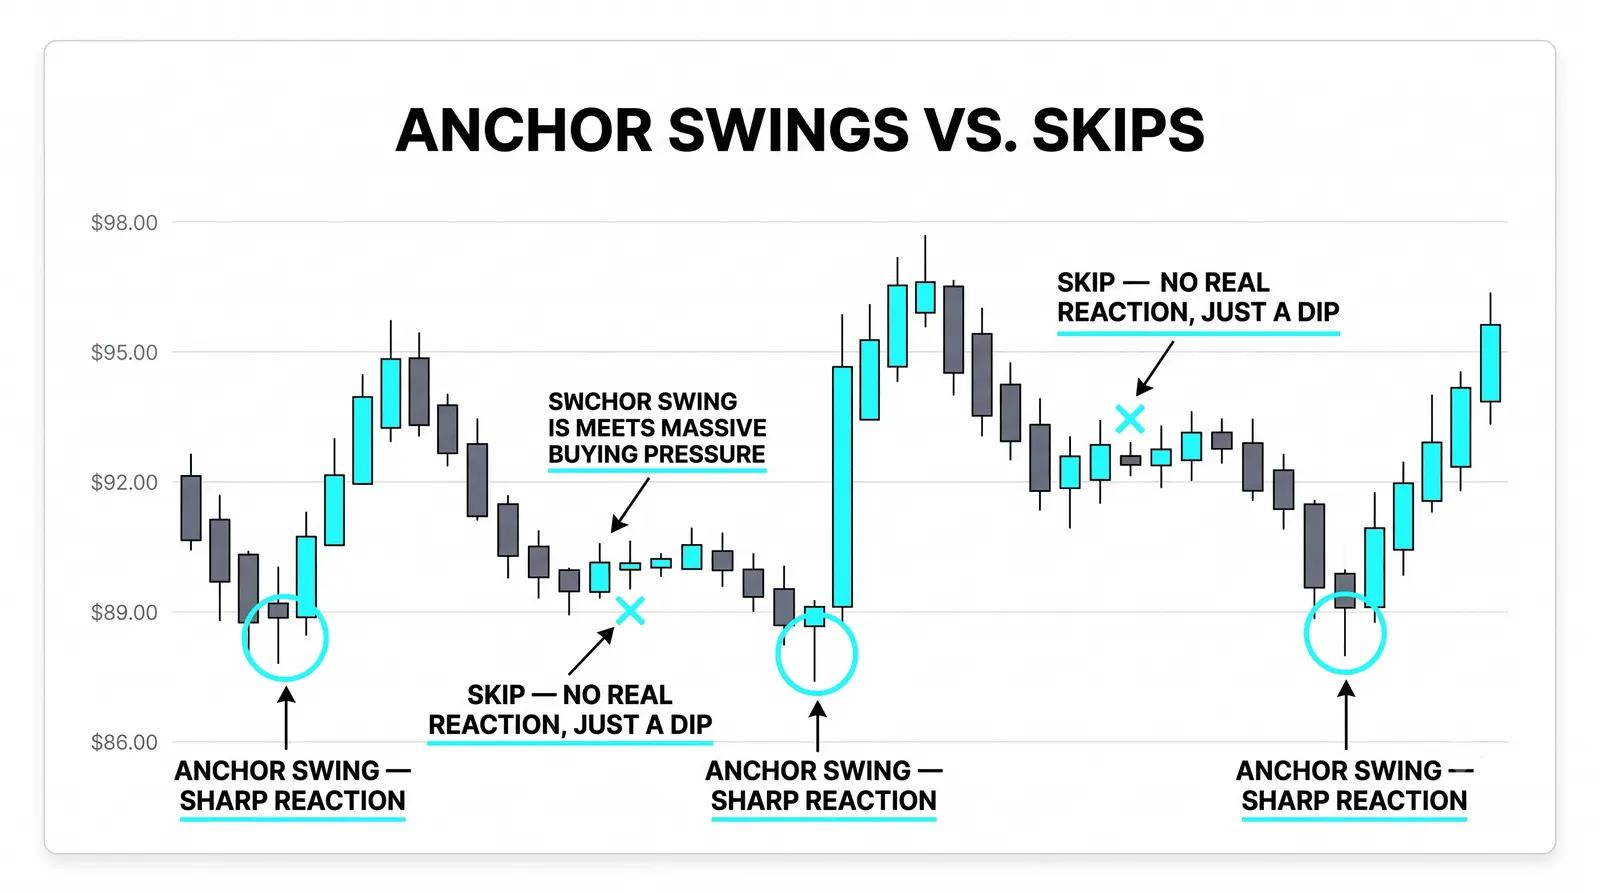
Squint at your chart. If a level disappears when you squint, it was never a level.
The highs and lows visible from across the room come first. These are the swings where price turned hard and everyone watching saw it happen. A peak that reversed price for three weeks matters. A wiggle that lasted forty minutes does not.
Obvious levels work because they are obvious. Other traders see the same turning points, and their orders cluster there. You are not predicting anything mystical. You are marking where the crowd already proved it cares.
Think of it the way an electrician marks a wall before drilling: only where you know something runs underneath. If you have to hunt for a level, there is nothing underneath it.
Zones, Not Lines
Orders cluster around prices, not on exact ticks. Real buying and selling spreads across a range, so your level should be a band, not a hairline.
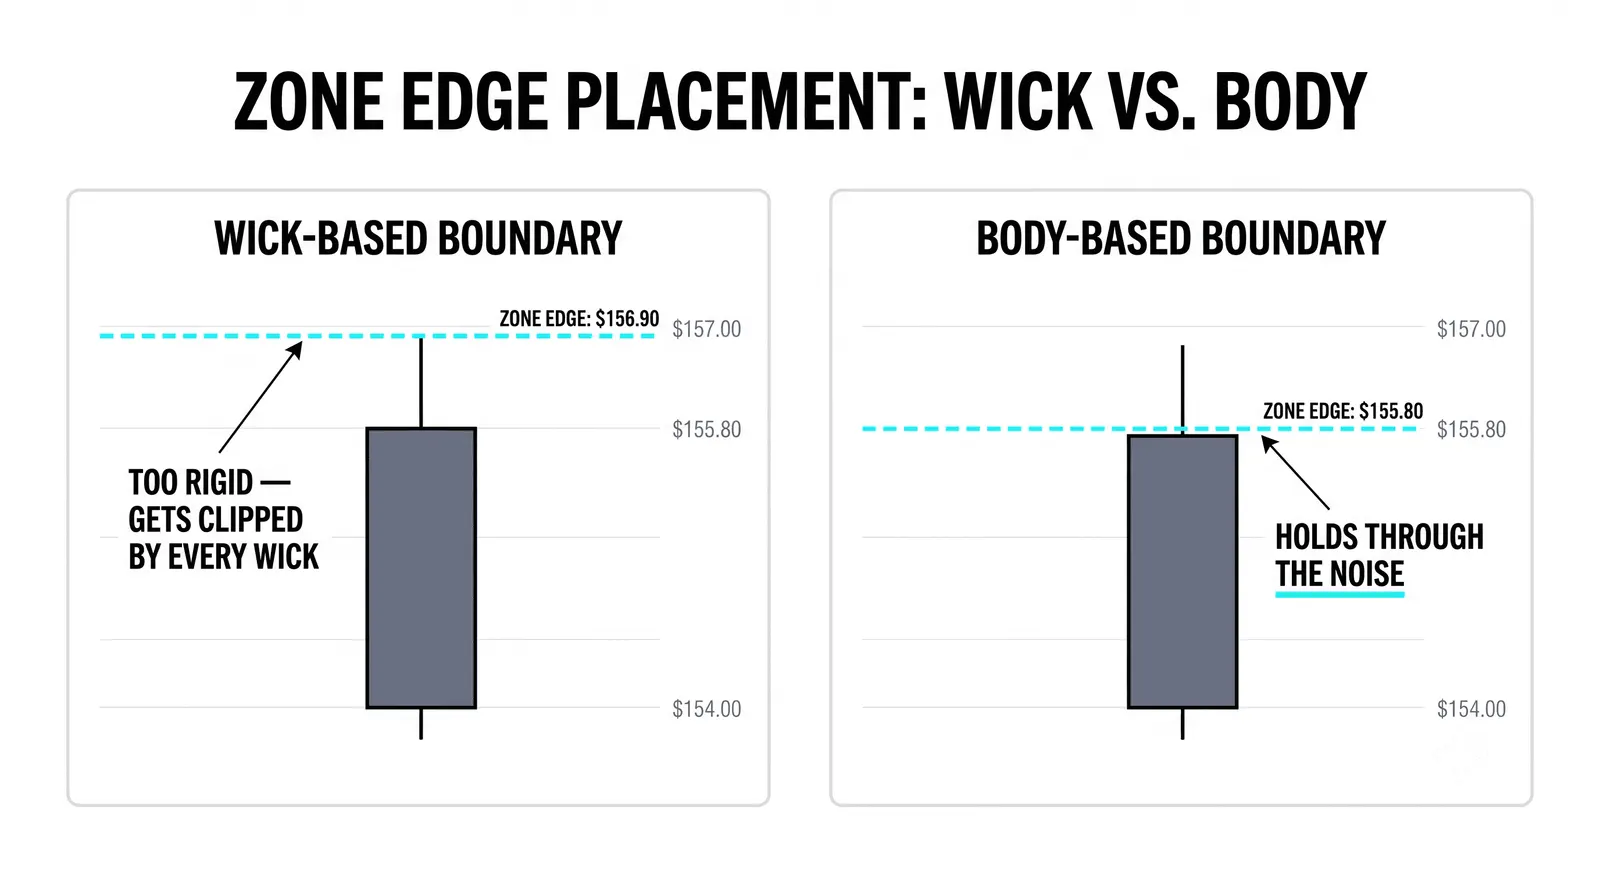
Wicks overshoot. A stop run or a burst of panic pushes price past the real boundary, then the market snaps back. Closes decide. Where the candle bodies settle tells you where the market actually accepted or rejected price.
So build the band like this:
- Put the outer edges on the wick extremes of the reversal.
- Make sure the cluster of closes sits inside the band.
- Treat everything inside the band as the level working, not as the level failing.
That last point saves you real money. Price poking into your zone is not a break. It is the zone doing its job.
How Wide Is Wide Enough
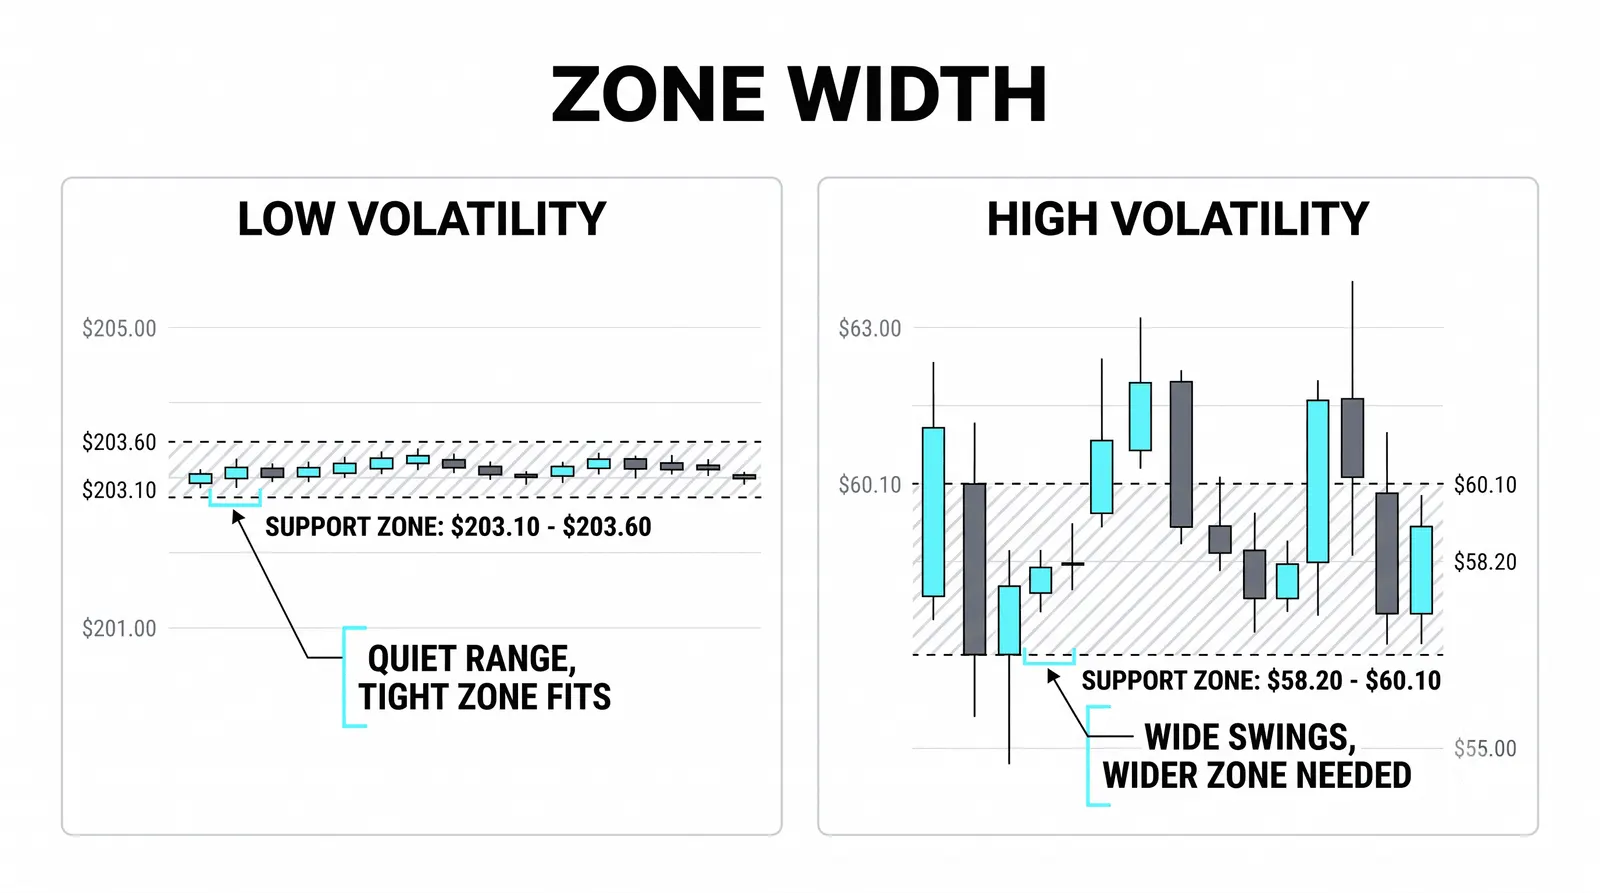
The market's recent behavior sets the width, not your preference.
A volatile chart needs wider bands. If the average daily range is large, price will routinely overshoot a tight line, and a tight line will get "broken" constantly without meaning anything. A quiet, grinding chart earns tighter bands, because price respects finer boundaries when movement is calm.
A quick check: look at the last twenty candles and note the typical wick length. If wicks regularly run half a percent beyond the closes, your band needs to be at least that forgiving. Draw a band thinner than the market's noise and you will spend all day reclassifying noise as signals.
Fewer Levels, More Reasons
Cap yourself at three to five zones per chart. Hard cap.
Every zone you keep must name its source. Acceptable sources include:
- A prior swing high or low where price clearly reversed.
- An old congestion shelf, where price chopped sideways and built positions.
- A round number that the market has visibly respected before.
A level you cannot explain is decoration. If your only answer to "why is this line here" is "price touched it once in March," delete it. Each unexplained line you keep dilutes the ones that matter and gives you excuses to take bad trades.
Fewer zones also forces honesty. When you can only keep five, you stop inventing levels to justify a trade you already want.
Higher Timeframe First
Mark the daily before the hourly. Always.
The big levels decide which small ones matter, which is the heart of multi-timeframe support and resistance. A support zone on the fifteen-minute chart that sits directly under a major daily resistance is weak, because the daily sellers outweigh the intraday buyers. The same intraday zone sitting on top of daily support is strong, because two timeframes agree.
Work top-down. Daily zones first, then the four-hour, then your execution timeframe. When a lower-timeframe level conflicts with a higher-timeframe one, the higher one wins. When they stack, you have confluence, and confluence is the closest thing this business offers to an edge.
Marking One Chart, Start to Finish
Here is a hypothetical walkthrough with round numbers, so you can see the order of operations.
Suppose your chart shows a prior swing high at 23.50, an old congestion shelf between 19.80 and 20.20, and the round number 20 sitting right inside that shelf. Price is currently trading near 21.
Step one: mark the shelf as one zone, from 19.80 to 20.20. Do not draw 19.80 and 20.20 as separate levels. They are one area where price once built positions.
Step two: note that the round number 20 sits inside the shelf. That is confluence, not a new zone. Write it down as a reason this zone matters more, not as a fourth line.
Step three: mark 23.50 as the ceiling. Price reversed hard there before, so the band runs from the wick extreme down through the cluster of closes near the top.
Step four: stop. You have three zones: the ceiling at 23.50, the shelf at 19.80 to 20.20, and whatever swing low sits below current price if one qualifies. Nothing else gets drawn. Now you wait for price to reach a zone instead of chasing it in the empty middle.
The Honest Mistakes
Most bad charts fail in the same four ways.
- Marking every touch. One touch is an event, not a level. You need visible reversals, ideally more than one.
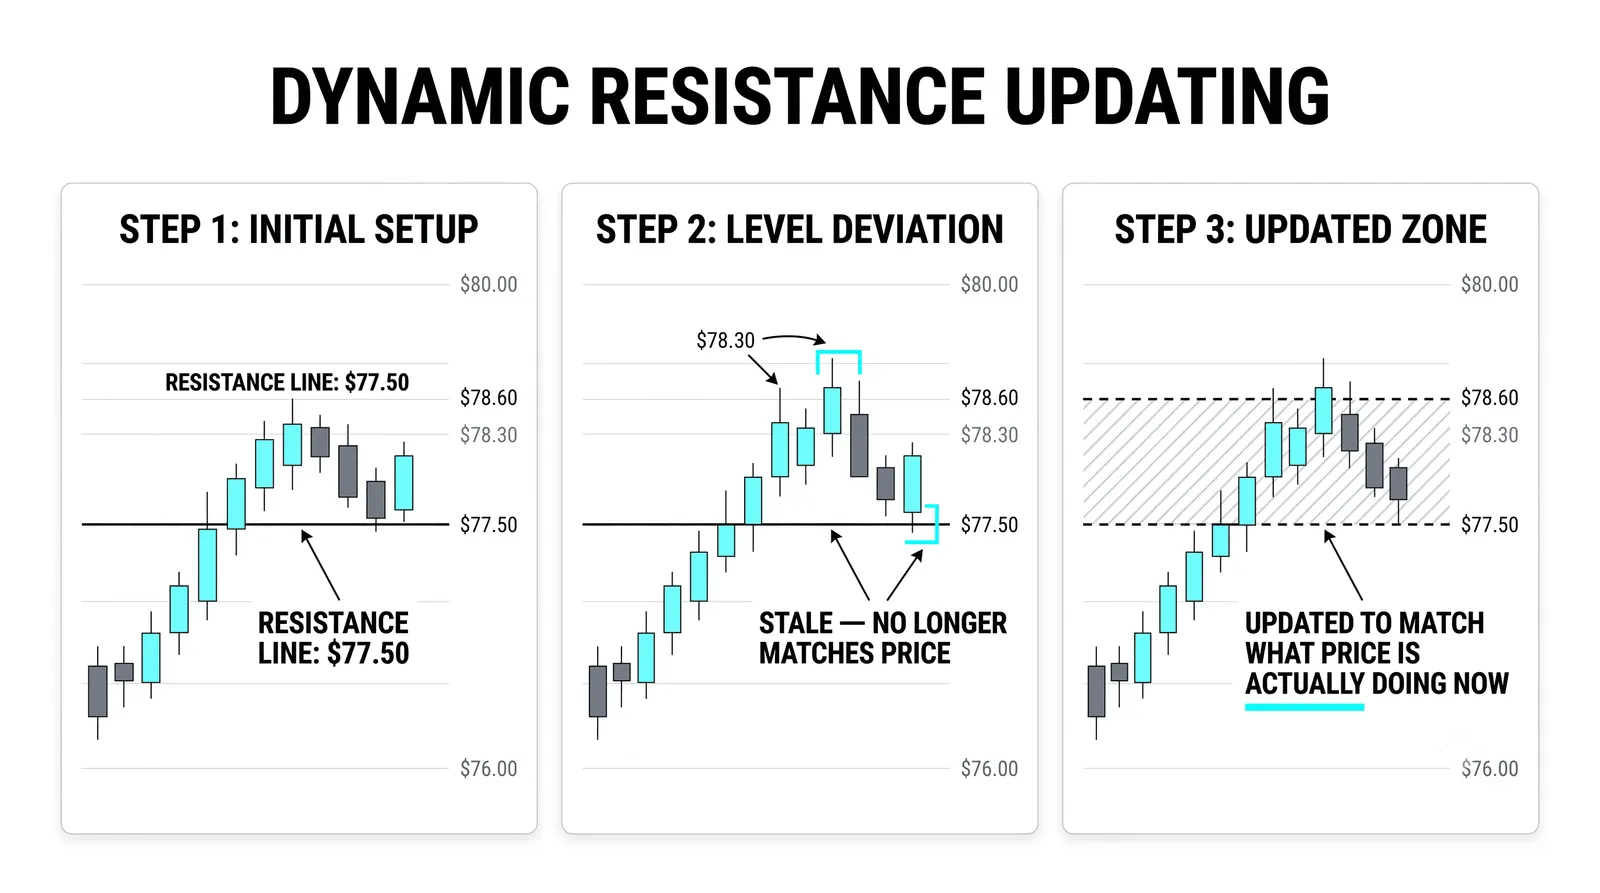
- Moving levels after the fact. Price broke your zone, so you nudge the zone to where price stopped. That is rewriting history to protect your ego.
- Drawing lines to fit a hope. You want to go long, so a "support" appears exactly where your entry needs it. The market does not care about your entry.
- Redrawing without new information. If nothing has changed on the chart, nothing should change on your chart. Constant redrawing is usually boredom dressed up as analysis.
Be blunt with yourself here. Every one of these mistakes feels productive while you are doing it.
Careless Marking vs Disciplined Marking
| Careless Marking | Disciplined Marking | |
|---|---|---|
| How many levels | Ten or more, wherever price paused | Three to five, each with a named source |
| Where edges come from | A single exact price, or wherever fits the trade | Wick extremes outside, cluster of closes inside |
| What happens after a break | Level gets moved to match the new price | Level is retired or flipped only after a clear close beyond it |
| The honesty test | "It looks right" is the whole justification | You can say out loud why each zone exists |
How to Draw Support and Resistance: Your Questions, Answered
Should I use wicks or closes?
Use both, for different jobs. Wicks set the outer edges of your band because they show the full reach of the rejection. Closes tell you where the market actually settled, so the body of your zone should contain the cluster of closes. A level built only from closes gets overshot constantly; one built only from wicks is too wide to trade against.
How far back should I look?
Look back far enough to find the levels that are still obvious, usually a few months on the daily and a few weeks on intraday charts. Older levels fade in relevance as the traders who built them leave the market. If a level from two years ago still lines up with recent reactions, keep it; otherwise let it go.
Do I redraw after a break?
Only after a clear close beyond the zone, not after a wick through it. A decisive break retires the level or flips its role, since old resistance often becomes new support and vice versa. A poke through the band with a close back inside is the zone working, and redrawing then is just moving the goalposts.
Should I mark intraday levels first?
No. Mark the daily first, then work down to your trading timeframe. Intraday levels only matter in context, and the higher timeframe supplies that context. A fifteen-minute level that fights the daily structure is a level you should expect to lose.
Once your charts hold three to five zones you can defend out loud, the next skill is reading what price does when it arrives at one. That is where structure reading turns a marked chart into an actual trade plan.