The SuperTrend Indicator, Explained
SuperTrend is an ATR-based trailing line that sits below price in an uptrend and above price in a downtrend, flips sides when price closes through it, and turns trend-following into a single unambiguous line. There is no interpretation debate with this tool. Price is either above it or below it, and the line tells you which side the trend currently lives on.

Think of it like a kite on a string: the string follows the kite wherever it climbs, and only the wind's real change of mind makes the flyer switch hands. The line never leads. It trails, it holds, and it switches sides only when price proves the move is over by closing through it.
The Line and the Flip
In an uptrend, SuperTrend draws below price. As long as bars keep closing above that line, nothing changes. The line climbs with the move and acts as a rising floor.
The flip happens on a close through the line, not a touch. A wick poking below intraday means nothing. Only a closing price on the wrong side triggers the switch.
When that close happens, the line jumps to the other side of price and becomes the opposite edge. What was a floor under the uptrend is now a ceiling over the new downtrend. One line, two roles, a clean handoff.
This is why traders who struggle with indecision like it. The tool makes the call for you. Your job shifts from judging the trend to deciding how you will act on a flip.
If you have studied Parabolic SAR, you already know the other famous trailing tool. The honest sibling difference: SAR steps tighter and flips faster, while SuperTrend breathes with volatility instead. And if you worked through the dynamic support and resistance lesson, SuperTrend is exactly that idea with a flip rule attached.
The Math Under the Line
The construction is simple. Take the bar's midpoint, which is the high plus the low divided by two. Then add or subtract a multiplier times ATR.
ATR is the Average True Range, an average of how far price travels per bar. That is all you need here. A quiet stock has a small ATR, a wild one has a large ATR, and the band width adjusts automatically.
The classic settings are 10 periods and a multiplier of 3. So the lower band in an uptrend is midpoint minus three times the 10-period ATR. The upper band in a downtrend is midpoint plus the same distance.
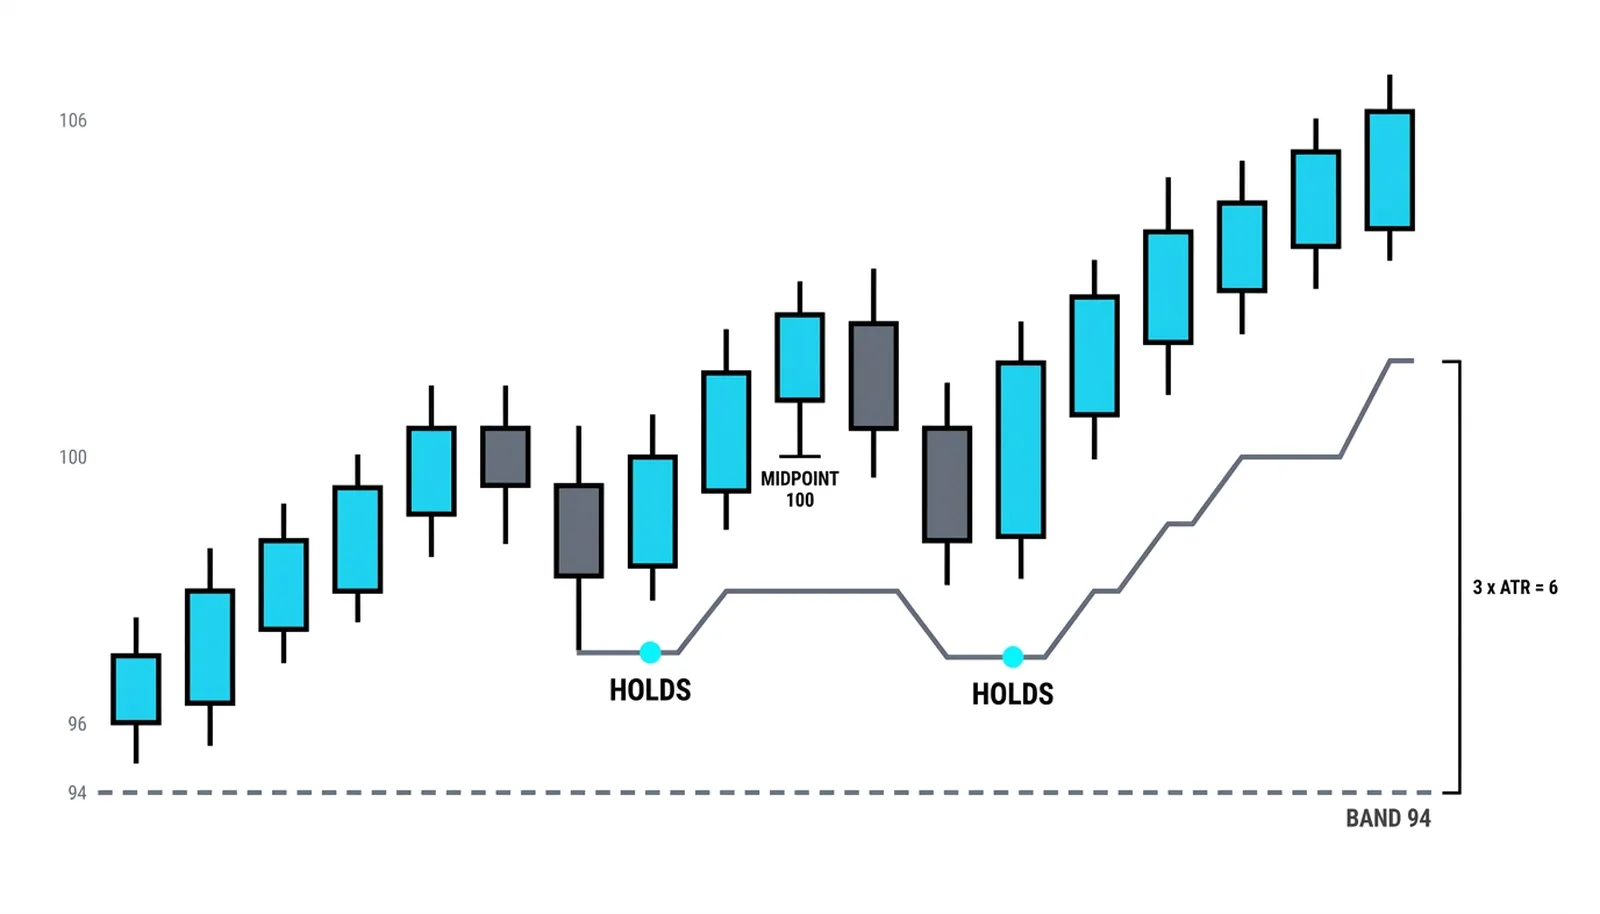
The key mechanic is that the line only trails in the trend's direction, never against it. In an uptrend, the lower band can rise or hold flat, but it never drops. Each new bar either pulls it higher or leaves it where it was.
That one-way ratchet explains the two behaviors you see on charts. In a trend, the line hugs price and climbs steadily. In a range, it flattens out and waits, because price keeps crossing back over a line that refuses to chase it.
Why It Lags, and Why That Is Fine
SuperTrend confirms. It does not predict. The flip only happens after price has already moved against you far enough to close through a volatility-adjusted buffer.
Every ATR-based trailing tool gives back the last stretch of a move. With a multiplier of 3, you are accepting roughly three average ranges of giveback before the tool admits the trend is over. That is the price of the clean reading.
Traders who demand an early exit end up tightening the multiplier, which just moves the cost elsewhere. Tighter settings flip more often and bleed on noise. Looser settings flip rarely and surrender more on each reversal.
There is no setting that escapes the trade-off. The tool's value is that it makes the trade-off visible and mechanical, so you stop renegotiating your exit on every red candle.
Where It Breaks: Ranges
Sideways markets are where SuperTrend earns its bad reputation. Price drifts up, closes through the line, flips it. Price drifts down, closes back through, flips it again. Each flip is a small loss, and they stack up fast.
The tool is honest about trend and blind about condition. It cannot tell the difference between the start of a move and another lap inside a range.
The standard fix is a strength filter. Only take flips when a separate measure says a real trend exists. The ADX lesson already live in this level pairs with it naturally: ADX tells you whether the market has directional strength, SuperTrend tells you which side and where the line sits.
Without that filter, the practical rule is to stand down when you can see the range with your own eyes. A trailing tool in a box is a fee generator for your broker.
One Ride, One Flip, One Whipsaw
All numbers here are invented and round, purely to show the mechanics.
Say a stock trades near 100. The current bar's midpoint is 100, ATR reads 2, and your multiplier is 3. The lower band sits at 100 minus 6, which is 94. As long as closes hold above 94, the uptrend reading stands.
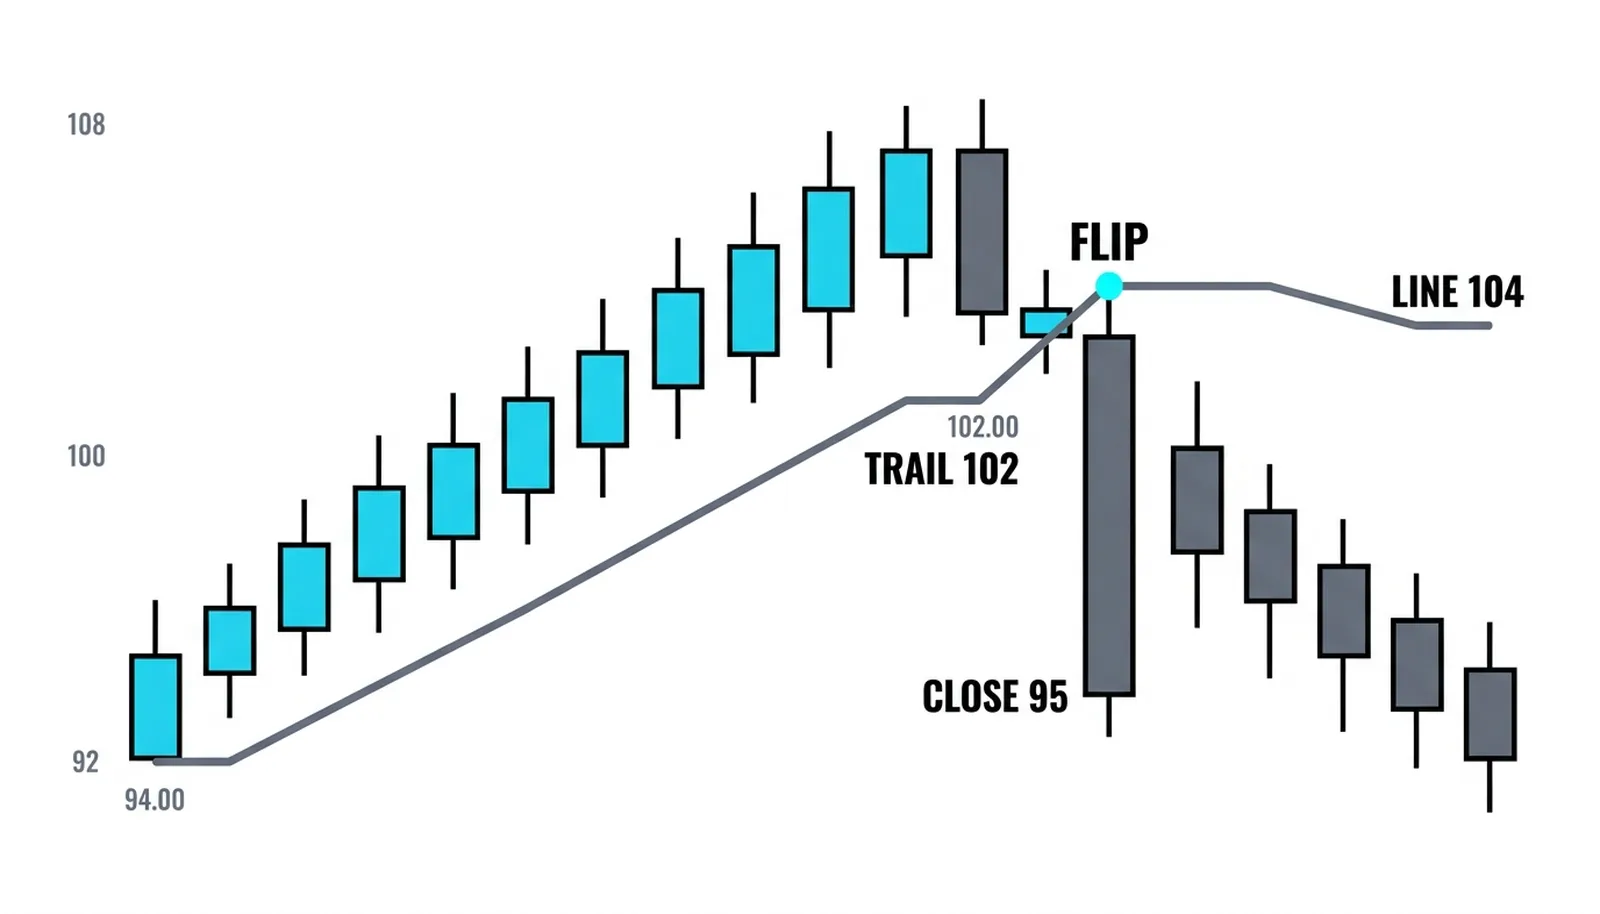
Price climbs over several sessions. The midpoint reaches 108, and the band trails up to 102. Notice it never falls along the way. On any bar where the midpoint dips, the line simply holds its last value.
Then a bar closes at 95, below the 102 line. The flip triggers. The line jumps above price and lands at 104, because that bar's midpoint is 98 and 98 plus 6 is 104. The old floor is now the ceiling, and the reading is downtrend until a close back above 104.
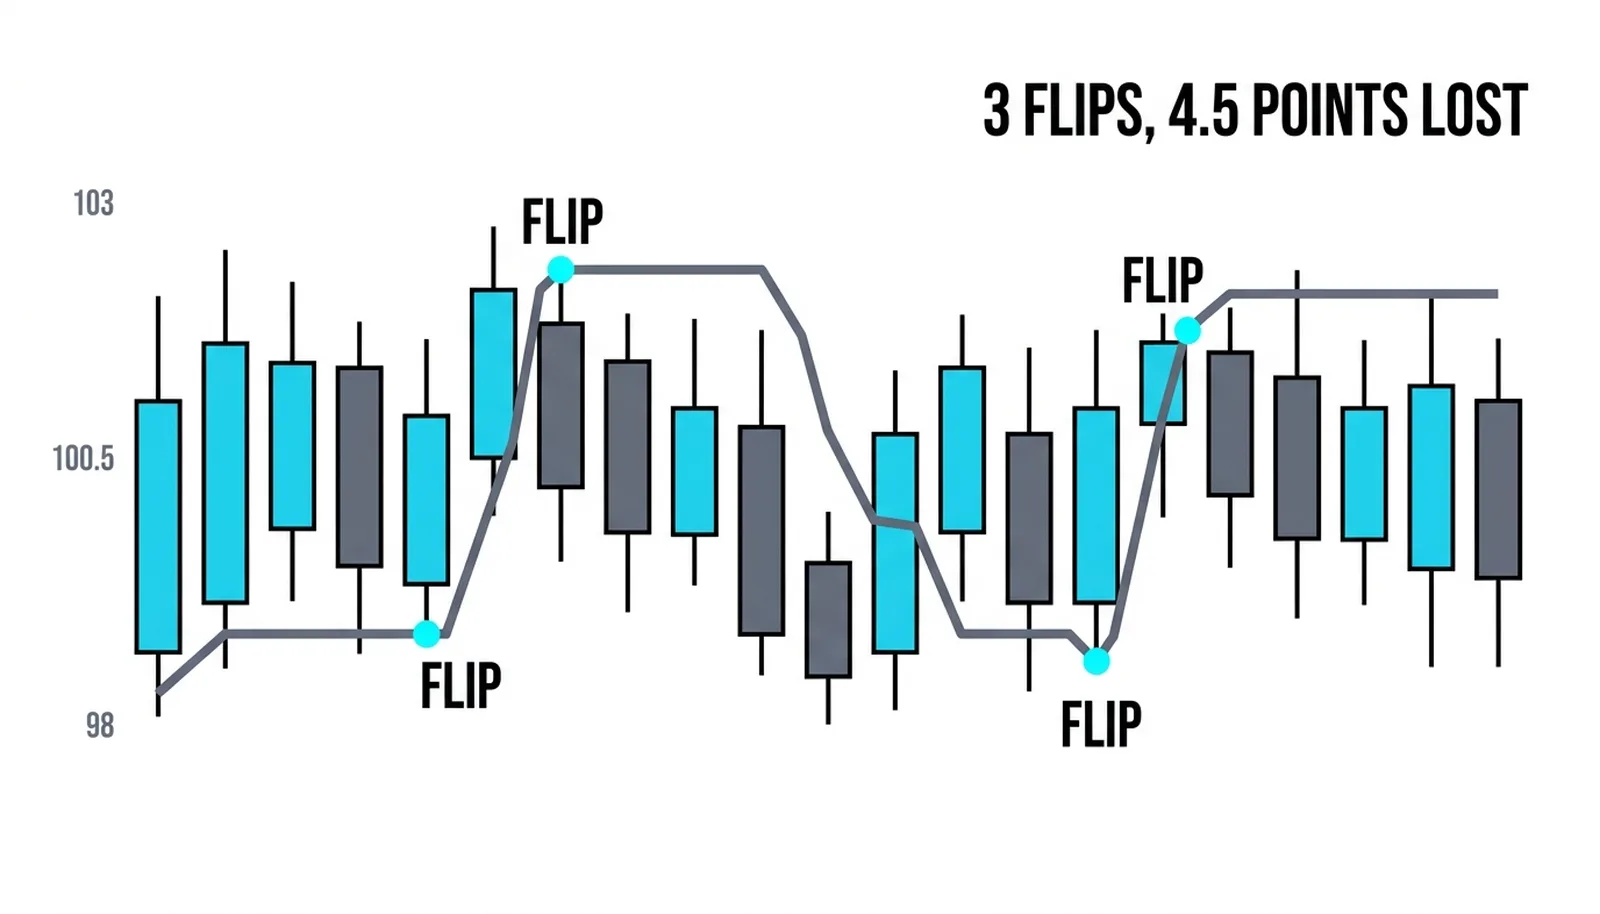
Now the range case. The stock chops between 98 and 103 with no direction. Over eight sessions, the line flips three times. Each flip costs roughly a point and a half between the signal close and your exit. Three flips means about four and a half points of bleed with nothing to show for it. That is the range problem in one paragraph, and it is why the strength filter matters.
| Settings | Flip Frequency | Whipsaw Cost | Clock It Suits |
|---|---|---|---|
| 10 periods, multiplier 2 | High, reacts quickly | Many small losses in chop | Short-term charts and active sessions |
| 10 periods, multiplier 3 | Moderate, the classic default | Balanced giveback per flip | Daily charts and swing holds |
| 14 periods, multiplier 4 | Low, slow to turn | Few flips, larger giveback each | Weekly charts and position trades |
Questions About SuperTrend
What do SuperTrend settings 10 and 3 mean?
The 10 is the ATR lookback period, and the 3 is the multiplier applied to that ATR. Together they set how far the line sits from the bar's midpoint: midpoint plus or minus three times the 10-period average range. Raising either number pushes the line farther out and slows the flips.
Is SuperTrend good for day trading?
It can work on intraday charts, but the settings need to tighten and a strength filter becomes more important, because intraday ranges are common. A shorter ATR period and a multiplier near 2 will flip faster, which suits short holds but raises whipsaw costs. Test it on your specific market and session before trusting it.
Why does SuperTrend keep flipping in a range?
Because the line flattens while price keeps crossing it. In a sideways market the midpoint oscillates around a line that only moves in one direction at a time, so ordinary noise is enough to force repeated closes through it. The tool has no way to know the market is going nowhere.
Can SuperTrend be used as a stop loss?
Yes, and that is one of its most practical uses. The line is a volatility-adjusted trailing level, so placing a stop just beyond it gives the trade room to breathe while defining your exit mechanically. The catch is the same as always: in a range, that stop will be hit by noise rather than by a real reversal.
SuperTrend handles the trailing-exit question with one line and one rule. The next layer of the toolkit is the Ichimoku system, which takes the same goal, reading trend at a glance, and builds an entire multi-line framework around it.