Dynamic Support and Resistance
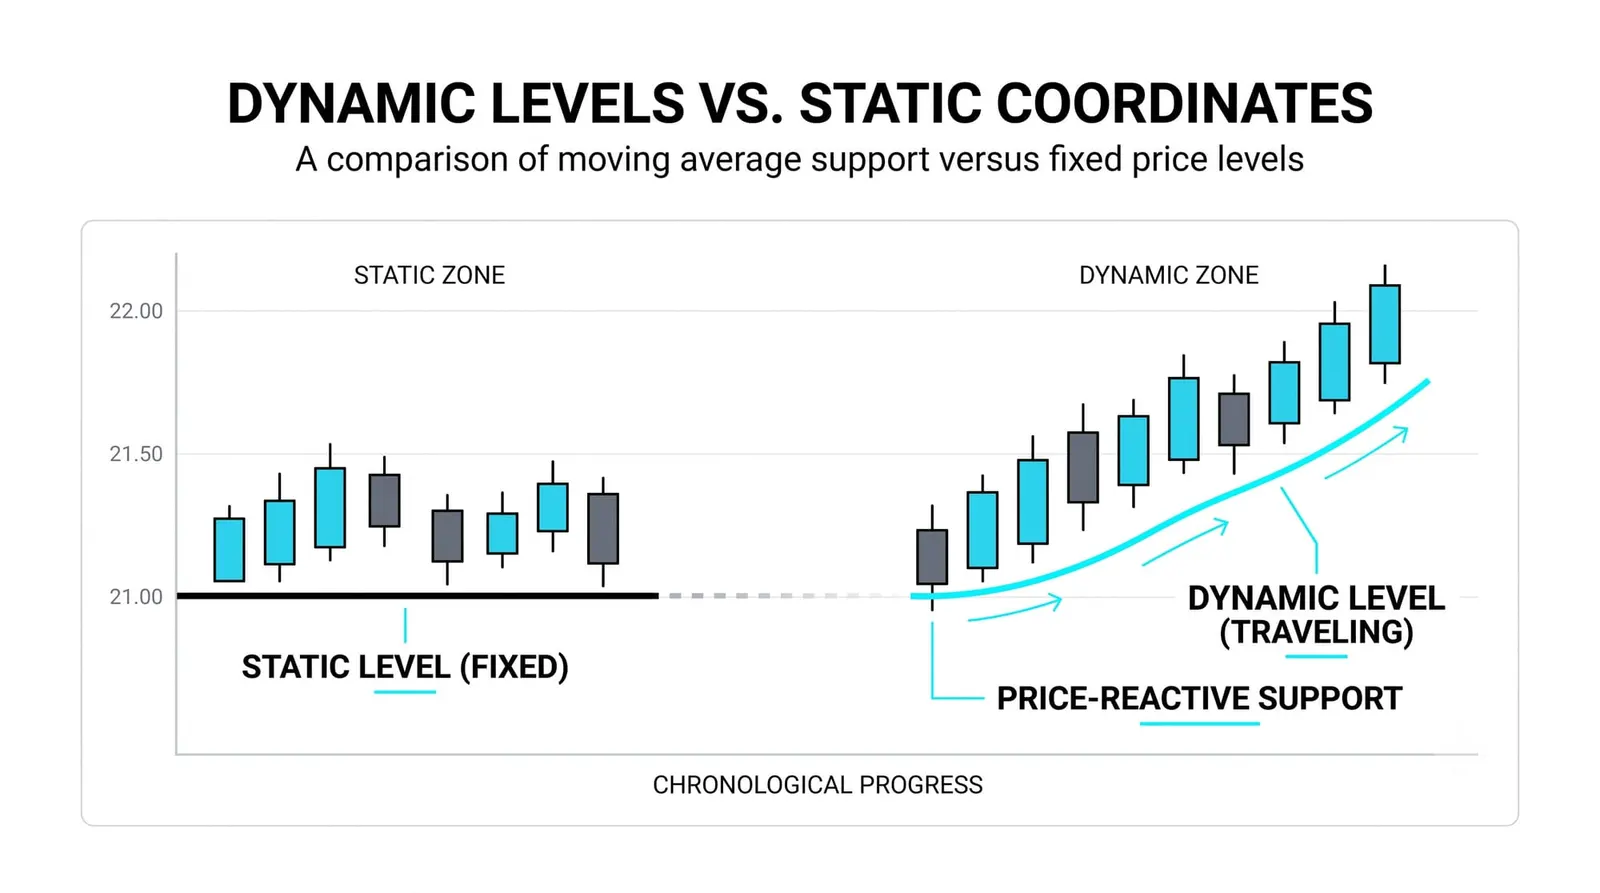
Dynamic support and resistance is the idea that a moving average can act as a floor or ceiling that travels with price instead of sitting at one printed number. In a trending market, price returns to its moving average again and again, and each return is a decision point. That concept follows directly from how the average is built.

Static support and resistance, which you covered in the technical level, is a fence fixed in one field. A moving average is a herding dog that keeps pace with the herd, always at its edge wherever the herd wanders. The behavior at the level is the same. The location moves.
What Dynamic Support and Resistance Means
A moving average is computed from price, so it can never sit still. Every new bar enters the calculation and the oldest bar drops out. In a trend, where each new bar tends to print higher than the one leaving the window, the average climbs steadily behind price.
That climbing line becomes the trend's moving floor. Price runs ahead of it, pulls back to it, and often resumes from it. The pullback to a rising average is one of the most repeated patterns in trending markets, and traders treat the touch as a test of the trend's health rather than a random event.
The same logic inverts in a downtrend. A falling average trails above price, and rallies back up into it tend to stall there. The line that was a floor in the uptrend becomes a ceiling when the trend turns down. Nothing about the tool changed. Only which side of it price is trading on.
How Price Reacts Around a Moving Average Line
Three reactions cover most of what you will see. Learn to name them as they happen.
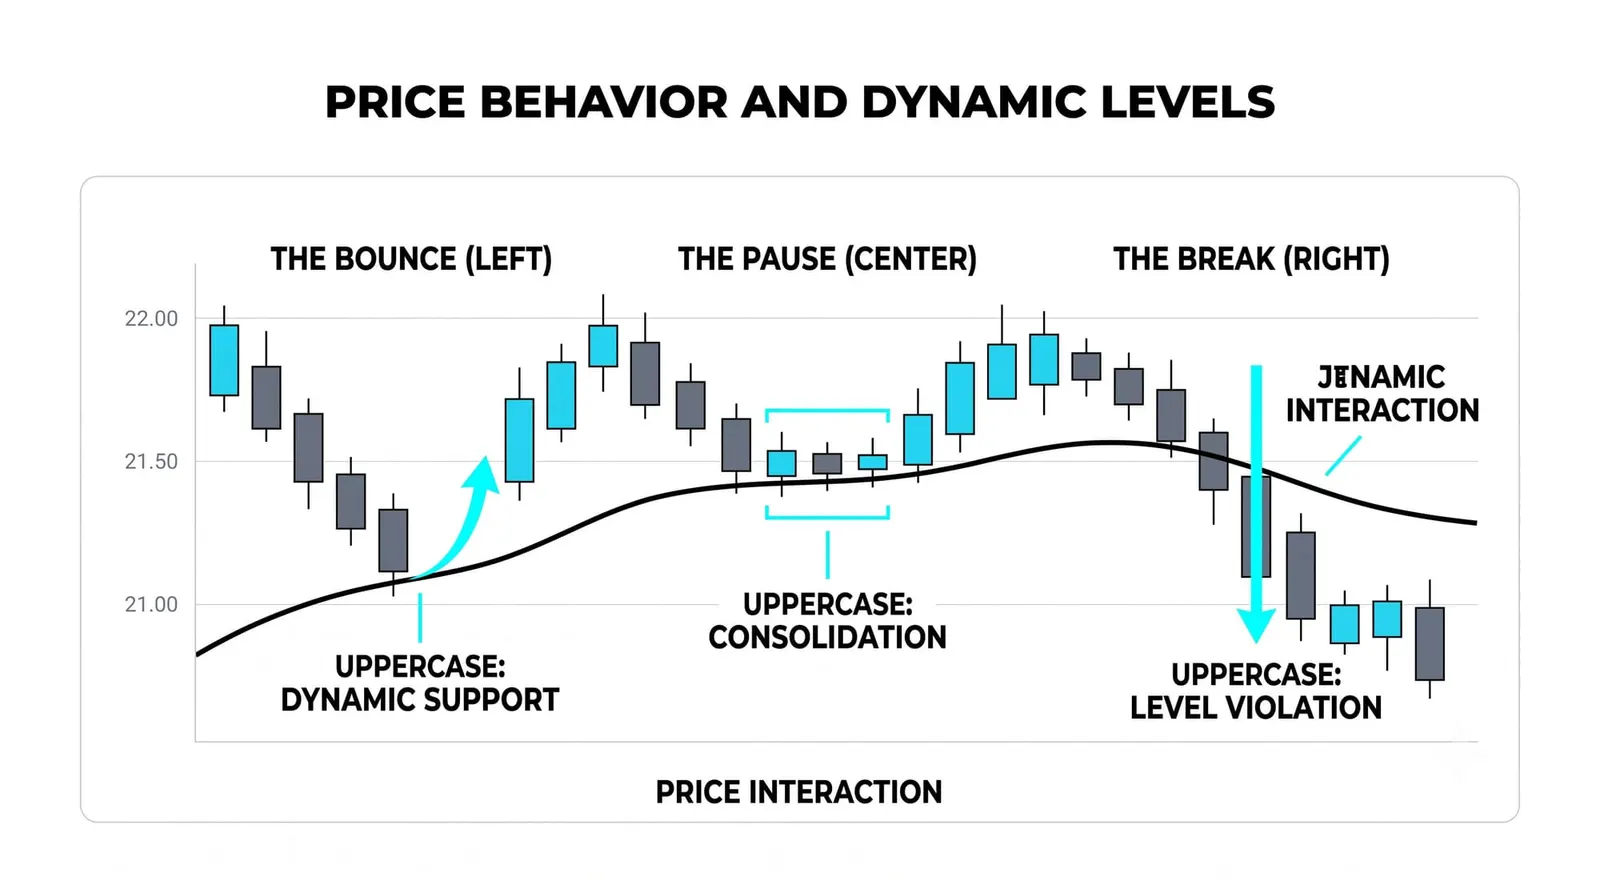
The first is the clean touch and rejection. Price dips to the average, buyers step in, and a candle closes back above the line with a lower wick showing the rejection. The trend resumes. This is the healthy pullback, and it is the reaction the whole concept is built on.
The second is the break that fails. Price closes through the average, looks broken, then snaps back within a bar or two. This happens constantly, because the line is a zone with noise around it, and a single close through it proves nothing on its own.
The third is the break that holds. Price closes through the average, stays there, and the next pullback finds the line working from the other side. The old support now acts as resistance. That flip is the market telling you the trend's structure has changed, and it deserves more respect than the failed break.
Why This Is Not the Same as Static Levels
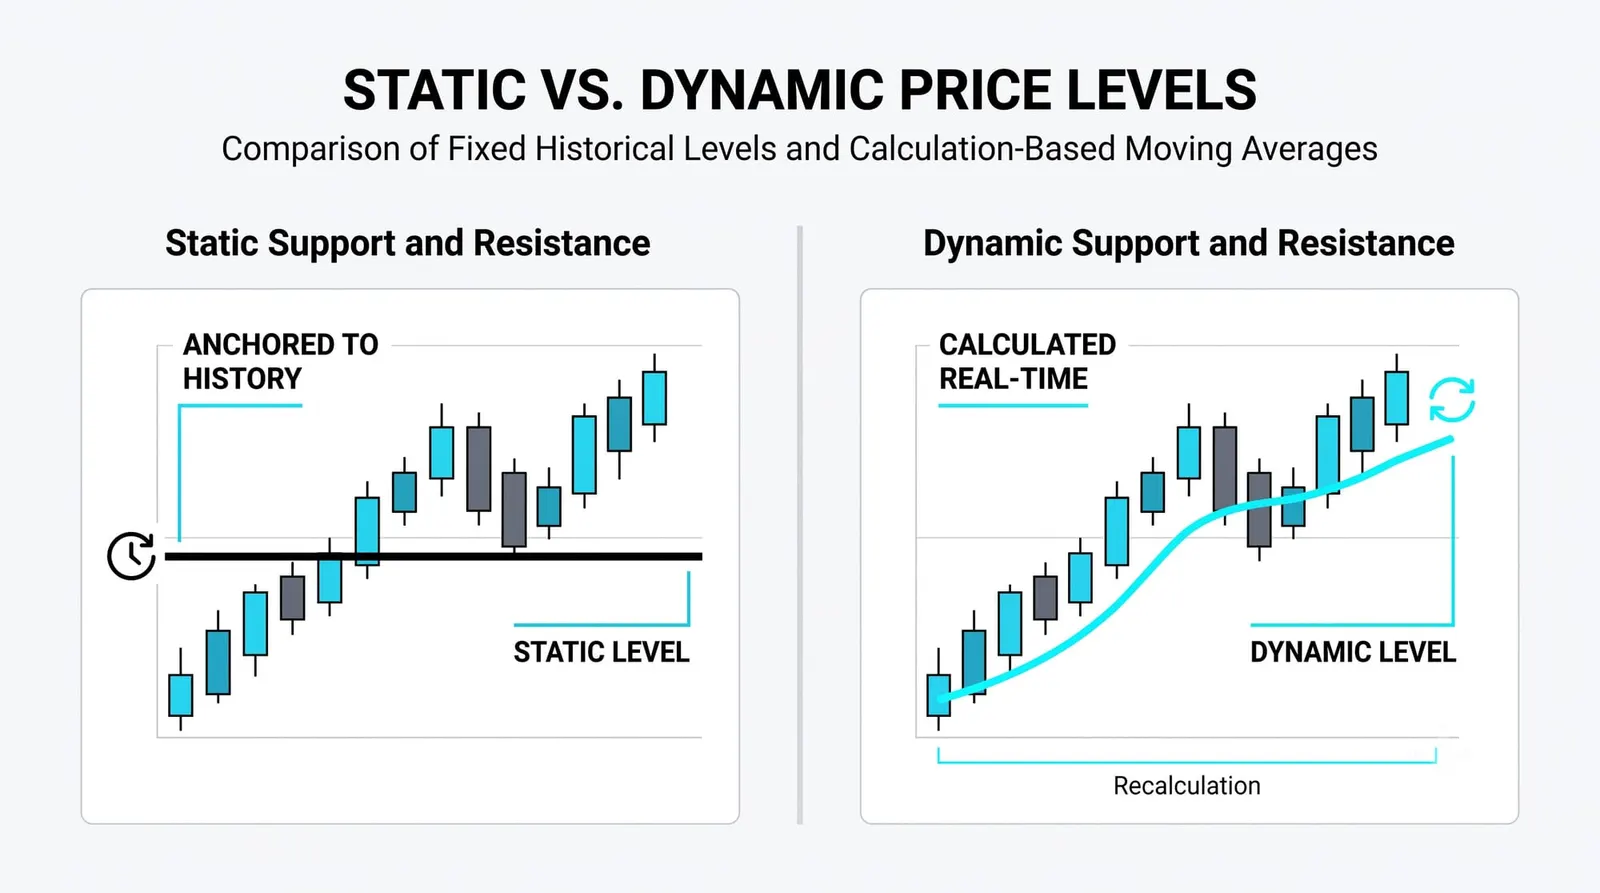
Static levels come from memory. They sit where price actually turned before: an old peak, an old trough, a gap. Enough traders remember those prints that the level keeps mattering.
A dynamic level comes from arithmetic. Nobody traded at the moving average's value in the past. The line matters because enough participants watch the same calculation and react at it, and because it happens to track the average cost of recent positioning. The source is different even when the behavior looks identical.
The two converge when the average goes flat. A flat average barely moves bar to bar, so it behaves almost exactly like a static horizontal level. Watch for this, because it usually signals the trend is pausing.
Here is the blunt part. In a range, a moving average gives false levels. Price chops back and forth through the line, touching it from both sides with no respect at all. A whipsawing average is not support or resistance. It is noise with a line drawn through it, and treating it as a level will cost you.
Reading Moving Average Reactions in Practice
Which period you watch depends on what you are trading. Shorter averages, the 10 and 20, hug price and suit swing traders looking for pullback entries within a move. Longer averages, the 50 and 200, move slowly and define the trend itself. Institutions watch the longer ones, which is part of why reactions there carry weight.
Slope is your health check. A rising average with price above it is a functioning floor. A falling average with price below it is a functioning ceiling. A flattening average is a warning that the trend is losing drive, whatever price is doing in the moment.
Never read the touch in isolation. Stack it. A pullback to the 20-period average on shrinking volume, with a rejection candle closing strong, is a far better read than a touch on heavy volume with a weak close. The average gives you the location. Volume and candles tell you what happened there.
Three Bounces and a Break
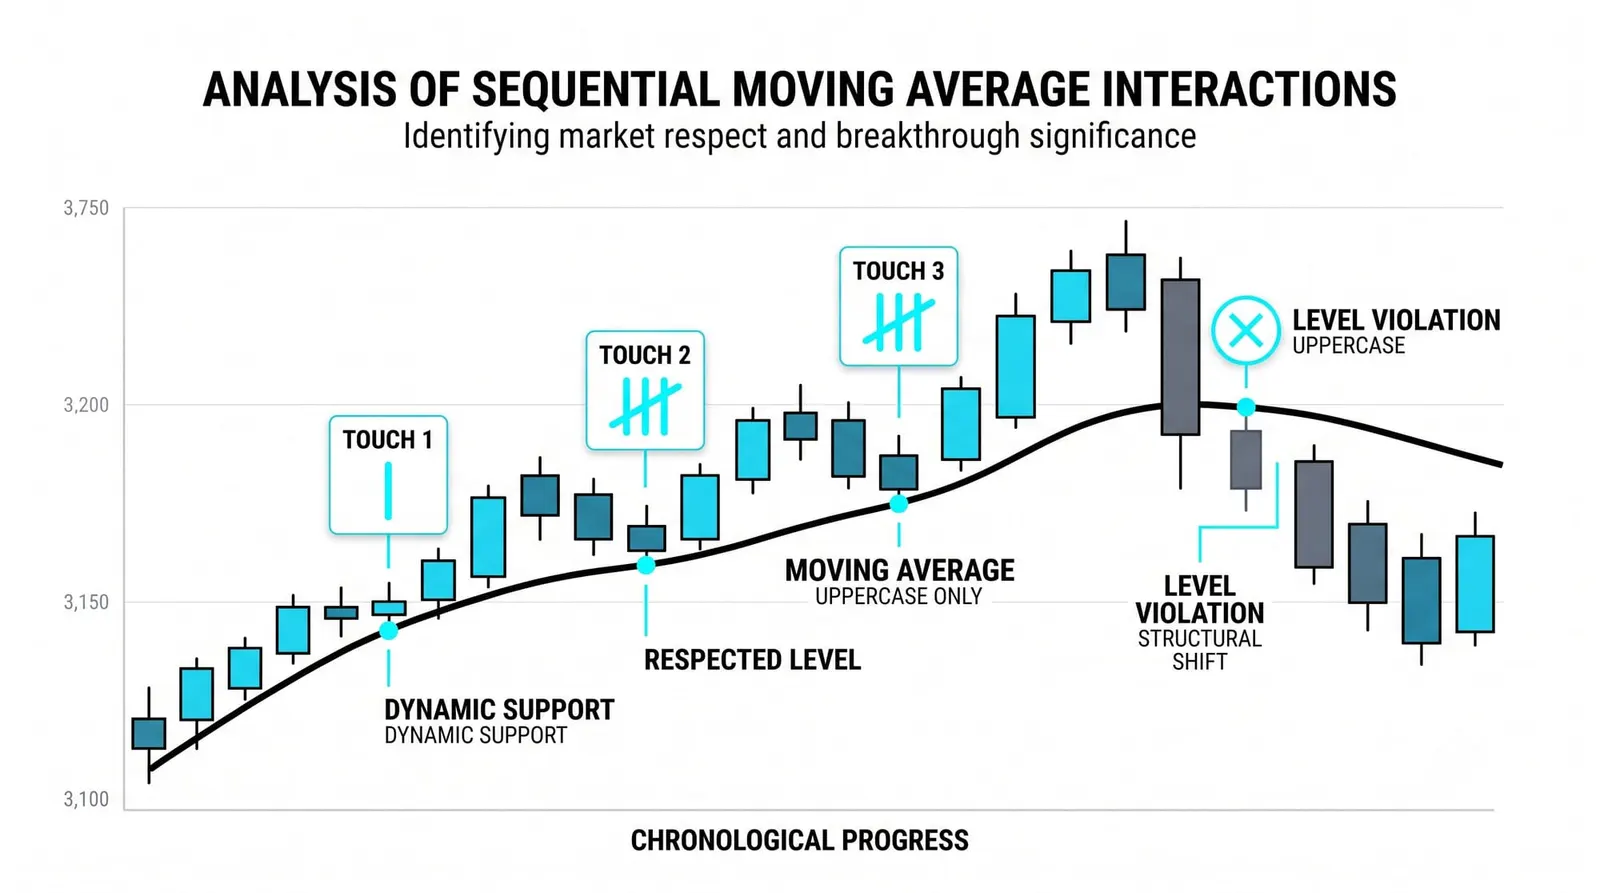
Hypothetical numbers, purely for illustration. A stock is trending up and riding its 20-period average.
First pullback: price dips and touches the average at 50. Buyers step in, the candle closes back above, and the climb resumes. Healthy touch number one.
Second pullback: the average has climbed, and price touches it at 52. Same rejection, same resumption. The line is doing its job, and each touch confirms buyers are defending it.
Third pullback: the touch comes at 54. Another bounce. Three touches, three defenses, and the trend's floor has risen from 50 to 54 while price advanced. This is dynamic support working exactly as described.
Then the fourth pullback. Price falls through the line and closes at 50.5, more than 3 percent below where the average sits, and it does not recover for days. That is not a touch. That is a break that holds. The depth of the close and the failure to reclaim the line are what separate it from the failed breaks you saw before.
Now watch the flip. When price finally rallies back up toward the average, it stalls there. The floor that was defended three times at 50, 52, and 54 is now a ceiling overhead. Same line, opposite role, and the trader who understood the flip was not surprised by it.
| Situation | What the line is doing | How to read it |
|---|---|---|
| Price above a rising average | Climbing beneath price, acting as a moving floor | Trend is healthy; pullbacks to the line are tests, not threats |
| Price below a falling average | Descending above price, acting as a moving ceiling | Downtrend intact; rallies into the line are suspect |
| A flattening average | Barely moving, converging toward static behavior | Trend is losing drive; expect a decision soon |
| An average whipsawing in a range | Crossed repeatedly from both sides | No reliable level here; stand down until a trend emerges |
Dynamic Levels, Answered
Which moving average is best for dynamic support?
There is no single best one; the 20-period suits swing trading and the 50 and 200 suit trend-following. Pick the period that matches your timeframe and test whether price actually respects it on the instrument you trade. Consistency matters more than the number.
Why does price bounce off a moving average?
Partly because enough traders watch the same line and act at it, and partly because the average approximates the recent average cost of positioning. Pullbacks to that zone attract buyers who missed the earlier move and holders defending their positions.
Do moving averages work as resistance in uptrends?
Not usually. In an uptrend the relevant averages sit below price and act as support. Resistance from a moving average appears when price is below the line, either in a downtrend or after a break that flipped the level.
What does it mean when price closes below a moving average?
By itself, very little. One close through the line is often a failed break that snaps back. It becomes meaningful when the close is deep, price stays below for several bars, and the next rally stalls at the line from underneath.
You now know how to read a single average as a traveling level, and you have seen two averages interact in the crossovers lesson. Next, the standard periods: why traders keep reaching for the 20, 50, 100 and 200.