Parabolic SAR: Trend and Trailing Stops
Parabolic SAR is a trend tool that plots a small dot below price in an uptrend and above price in a downtrend, trailing the move the whole way and flipping sides the moment price crosses it. It was built as a trailing-stop guide, never a forecast. The dot does not predict where price is going. It only marks where you would get out if the direction you are riding fails.

Think of it as a bodyguard walking a step behind you, always on the safe side, switching sides the instant you cross the street. The behavior is that simple. Step behind, stay close, switch when crossed.
Earlier in this level you saw moving averages used as dynamic support and resistance. The SAR is the extreme version of that idea: a level defined to flip rather than hold. And the trend concept from the technical levels is the backdrop here, because this tool assumes a trend exists before it earns its keep.
What the Dots Actually Are
SAR stands for stop and reverse. The name tells you the design. Each dot is a stop level, and when price touches it, the assumption is that you stop out and reverse, so the dots jump to the other side and start trailing in the new direction.
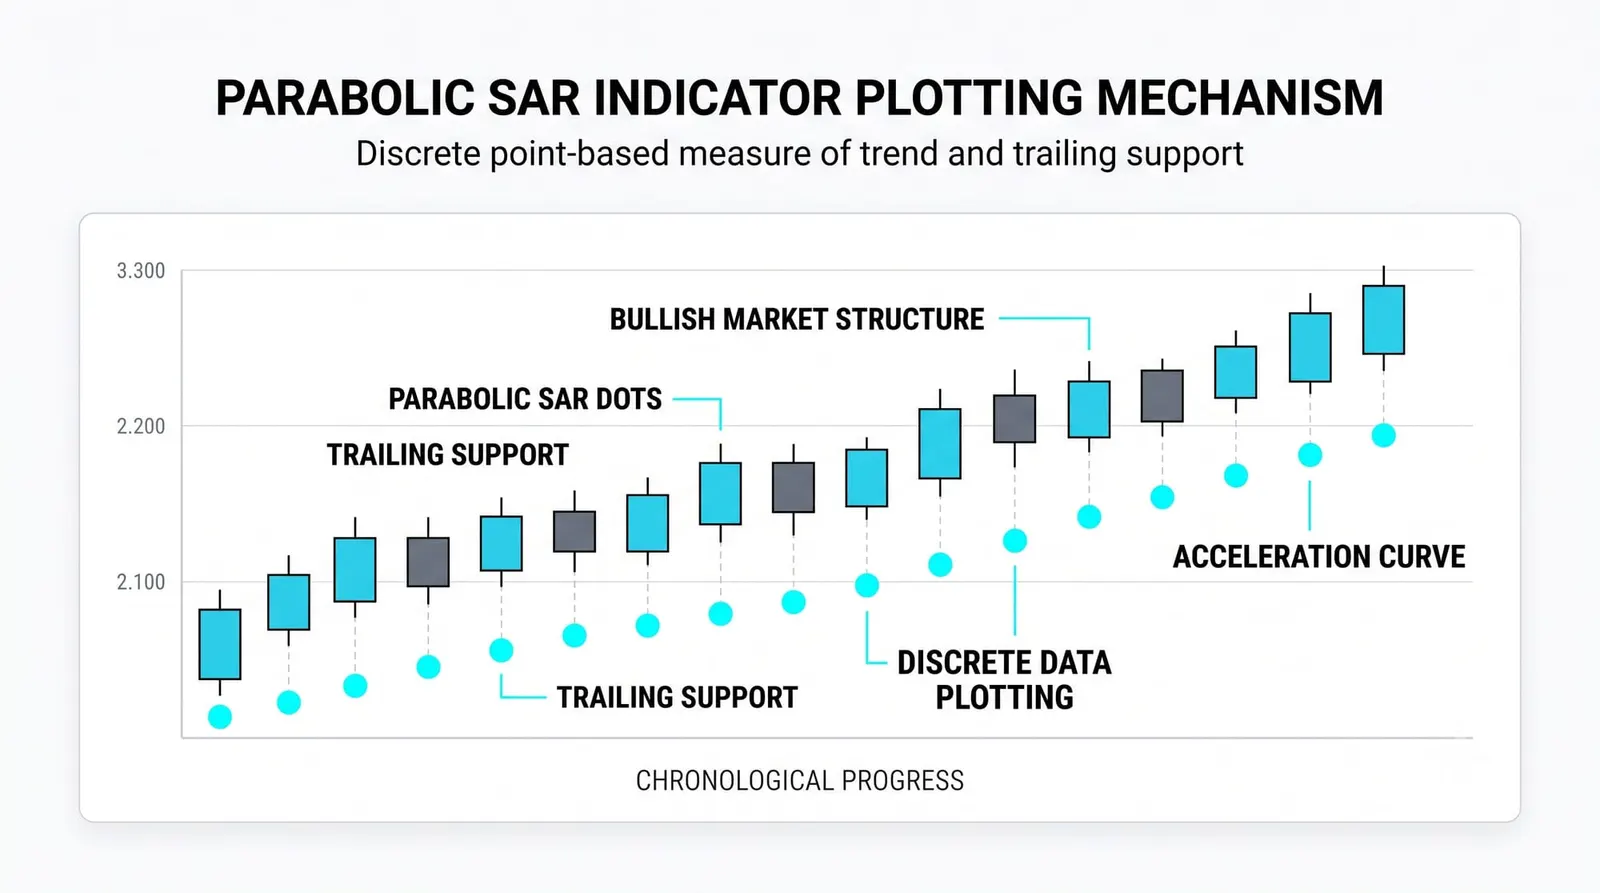
The dot trails price as the move extends. Each new period, the dot steps closer to price, and the steps get larger the longer the trend runs. That is the acceleration idea. Early in a trend the dots sit far away and give the trade room to breathe. As the trend matures, the dots tighten their grip, because a long-running trend has less room for error before it counts as broken.
You never need the formula to use it. You need the behavior: distance early, pressure late, flip on contact. A fresh trend gets slack. An old trend gets a short leash.
How the Trailing Stop Works
The mechanism is a ratchet. In an uptrend the dots only rise, never fall. Once a dot prints at a level, that level becomes a floor the tool will not lower. The stop can tighten or hold, but it can never loosen.
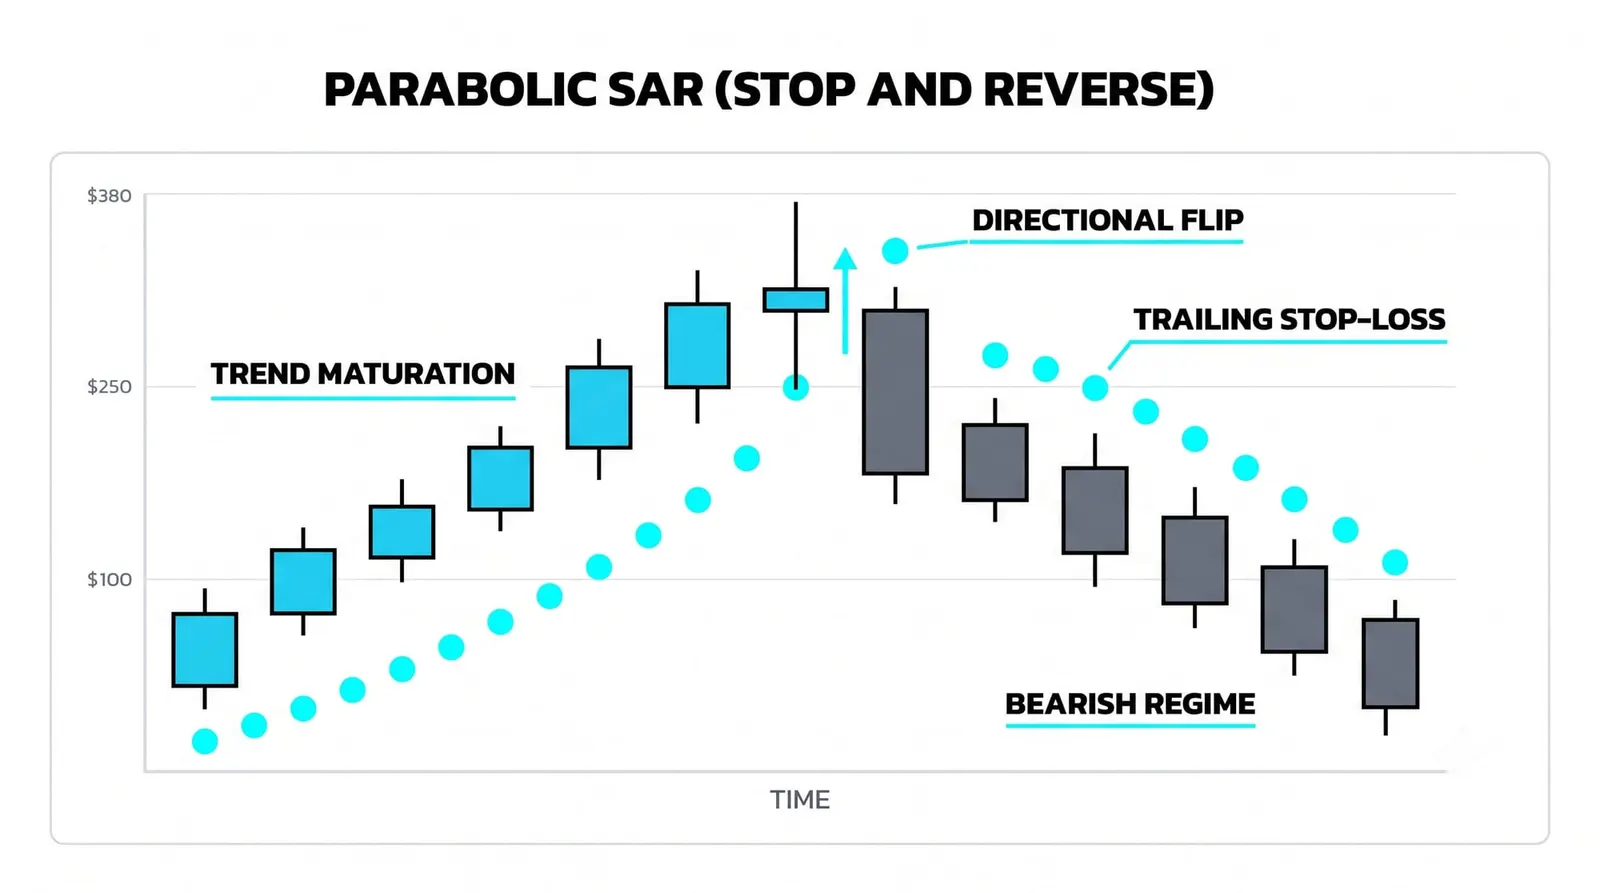
When price finally closes through the dot, two things happen at once. The touch is an exit signal for the long, and the dots reappear above price, which by construction is also a reverse signal. The tool does not separate those two events. Flip means out, and flip means the other side, in the same breath.
That ratchet is the tool's temperament. It is optimistic early and paranoid late, and it never forgives a cross. Whether you treat the flip as a reversal entry or just an exit is your choice, but the tool itself was built assuming both.
Where It Works and Where It Fails
In a long, clean trend the SAR is excellent, the purest expression of a trend riding a tool. The dots ride the whole move underneath price, tightening as it matures, and they get you out near the turn without you having to guess the top. One tool, one job, done well.
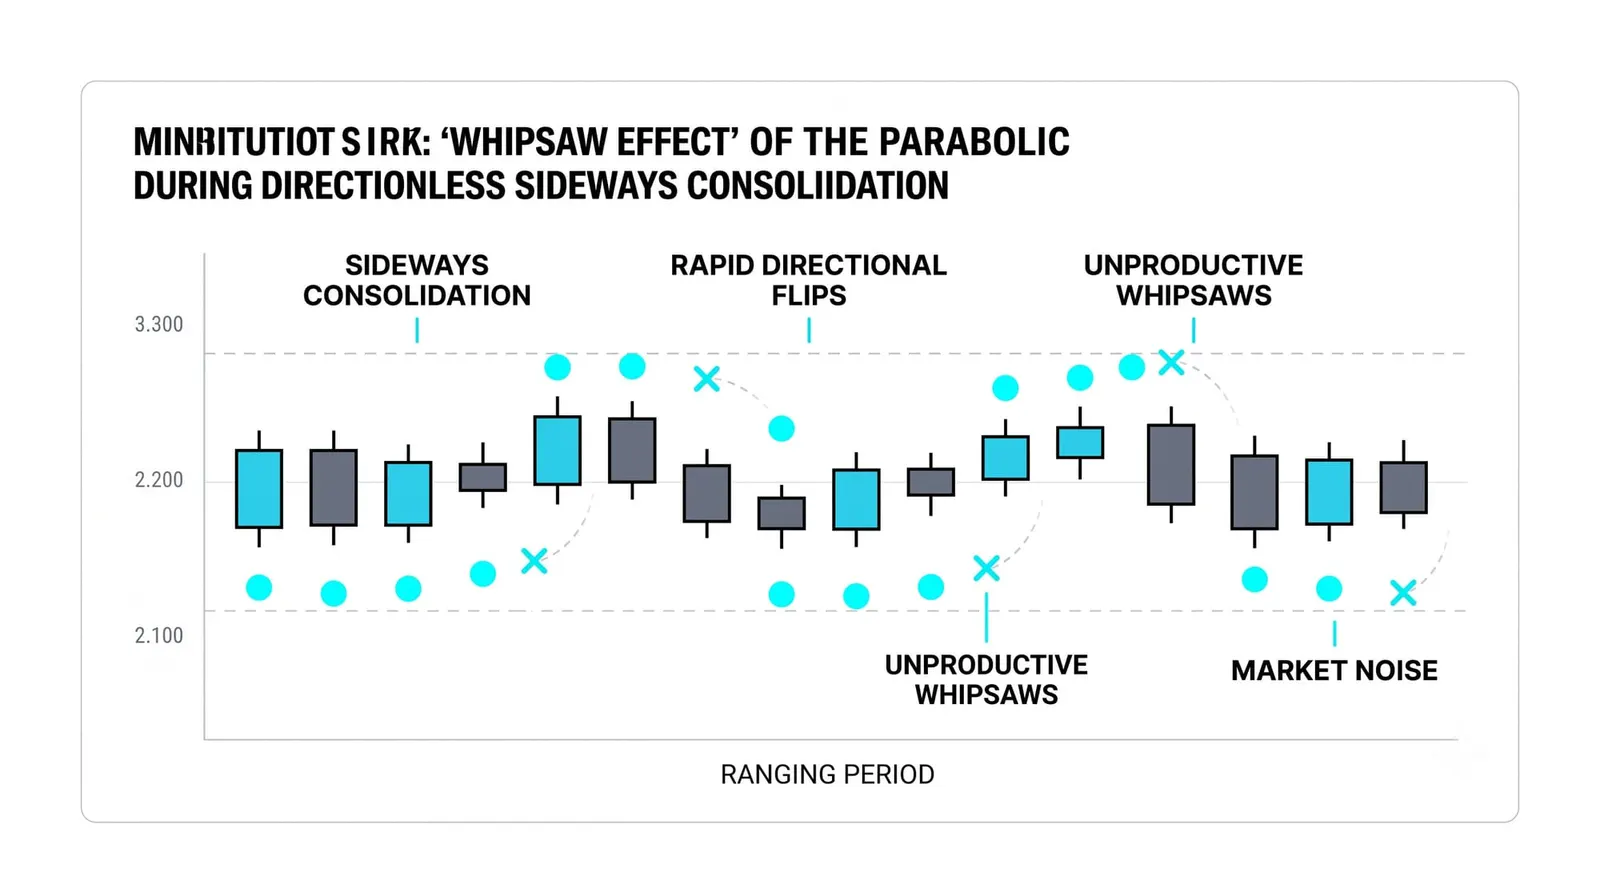
In a range it is terrible. Price wanders sideways, crosses the dots every few bars, and each cross is a flip. Each flip is a small loss or a scratch. String a dozen flips together and the account bleeds from a market that went nowhere.
This failure is structural, not a settings problem. A ratchet has no patience. It cannot tell a real reversal from noise, because its only rule is the cross, and sideways markets cross everything constantly. You filter the regime first, or the SAR will churn you.
How Traders Use It
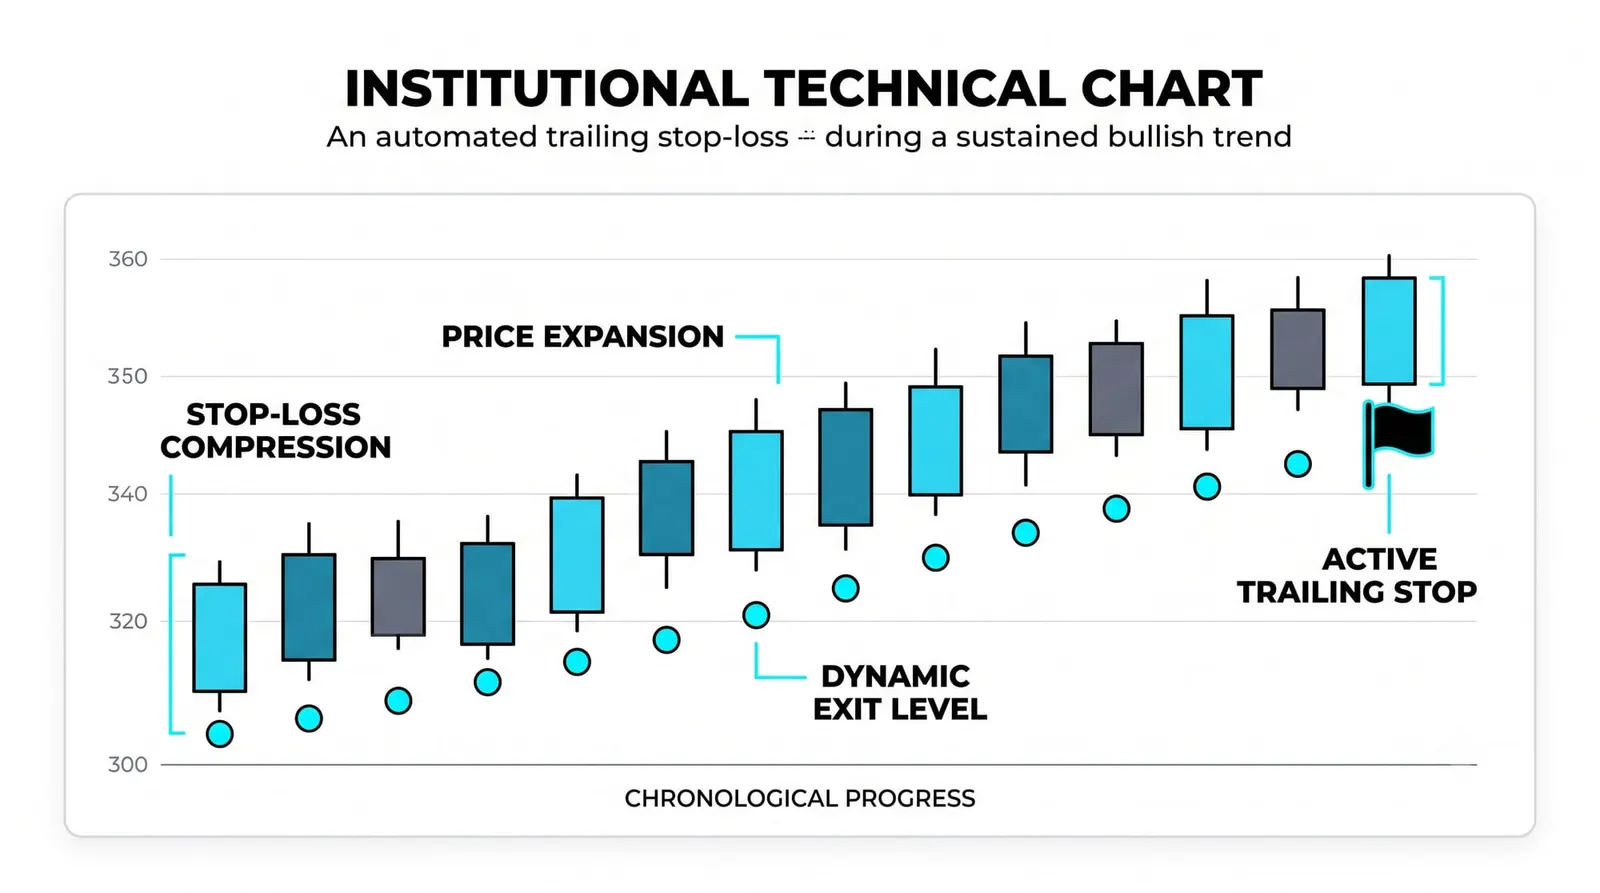
The most common use is managing a position already held. You entered on your own analysis, and the dots become your trailing stop. As long as the dots stay below price, you hold. The day price closes through, you exit. No debate, no renegotiation with yourself.
Some traders read the flip history as a crude regime gauge. If flips are rare and far apart, the market is trending. If flips cluster every few bars, the market is chopping and trend tools should sit out. The dots become a weather report before they become a signal.
The sturdier approach pairs the SAR with a slower filter. A higher-timeframe trend read or a long moving average decides which direction you are allowed to trade, and the SAR only manages the exit within that permission. The slow filter decides. The SAR manages. It never decides alone.
Nine Weeks on the Dots
Here is a hypothetical illustration with round numbers. A stock climbs from 40 to 58 over nine weeks. The dot starts at 39, just under the entry, and ratchets upward as the trend extends: 41, then 43, then 46, then 50, then 53, then 56 by week nine.
During those nine weeks the rising dots did one thing: they gave you a stop that only moved in your favor. At no point did the tool ask you to widen your risk. Each week your worst-case exit got better, from 39 to 56, while price did the climbing.
In week ten, price closes at 55.5, below the dot sitting at 56.5. That close is the flip. The dots jump above price and restart at 58, and the tool now reads the move as down until proven otherwise.
Count the trade honestly. You rode from 40 to an exit near 55.5 or 56. You gave back roughly 2.5 points from the 58 top, against an 18-point climb captured. That give-back is not a flaw. It is the fee every trailing stop charges, because no trailing tool can exit at a high it cannot see coming.
| Pattern on the chart | What it marks | Usual action |
|---|---|---|
| Dots below a rising price | Uptrend with a rising trailing stop | Hold longs, trail the stop up |
| Dots above a falling price | Downtrend with a falling trailing stop | Hold shorts or stay out, trail down |
| Flip from below to above | Price broke the stop, uptrend flagged as broken | Exit longs, optional short signal |
| Flip from above to below | Price broke the stop, downtrend flagged as broken | Exit shorts, optional long signal |
The Parabolic SAR, Answered
What does SAR stand for?
Stop and reverse. The dot is a stop level, and when price crosses it the tool assumes you exit and take the other side, so the dots jump across price and trail the new direction.
What do the dots below price mean?
Dots below price mean the tool reads an uptrend. The lowest dot is your trailing stop, and it only moves up or holds, never down, tightening as the trend matures.
Can the SAR acceleration be adjusted?
Yes. The acceleration settings control how fast the dots close in on price. Faster settings hug price tightly and flip often; slower settings give trades more room and flip less. The default is a reasonable starting point, and the trade-off is always responsiveness against whipsaws.
Does the SAR work in sideways markets?
No. Sideways price crosses the dots constantly, producing flip after flip and a string of small losses. The tool assumes a trend exists, so pair it with a trend filter or stand down when flips start clustering.
Next in this level, the ADX takes the regime question head-on: it measures trend strength without picking a side, which makes it the natural partner for everything you just read.