ADX: Measuring Trend Strength
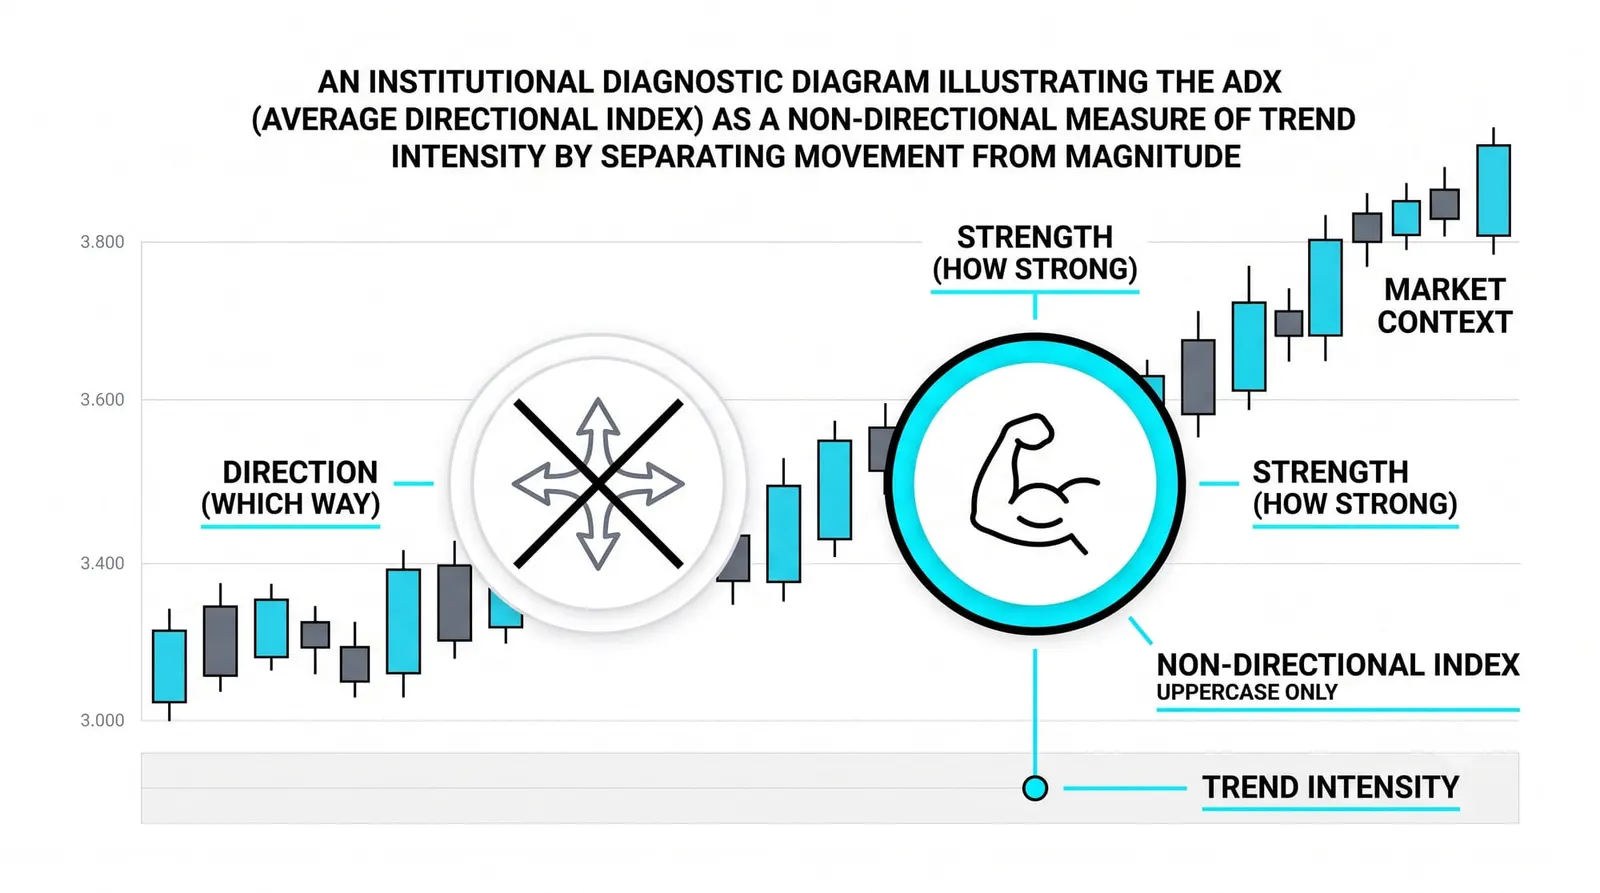
ADX, the average directional index, exists for one job: measuring the strength of a trend, never its direction. When a trend gathers force, the line rises. When that force decays, the line falls. Whether price is climbing or collapsing, ADX stays silent on direction.
That split makes it unusual among the tools you have met so far. An anemometer tells you how hard the wind blows, never which way it blows, and ADX is that meter for trend. A reading of 35 says the market is moving with conviction. It does not say where.
What a trend actually is was covered back in the market structure work, so this lesson assumes that foundation. The moving averages you have studied measure direction through price position: price above the line leans bullish, below it leans bearish. ADX deliberately throws that information away and keeps only the intensity.
What ADX Actually Measures
ADX was born inside a larger system called the directional movement index. That system has two working parts: a plus DI line and a minus DI line.
The plus DI tracks the strength of upward movement from bar to bar. The minus DI tracks the strength of downward movement. Each new bar is compared with the one before it, and the system asks a simple question: how much of this move pushed beyond the previous bar's range, and in which direction?
Those two lines are the raw contest between buyers and sellers. ADX takes that contest and smooths it into a single number. The result is a measure of how decisively one side is winning, regardless of which side it is.
So the construction works in layers. First, compare each bar's push against the last. Second, split that push into up-force and down-force. Third, smooth the gap between them over time. What survives all that smoothing is pure trend strength with the sign stripped off.
Reading the Line
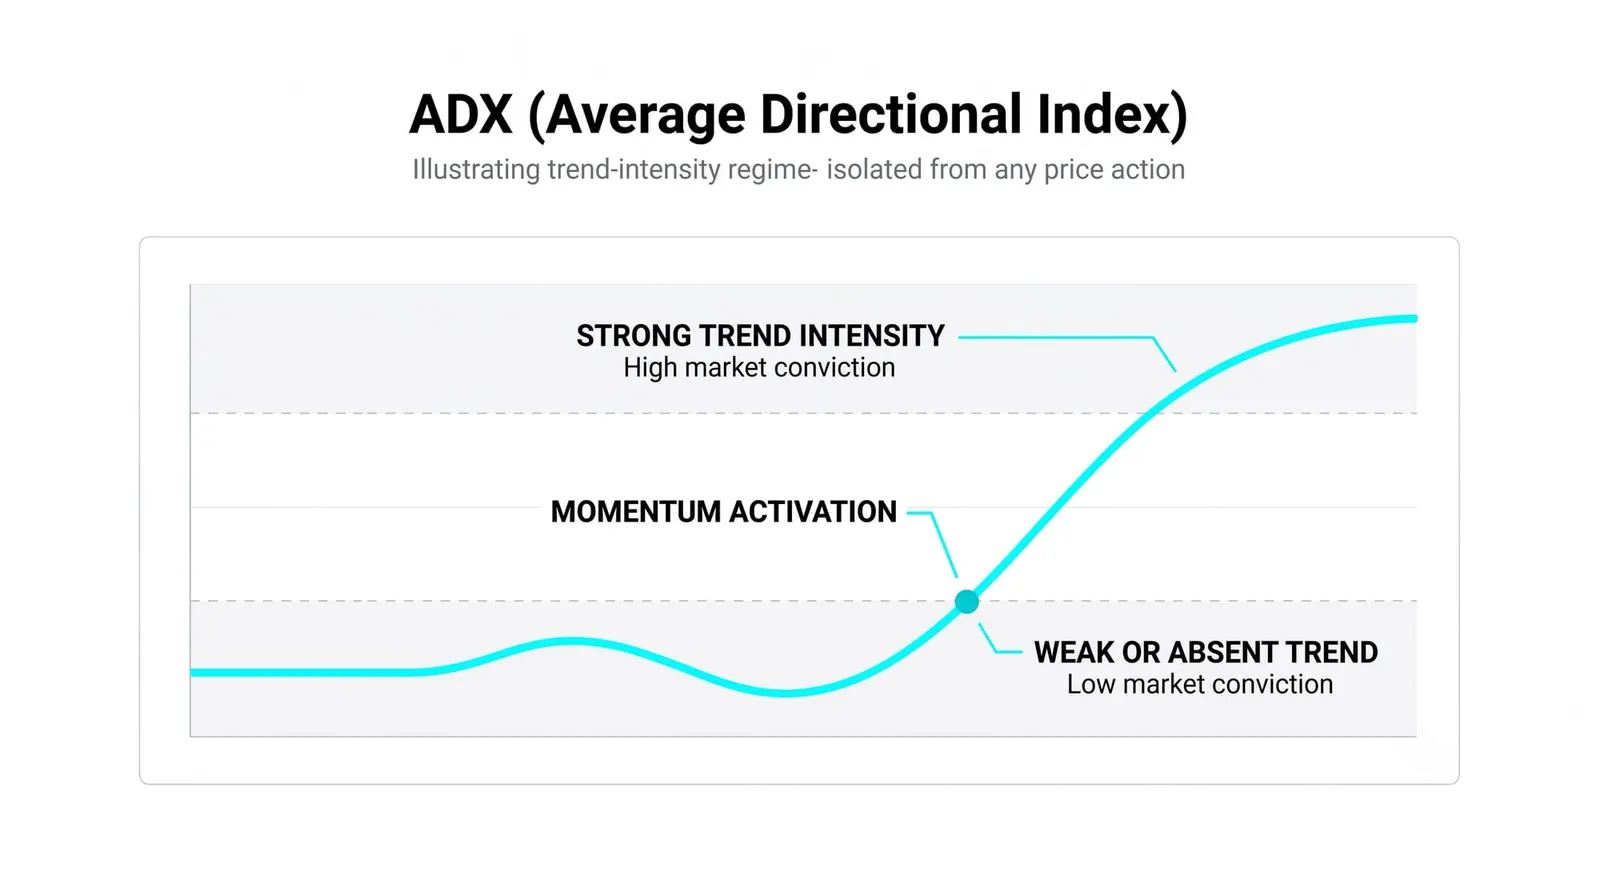
The conventions most traders use are simple. Below roughly 20, the market is drifting or ranging. There is no trend worth trading, only noise.
Above roughly 25, a trend has real force behind it. Between 20 and 25 sits a grey zone where the market may be waking up or may be faking it.
The level matters less than the slope. A rising ADX means the trend is strengthening, whatever its absolute value. A falling ADX means the trend is aging, even if the number still sits high.
This trips people up. A market can be trending hard while its ADX slides from 45 toward 30. Price can still be making new highs. The falling line is not saying the trend reversed. It is saying the trend's energy is draining, which is a warning about quality, not a signal to reverse.
Why Strength Is Not Direction
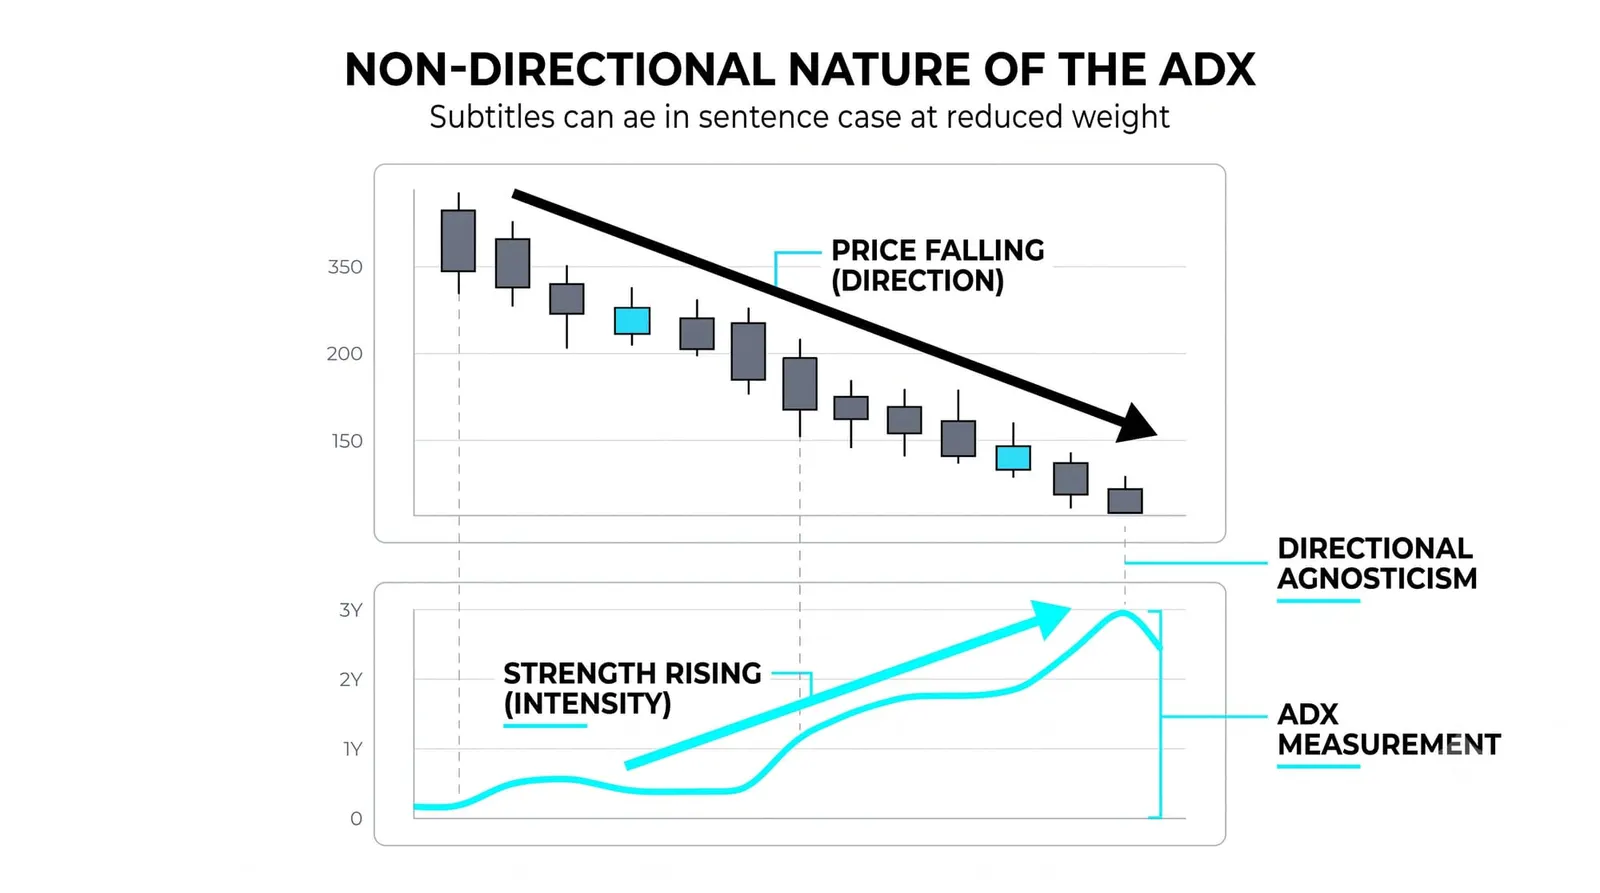
ADX rises in powerful downtrends exactly as it does in powerful uptrends. A market in freefall can print an ADX of 40. So can a market in a vertical rally.
Keep that picture fixed in your mind, because new traders misread it constantly. They see ADX climbing and assume bullishness. All the climbing line confirms is that movement is decisive. The direction of that movement must come from somewhere else.
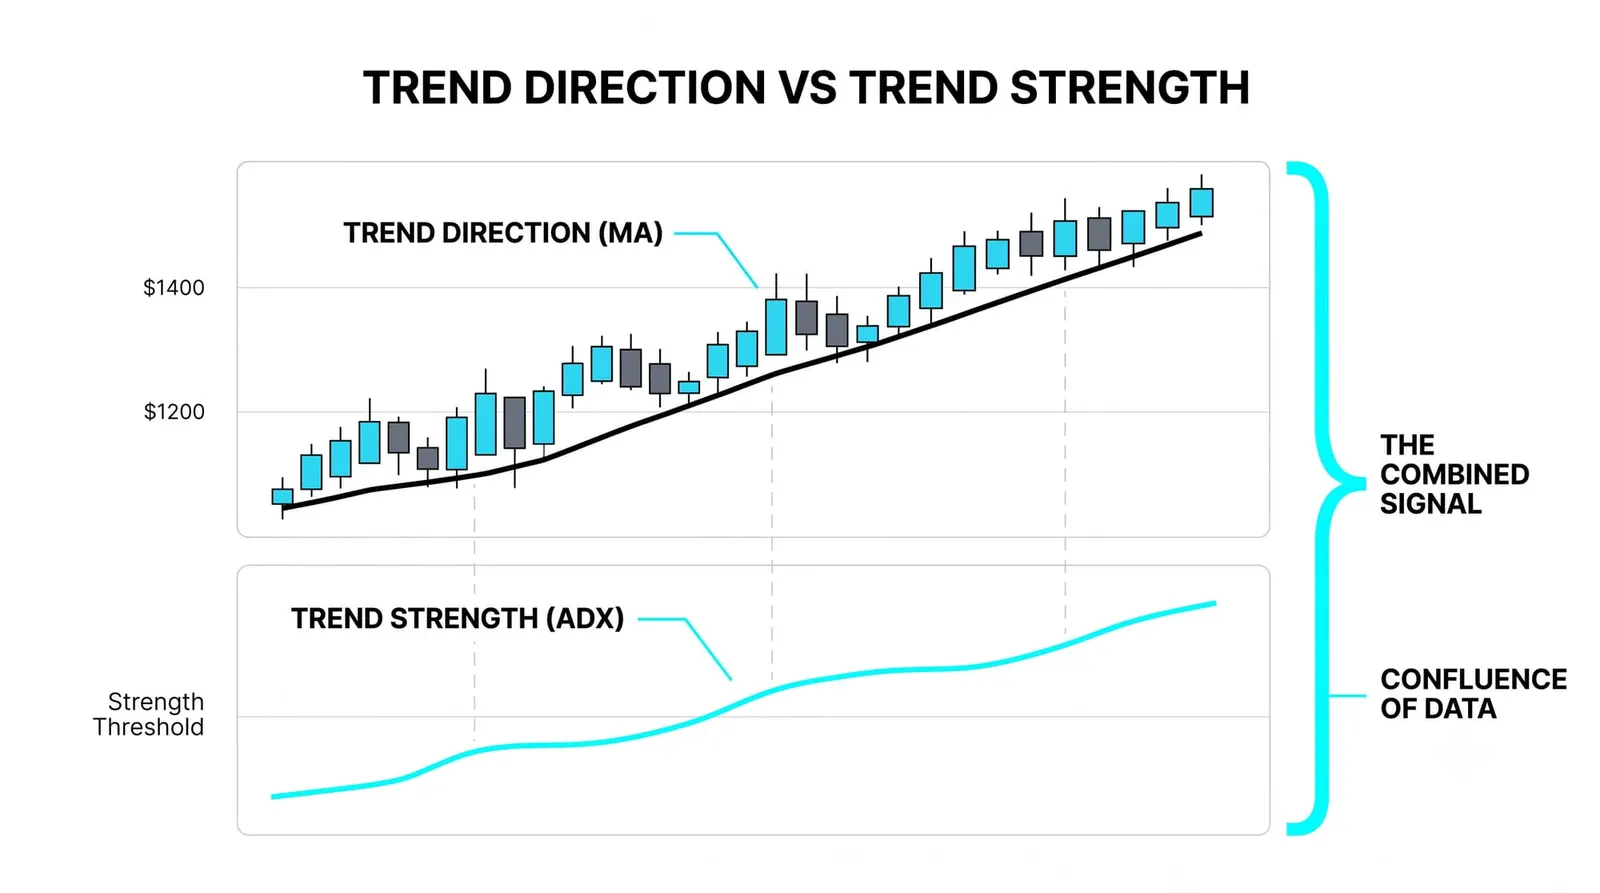
That somewhere else is the work you already know. Price structure, swing highs and lows, moving average position. Those tools answer "which way." ADX answers "how hard." A complete read needs both answers, from different tools, at the same time.
The Weak Spots
ADX confirms trend strength after the trend has started. The smoothing that makes the line stable also makes it slow. At turning points, when a fresh trend is being born, ADX is still reporting on the old, dead market.
That lag is structural, not a flaw you can tune away. Shorten the period and the line gets twitchier, not earlier.
The second weakness lives near the threshold. In half-trends, the kind that grind sideways with a slight tilt, ADX hovers around 20 to 25. It crosses above, dips below, crosses again. Each cross tempts you into a position that the market does not reward.
And be honest about the numbers themselves. The 20 and 25 levels are habits passed down from the tool's original settings, not laws of nature. Some markets trend meaningfully at an ADX of 22. Others drift even at 27. Treat the thresholds as a starting vocabulary, then calibrate them against the instruments you actually trade.
Two Markets, One Reading
Here is a hypothetical with round numbers to make the split concrete.
Market A climbs from 50 to 65 over three months. Each week it pushes a bit higher, pulls back shallowly, and pushes again. Over those same three months, its ADX rises from 18 to 32.
Market B falls from 65 to 50 over the same three months. Same rhythm, flipped: steady pushes lower, shallow bounces, more selling. Its ADX also rises from 18 to 32.
Two opposite trades, one identical indicator path. Both markets delivered a sustained, one-sided move, and ADX faithfully recorded the growing conviction in each. It could not do otherwise. The math that builds the line measures the size of the directional imbalance, and both markets had the same imbalance in opposite directions.
Now imagine trading from the ADX print alone. Both screens show 32 and rising. One of those markets rewarded buyers for three months. The other punished them every single week. The number that looks identical is attached to opposite outcomes.
So the practical stack looks like this. Price structure tells you Market A is making higher highs and higher lows, an uptrend. ADX at 32 and rising tells you that uptrend has force. Only the combination produces a trade idea: trend direction from structure, trend quality from ADX, timing from whatever entry method you use. Strip away any layer and the reading breaks.
| ADX Condition | What It Says About the Trend |
|---|---|
| Below 20 | No meaningful trend; the market is ranging or drifting, and trend-following tactics have little to work with. |
| Between 20 and 25 | A transition zone; a trend may be forming or dissolving, and readings here whipsaw easily. |
| Above 25 and rising | A trend with real, growing force; the move is being driven with conviction in one direction. |
| Above 25 and falling | A trend that still exists but is aging; energy is draining even if price keeps extending. |
ADX, Answered
What is a good ADX reading?
There is no universally good reading, only readings that match your intent. If you trade trends, you generally want ADX above roughly 25 and rising, because that confirms a market moving with force. Below 20, most trend-following approaches are fighting a range. The number qualifies the environment; it never qualifies a trade by itself.
Does ADX show trend direction?
No. ADX measures strength only, and it rises in strong downtrends exactly as it rises in strong uptrends. Direction has to come from price structure, moving averages, or the DI lines themselves. A high ADX tells you the market is committed, not where it is committed to going.
Why does ADX lag at turning points?
Because it is built from smoothed data. Each bar's directional movement is averaged over many bars before it reaches the ADX line, so a brand-new trend barely moves the number at first. By the time ADX confirms strength, the early portion of the move is already gone. That is the price of a stable line, and no setting removes it.
What are DI plus and DI minus?
They are the two components underneath ADX. The plus DI measures the strength of upward pushes from bar to bar, and the minus DI measures the strength of downward pushes. When the plus line sits above the minus line, buyers are winning the bar-by-bar contest, and vice versa. Some traders use their crossovers as a rough directional signal, with ADX then judging whether that signal has any force behind it.
Next in this level, the indicator layer continues with tools that combine direction and momentum in a single line, and you will see how they handle the problem ADX refuses to touch.