Ichimoku Cloud: A Full System Breakdown
This is the full breakdown of the Ichimoku Cloud: five lines built to work as one system. Goichi Hosoda published it in 1969 after decades of manual testing, and the idea was simple: trend, momentum, and support-resistance, all visible in a single look, with the cloud itself showing support and resistance projected into the future.

Think of it like a sound engineer's mixing board: five faders that mean nothing alone and one mix when set together. Each line alone tells you little. Together they give you a bias, a momentum read, and a confirmation check.
One thing separates these lines from the moving averages covered earlier in this level. Ichimoku's lines are midpoints of the high and low over a period, not averages of closing prices. They measure equilibrium, the balance point of a range, so they sit under price differently than a close-based average does.
And unlike most tools, Ichimoku was designed as a whole rather than a single value plotted on a chart. You are not adding one indicator to a stack. You are adopting a framework.
One Chart, One Look
The full Japanese name, Ichimoku Kinko Hyo, translates roughly as "one-look equilibrium chart." That name is the design brief. Hosoda wanted a trader to glance at a chart and come away with a complete reading, no screen crowded with separate panels.
Hosoda worked on it for decades before publishing in 1969, testing calculations by hand with a team of students. There were no computers to brute-force the settings. The numbers that survived did so because they held up across manual testing on real charts.
This matters for how you approach it. Most indicators answer one question: how fast is price moving, how strong is the trend, how stretched is the move. Ichimoku refuses to answer one question. It answers several at once and expects you to weigh the answers together.
That is also why it looks intimidating at first glance. Five lines and a shaded cloud is a lot of ink. The cure is to learn what each part does, then let the system do the work it was built for.
The Five Parts at a Glance
The cast, one sentence each. The next lesson in this level zooms into the formulas and the settings behind them.
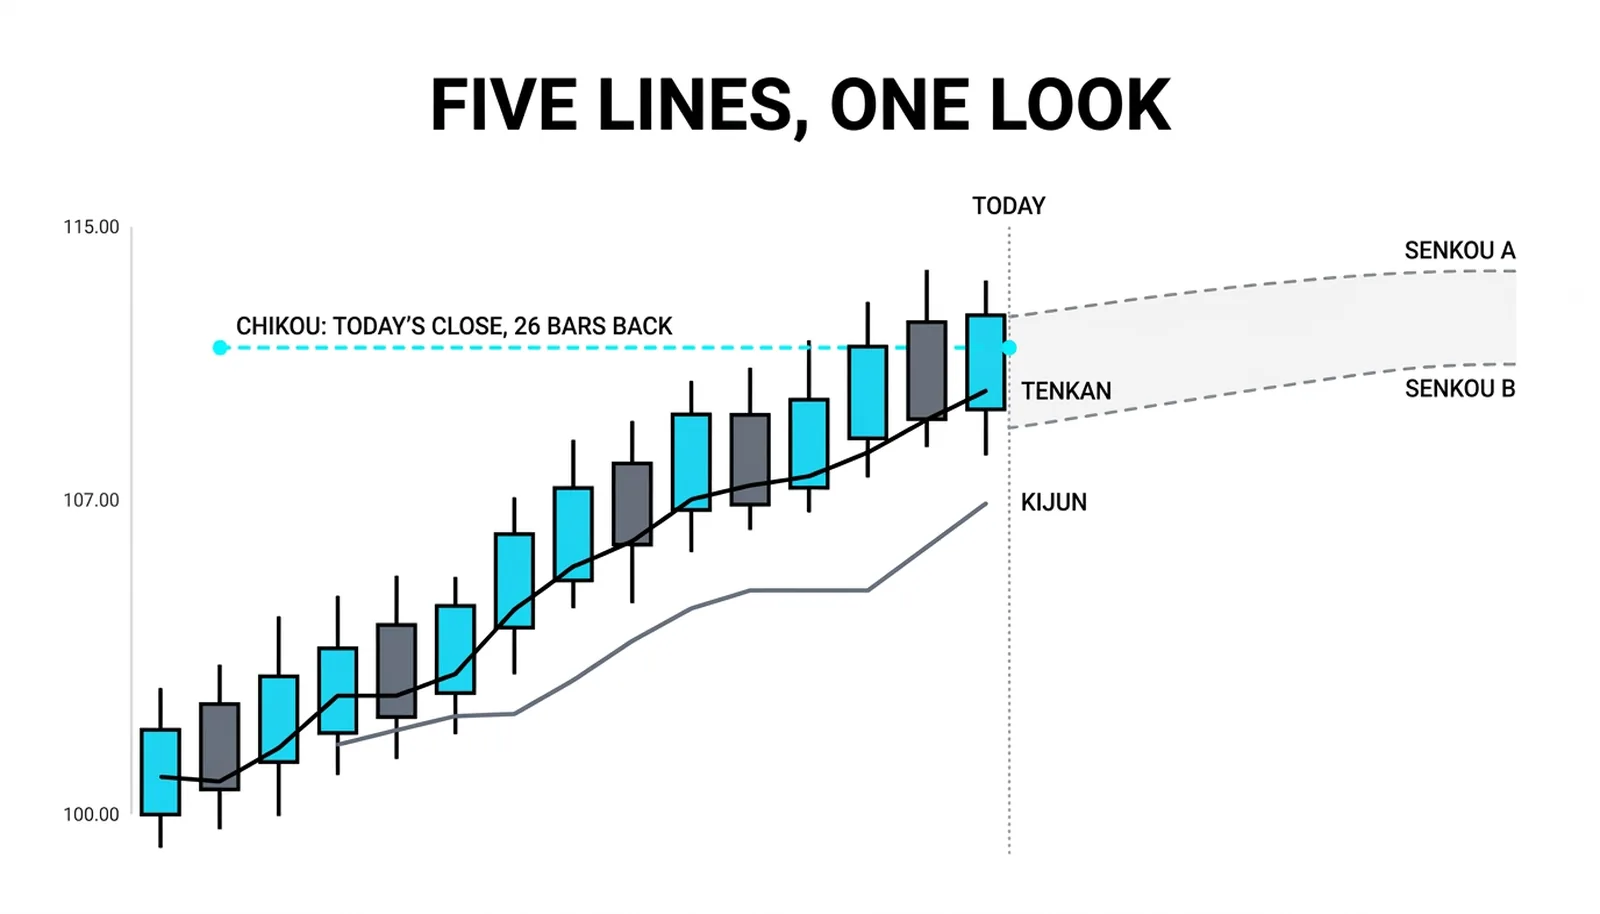
- Tenkan-sen (conversion line): the midpoint of the last 9 periods, a fast read on short-term equilibrium and momentum.
- Kijun-sen (base line): the midpoint of the last 26 periods, the slower balance point that often acts as a magnet or a floor.
- Senkou Span A: the average of the Tenkan and Kijun, projected 26 periods ahead, forming one edge of the cloud.
- Senkou Span B: the midpoint of the last 52 periods, also projected 26 periods ahead, forming the other edge of the cloud.
- Chikou Span (lagging line): today's close plotted 26 periods back, so you can compare current price against where price sat a cycle ago.
Notice the periods: 9, 26, 52. Those numbers come from the Japanese trading week of Hosoda's era, and they have persisted because traders kept finding them useful. The next lesson digs into whether you should keep or change them.
Why the Cloud Comes From the Future
The two Senkou spans are plotted 26 bars ahead of the current bar. That is the unusual move. Almost every other indicator stops at the right edge of the chart; Ichimoku draws part of itself into empty space.
The logic is straightforward. If the midpoint of recent price action represents equilibrium, then today's equilibrium is a reasonable first guess for where support or resistance will sit tomorrow. The cloud takes that guess and draws it forward.
The space between the two spans is the cloud itself, the kumo. When Senkou A sits above Senkou B, the cloud is bullish; when B sits above A, it is bearish. The shaded area between them is a zone, not a line.
Thickness carries meaning. A thick cloud means the two spans are far apart, the fast and slow equilibrium readings disagree widely, and the zone below or above price is a heavy one. Price rarely punches through a thick cloud cleanly.
A thin cloud is the opposite. The two readings nearly agree, the zone is narrow, and price can cross it with little effort. A thin cloud ahead is a warning that an established bias can flip easily.
Support and resistance, drawn before price gets there. No other common tool on your chart does that.
What the System Is For
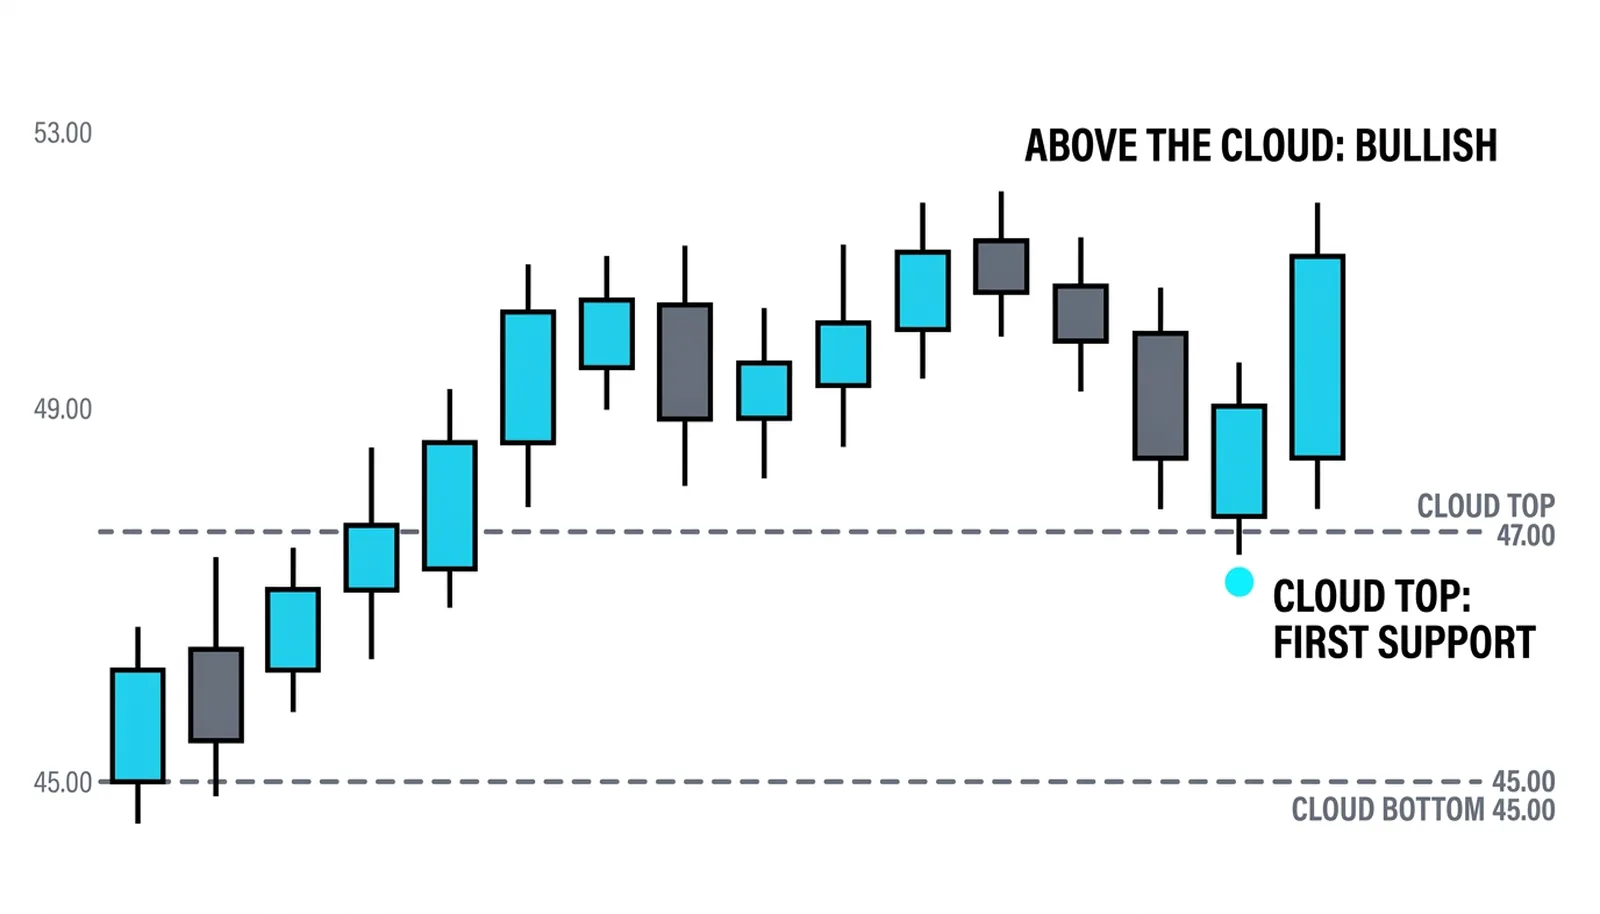
Start with bias. Price above the cloud means the bullish read; price below it means bearish; price inside the cloud means no trade, because price is sitting inside the zone of disagreement itself. That one rule filters out a large share of bad entries.
Next, momentum. The Tenkan and Kijun work like a fast and slow pair. Tenkan above Kijun confirms short-term momentum agrees with the direction; a cross of the two is an early signal, strong when it happens on the correct side of the cloud, weak when it happens against it.
Then confirmation. The Chikou span compares today's close with price 26 periods back. If the Chikou sits above the price action of its own time, the path behind is clear and the bullish case has one more vote. If it is tangled in old candles, something from the past is in the way.
Put the three together and you have the system's real purpose. It is a framework first and a signal generator second. The traders who struggle with Ichimoku are usually the ones hunting for a single line cross to obey. The traders who get value from it read the whole arrangement and ask a simpler question: do these five parts agree?
When they agree, you have a high-quality condition. When they disagree, the system's answer is patience, and that answer is worth taking.
Everything Agrees at 50
Here is a hypothetical with round numbers. A stock trades at 50. The cloud below spans from 45 to 47, with Senkou A at 47 and Senkou B at 45.
Reading one, bias: price at 50 sits above the cloud, so the bias is bullish. The top of the cloud at 47 is the first support; the bottom at 45 is the line where the bullish case is genuinely in trouble.
Reading two, momentum: the Tenkan sits at 49, the Kijun at 48. The fast line above the slow line, both below price. Short-term momentum agrees with the bullish bias.
Reading three, the future: the forward cloud shows Senkou A at 47 crossing above Senkou B at 45, a bullish twist forming ahead of price. Tomorrow's projected support is strengthening.
Reading four, confirmation: the Chikou span, today's close plotted 26 bars back, sits clearly above the price action of that period. Nothing behind blocks the move.
Four readings, one story. That is what the system looks like when it works: not a signal, but an aligned set of conditions.
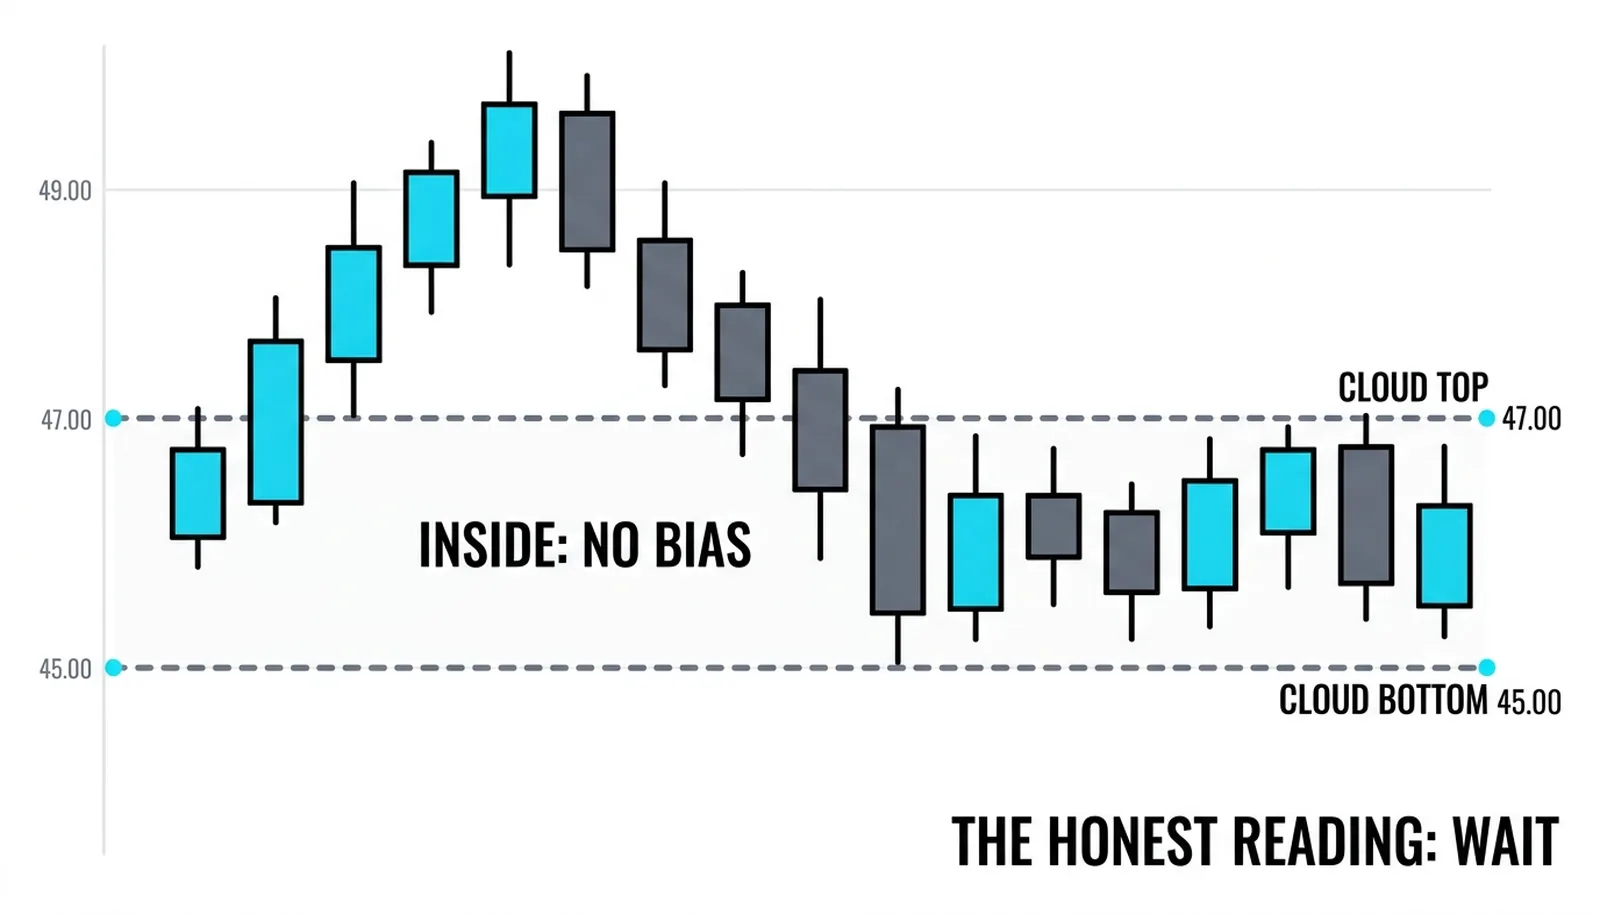
Now the disagreement case. Same stock, but price is 46, sitting inside the cloud between 45 and 47. The Tenkan and Kijun are flat and tangled near 46. The Chikou is buried in old candles. The honest reading is wait. Price inside the cloud means the market has not decided, and Ichimoku's discipline is to refuse a trade until it has. Most losses with this system come from ignoring that refusal.
| Part | What it is | Its job |
|---|---|---|
| Tenkan-sen | 9-period midpoint of high and low | Fast momentum and short-term equilibrium |
| Kijun-sen | 26-period midpoint of high and low | Slower balance point, trend gauge, magnet for pullbacks |
| Senkou Span A | Average of Tenkan and Kijun, plotted 26 ahead | Fast edge of the future cloud |
| Senkou Span B | 52-period midpoint, plotted 26 ahead | Slow edge of the future cloud, the deeper support or resistance |
| Chikou Span | Close plotted 26 periods back | Confirmation against past price action |
The Ichimoku Cloud, Answered
What does the Ichimoku cloud actually represent?
It represents equilibrium projected forward. Each span is a midpoint of past price action shifted 26 periods ahead, so the shaded zone between them is where the market's recent balance points suggest future support or resistance should sit.
Why are Ichimoku settings 9, 26, and 52?
They come from the Japanese trading week of Hosoda's time: 9 was roughly a week and a half of trading days, 26 a month, and 52 two months. They survived because decades of traders found the relationships useful, not because the numbers are magic.
Is the Ichimoku cloud leading or lagging?
Both, depending on the part. Every line is calculated from past prices, so the inputs are lagging. But the Senkou spans are plotted 26 periods into the future, which makes the cloud the rare tool that draws its support and resistance zones before price arrives.
Can beginners use Ichimoku?
Yes, if they learn it as a system rather than a signal. Start with one rule, price relative to the cloud, and refuse trades when price is inside it. Add the Tenkan-Kijun read and the Chikou check once the cloud habit is solid. The worst way to start is trading every line cross.
The next lesson in this level takes the five parts apart one by one: the exact formulas, the midpoint math, and what happens to each line when you change the 9, 26, and 52 settings.