Timeframe Confluence — Where Signals Stack
Timeframe confluence is the moment when several independent reasons, a level, a trend, a signal, all agree on the same price zone. Zones like that deserve your attention because more of the market has a reason to act there. One spotlight on a stage is ambient light, but three spotlights pointing at the same spot make it the place everyone looks.

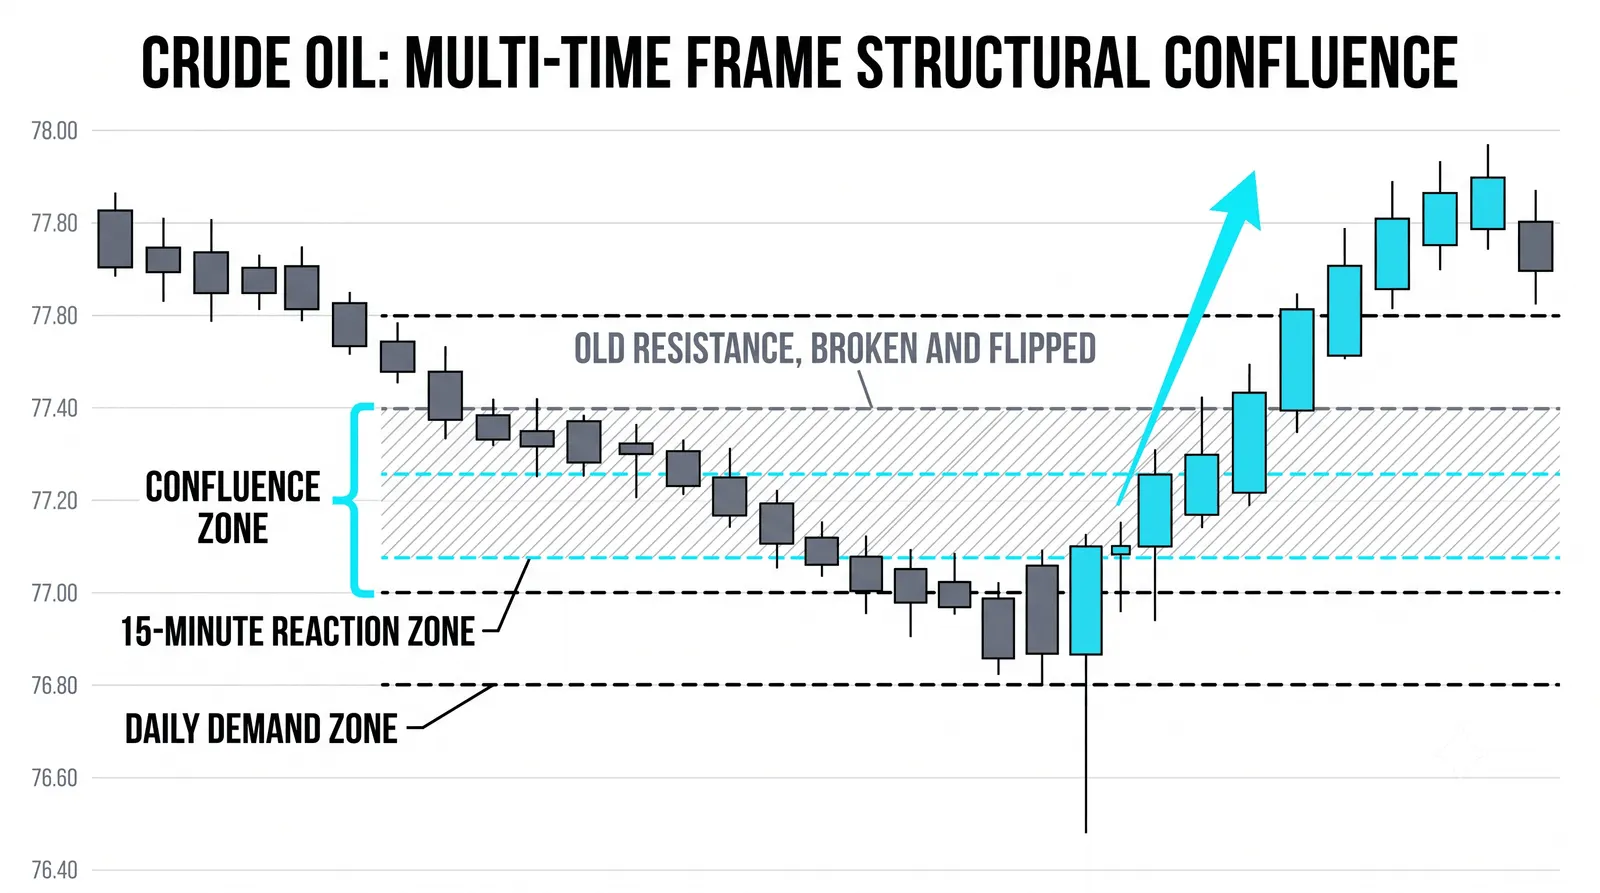
This lesson is about the general principle. A sibling post already covered stacking support and resistance levels across timeframes, so we will not re-teach that. Here you will learn what genuinely counts as confluence, what only looks like it, and how to use the idea without fooling yourself.
What Actually Counts as Confluence
Confluence means independent signals agreeing on the same area. Independent is the load-bearing word in that sentence.
A classic stack looks like this. The daily chart shows a support level that has held multiple times. The weekly chart shows the trend pointing up, so buying at support aligns with the bigger move. Then the 4-hour chart prints a reversal signal right at that level. Three different lenses, three different reasons, one price zone.
Each reason comes from a different source of market logic. The level exists because buyers defended it before. The trend exists because larger participants have been net buyers for weeks. The intraday signal exists because sellers just failed to push lower in real time. None of these reasons depends on the others.
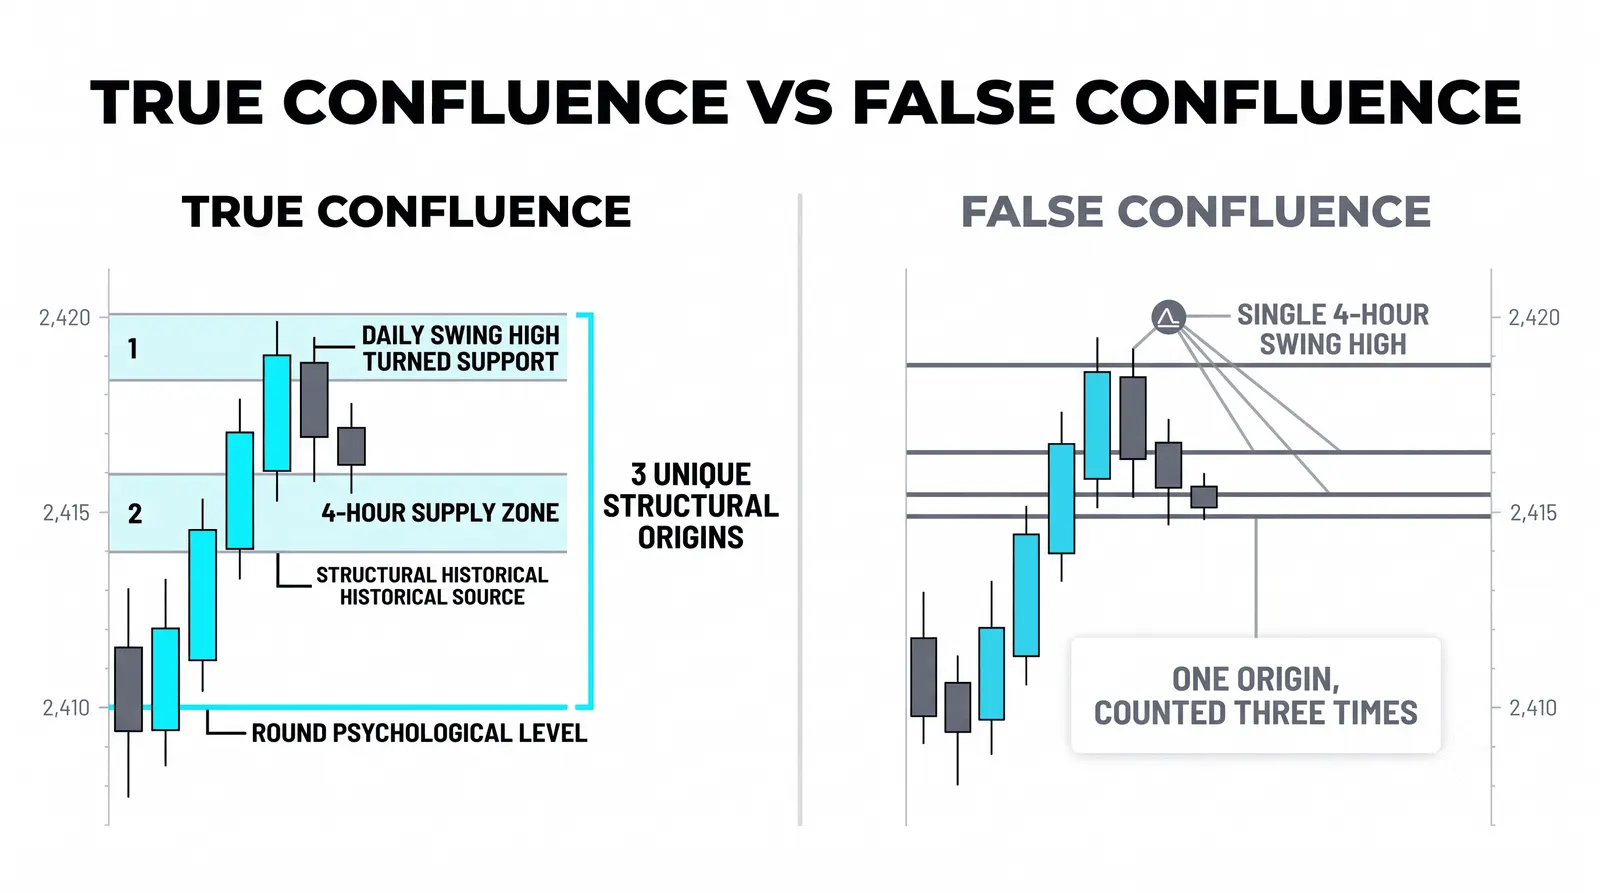
That independence is the test. Three levels drawn the same way is one reason written three times. If you draw a horizontal line, a moving average that happens to sit on it, and a Fibonacci level that also lands there, you may have genuine agreement, or you may have three tools all measuring the same prior low. Ask yourself whether each reason would still exist if the others disappeared.
What Confluence Is Not
Confluence is not ten variations of the same indicator agreeing. If your RSI, your stochastic, and your momentum oscillator all say "oversold," you have one opinion rendered in three colors. Those tools are built from the same price data and will usually agree with each other by construction.
It is also not one pattern counted on four timeframes. A bullish engulfing candle on the 1-hour chart will often appear as part of a bullish candle on the 4-hour and a long lower wick on the daily. That is the same event viewed at different resolutions, not three events.
Stacking copies of one opinion inflates confidence, not odds. This is the trap. The chart starts to look overwhelming, the setup feels undeniable, and position size creeps up. Meanwhile the actual evidence never grew past the first signal.
A quick self-check: could each of your reasons fail on its own while the others survive? If one piece of price action would invalidate all of them at once, they were never separate reasons.
Why Confluence Zones Change Behavior
More participants have reasons to act at the same price, and that is what makes reactions there cleaner. The swing trader watching the daily level, the position trader following the weekly trend, and the intraday trader reading the 4-hour signal rarely talk to each other. But their orders land in the same place.
That clustering matters because markets move on orders, not opinions. A zone where three groups all want to buy tends to produce a sharper, more decisive response than a level only one group cares about.
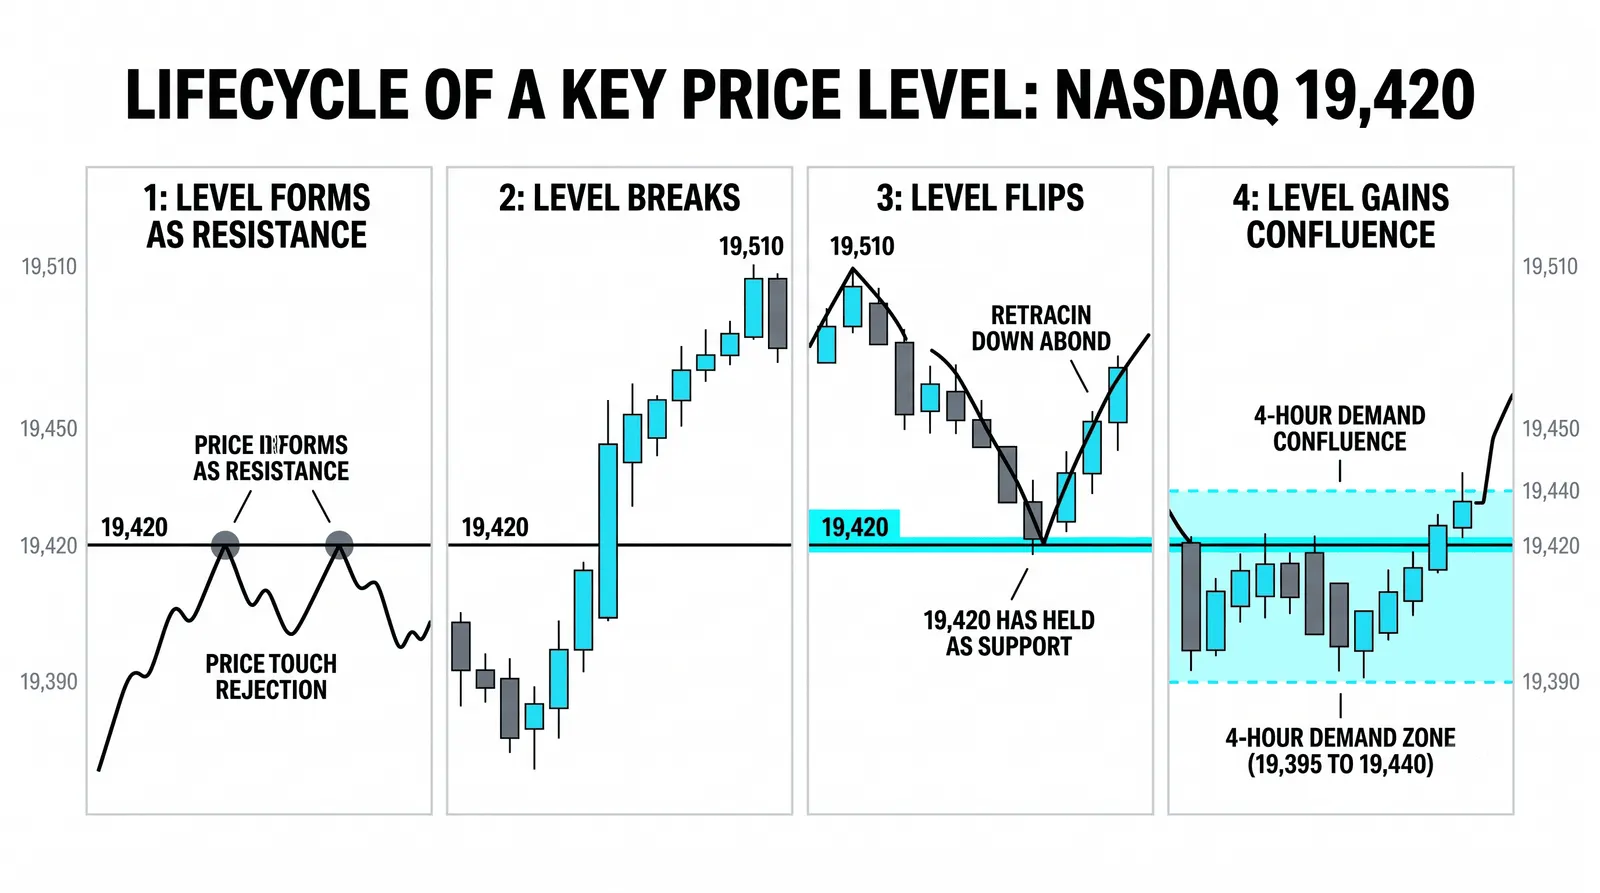
The zone also defines your stop logically. The trade idea is wrong only when all the reasons are gone. If price breaks below the level, breaks the trendline, and the reversal signal fails, the idea is dead and there is nothing left to defend. Your stop belongs just beyond the point where the last reason dies.
This gives you something most trades lack: a clear line between "the setup is working" and "the setup is over." No guessing, no moving the stop because you feel hopeful.
The Honest Limits
Confluence raises the quality of the setup, never the certainty of the outcome. A three-reason zone can fail, and sometimes it fails immediately and violently.
Zones fail like everything else in markets. News hits, a larger player unwinds, the level simply gets overrun. No stack of reasons changes that. What confluence changes is the ratio: over a long series of trades, well-built zones should hold more often than random entries. That is an edge, not a promise.
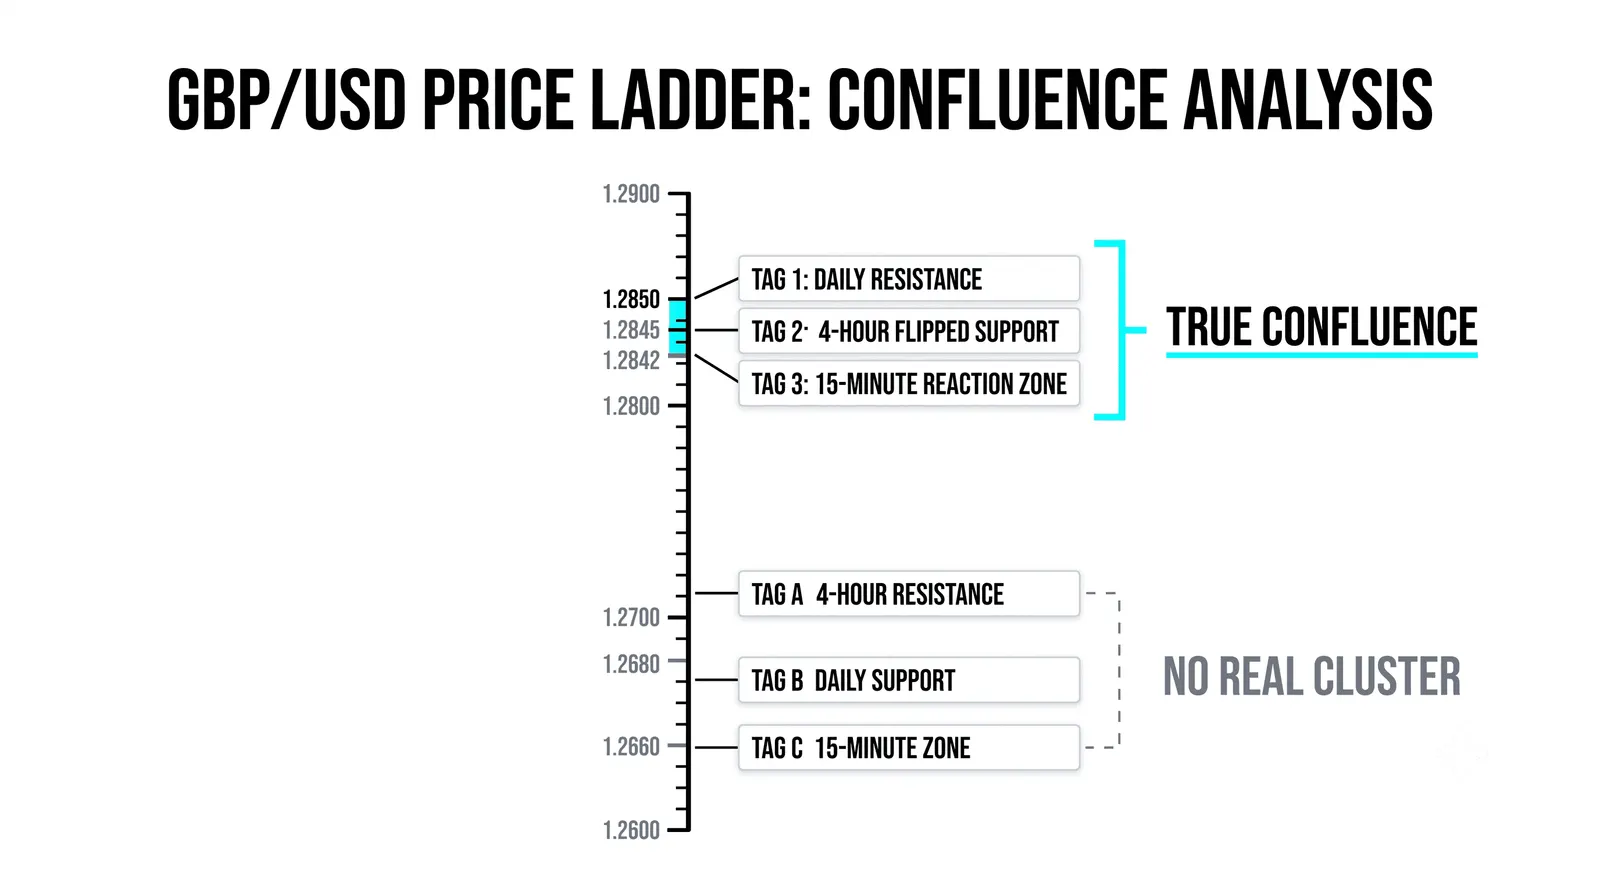
The failure itself is information. When a strong confluence zone breaks cleanly, the market is telling you something overpowered three independent reasons. That often marks a real shift, and the broken zone frequently flips into resistance or support on the other side. Traders who treat failures as data get more from confluence than traders who treat them as betrayals.
So size every trade as if the zone can fail, because it can. The edge lives in repetition across many setups, not in any single one.
Three Reasons at 88
Here is a hypothetical walkthrough with round numbers. Nothing here is a recommendation; it is an illustration of the logic.
The daily chart shows support at 88, with three prior touches where buyers stepped in. The weekly chart shows a rising trendline drawn from the major lows, and that line currently arrives between 87.50 and 88.50. Then the 4-hour chart prints a bullish reversal signal at 88.40, right inside the overlap.
Three independent reasons, one zone. The level comes from historical defense, the trendline from the higher-timeframe structure, and the signal from current intraday behavior. Remove any one of them and the other two still stand on their own.
The trade logic follows directly. Interest in longs lives inside the zone, roughly 87.50 to 88.50. The stop sits at 86.90, below all three reasons, because below that price the level is broken, the trendline is broken, and the reversal signal has failed. The first target is the recent high at 92.
From an entry near 88.40, the risk is about 1.50 and the first target offers about 3.60. That is a reasonable reward-to-risk built entirely from the structure, not from hope.
Now contrast that with a single unconfirmed signal at 92, mid-range. Say the 4-hour chart prints a bullish signal up there with no level, no trendline, nothing but the candle itself. The signal might work. But where does the stop go? There is no structure to hide behind, so the stop is arbitrary, and the target above is unclear. You are trading one opinion with no defined invalidation.
The 88 trade has a reason, a boundary, and a target. The 92 trade has a candle. Same market, same week, completely different quality of idea.
| Element | What It Is | Why It Counts or Does Not | What It Adds to the Zone |
|---|---|---|---|
| Daily support at 88 | A level with three prior touches | Counts: based on historical buying, independent of the other reasons | Anchors the zone and marks where buyers defended before |
| Weekly trendline at 87.50–88.50 | Rising line from the major swing lows | Counts: built from higher-timeframe structure, not from the level | Aligns the trade with the dominant direction and widens the zone slightly |
| 4-hour reversal signal at 88.40 | A bullish candle pattern inside the zone | Counts: reflects current order flow, a timing tool rather than a level | Provides the entry trigger and tightens the timing |
| RSI, stochastic, and momentum all "oversold" | Three oscillators derived from the same price data | Does not count: one opinion in three forms, they fail together | Adds confidence but no new evidence; ignore as a separate reason |
Common Questions About Confluence
How many signals make real confluence?
Two independent reasons are enough to call it confluence, and three is the practical sweet spot. Beyond three, you are usually adding copies or waiting so long that the move leaves without you. Quality of independence beats quantity of checkmarks every time.
Does confluence work on lower timeframes?
Yes, the principle works on any timeframe, but the zones get noisier as you go down. A 5-minute level with a 15-minute signal will produce more false reactions than a daily-weekly stack, because fewer meaningful participants care about small-timeframe prices. The logic is identical; the reliability scales with the size of the players involved.
What if the signals appear a few days apart?
That is normal, and often it is the best version. Levels and trendlines exist in advance, and the intraday signal usually arrives last as the trigger. What you want is the reasons to still be valid when the final one appears. If the level broke two days before your signal printed, the stack no longer exists.
Should I wait for confluence on every trade?
No, but you should know which trades have it and which do not. Plenty of valid strategies trade single signals with defined risk. The point of this lesson is to stop mistaking stacked copies for stacked reasons, and to recognize the high-quality zones when they appear. When they do, those are the trades that deserve your full attention and your cleanest execution.
From here, the natural next step is practicing the independence test on your own charts. Pull up past setups, list each reason you had, and ask which ones would have survived on their own. That habit, repeated weekly, will sharpen your zone selection faster than any new indicator. The sibling lesson on multi-timeframe support and resistance stacking pairs directly with this one if you want to go deeper on the level side.