The Bat: Structure and Trading Rules
The bat pattern is a five-point retracement structure whose pullback never exceeds the halfway mark of the first swing and whose final point lands on the 88.6 percent line. It belongs to the harmonic family that harmonic trading doctrine formalized, and it is the most conservative of the group: the deepest possible entry inside the original swing, the tightest invalidation, the most demanding measurements. When the ratios hold, the pattern offers a defined location, a defined stop, and a defined reason to act.

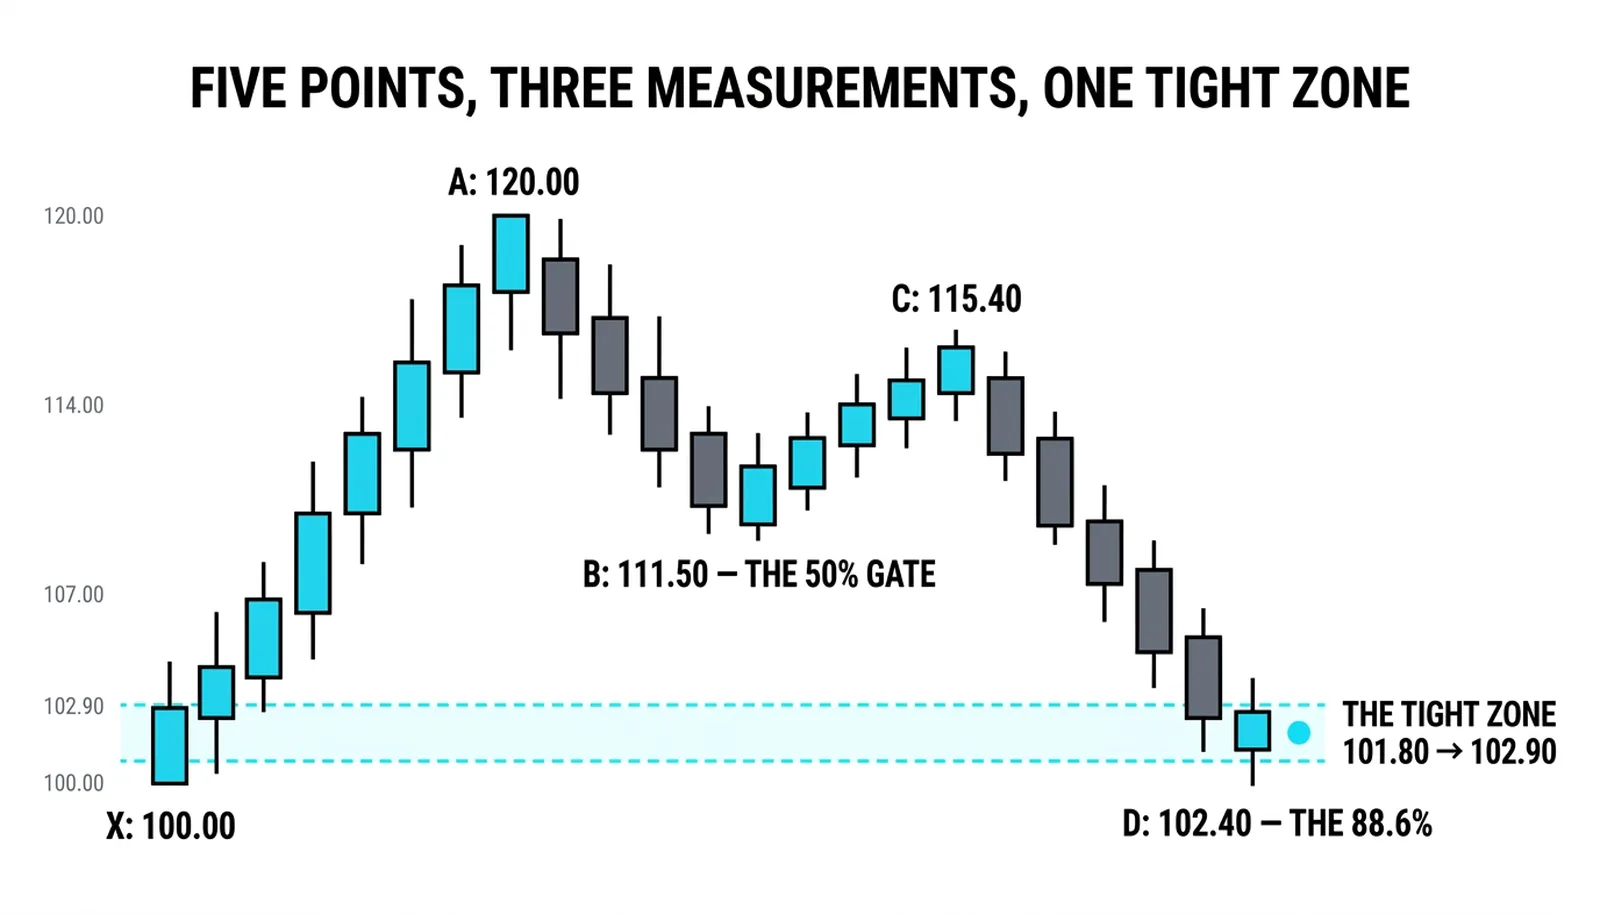
Think of a piston and its cylinder machined to the same tolerance: the replacement part drops straight in without filing, because the measurement was never left approximate. The bat works the same way. Each of its five points has a ratio that either fits or does not, and a drawing that nearly fits is a drawing that does not exist. Where the earlier retracement lessons marked single lines and the confluence lessons stacked several levels at one price, this lesson reads a whole swing sequence as the cluster: five points, three measurements, one zone.
The Three Measurements
The points run X, A, B, C, D in order. The first swing, X to A, sets the leg everything else is measured against. Nothing about the pattern exists until that leg is complete and the pullback begins.
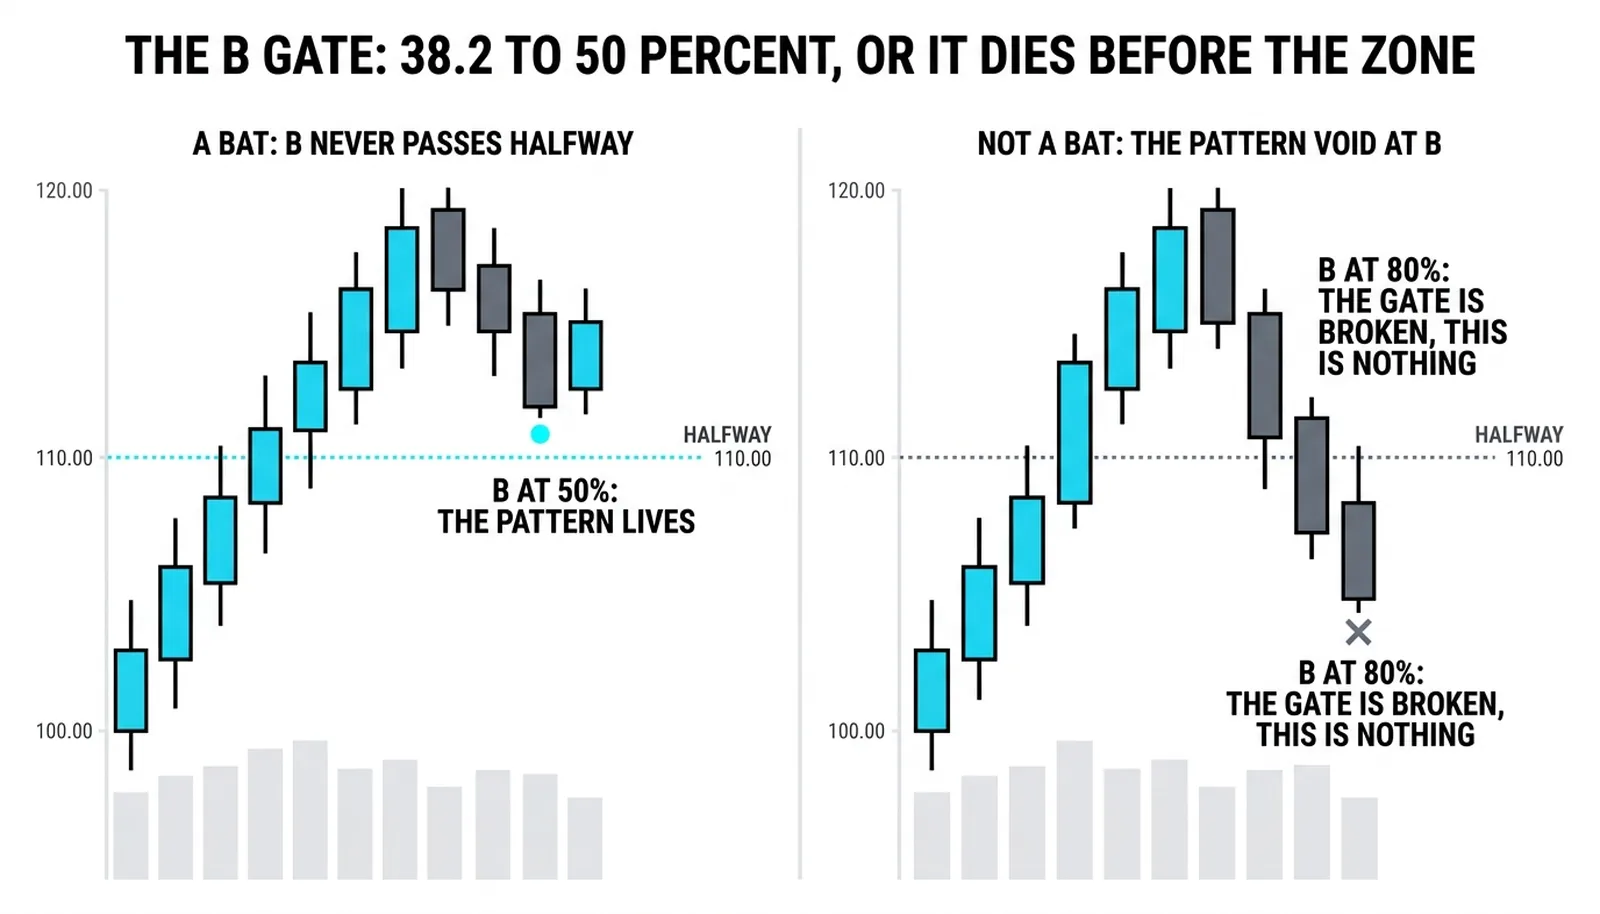
The pullback to B is the gate. It must retrace between 38.2 and 50 percent of the XA leg. A B that stops at 30 percent is too shallow and the structure is something else. A B that runs to 61.8 percent has already broken the rule, and the pattern is void before the rest is drawn. This gate is what separates the bat from its relatives, and it is the first check, not the last.
The rally off B produces C, which retraces part of the AB leg. The common reading is near 61.8 percent of AB, though the method tolerates a band roughly between 38.2 and 88.6 percent. C is the loosest point in the structure. Treat it as context, not as a gate.
The decline from C to D is the destination. D must land on the 88.6 percent retracement of the entire XA swing. This is the ratio harmonic trading doctrine added to the harmonic method, the square root of 78.6 percent, and it is the line that gives the bat its precision. A D that stops at 78.6 percent is a different pattern with different rules. A D that blows past 88.6 without pausing is a failed pattern.
Around D the cluster completes. Two more measurements land in the same few prices:
- An AB equals CD relationship, where the CD leg matches the AB leg in size, give or take a small tolerance.
- A projection of the BC leg, extended between 1.618 and 2.0 from the C point.
When the 88.6 percent retracement, the AB equals CD completion, and the BC projection all fall inside a narrow band of prices, that band is the potential reversal zone. The cluster method is built entirely on this kind of price clustering, where several Fibonacci relationships converging at one area carry more weight than any single line. The bat is that idea expressed as a fixed sequence.
The honesty comes last. The pattern's promise is a location, nothing more. The location is only as good as the rule that ends it: a close beyond the zone voids the whole drawing. Traders who skip that rule own a sketch, not a setup.
Trading the Zone
The entry lives inside the potential reversal zone, not at the first touch of the 88.6 line. Price reaching the line is an alert, not a trigger. The trigger is evidence that the decline is stalling at the zone: a reversal candle closing back inside the band, a rejection tail through the line, a shift in the short-term structure on the timeframe below.
The stop belongs beyond the point where the pattern is proven wrong. For a bullish bat, that is below the zone's lower edge, past the price where a close voids the XA-based logic entirely. A stop inside the zone will be clipped by the same noise the zone was built to absorb. A stop far below the zone wastes the precision the pattern earned.
Targets are taken off the A-to-D leg. The standard first target is the 38.2 percent retracement of that leg, with the 61.8 percent retrace as the stretch objective. Some traders scale out at the first and trail the rest. Both are defensible. What is not defensible is holding for the full recovery of A on every trade, because most completions never get there.
The location and the promise are different things. The bat can be right about where price should turn and still lose, because the market owes the ratios nothing. The edge is that a correct location with a tight invalidation produces small losses and large winners over a series of trades. One trade proves nothing.
Position size follows from the stop distance, never from confidence in the drawing. The risk per trade is fixed in advance, the stop distance is measured from entry to the void point, and the size is whatever makes those two agree. The pattern supplies the geometry. The trader supplies the discipline.
The Zone at 102.28
A hypothetical bullish bat, all numbers invented and round for illustration. The swing runs from 100.00 at X to 120.00 at A, a twenty-point leg. The pullback to B lands at 110.00, exactly the 50 percent retracement of XA, inside the gate. The rally to C reaches 116.18, a 61.8 percent retrace of the AB leg. The decline to D terminates at 102.28, the 88.6 percent retracement of the whole XA swing.
Around 102.28 the supporting measurements stack up. The AB leg is ten points; a CD leg of similar size from 116.18 projects near 106.18 on a strict equality, and the alternate 1.27 extension of AB lands closer to the zone. The BC leg projection between 1.618 and 2.0 also terminates in the low 102 area. Three measurements, one small band of prices. That band is the zone.
| Point | Leg It Ends | Defining Ratio | Example Price |
|---|---|---|---|
| X | Start of the structure | Origin of the XA leg | 100.00 |
| A | XA | The measured swing itself | 120.00 |
| B | AB | 38.2 to 50 percent retrace of XA | 110.00 |
| C | BC | Roughly 61.8 percent retrace of AB | 116.18 |
| D | CD | 88.6 percent retrace of XA | 102.28 |
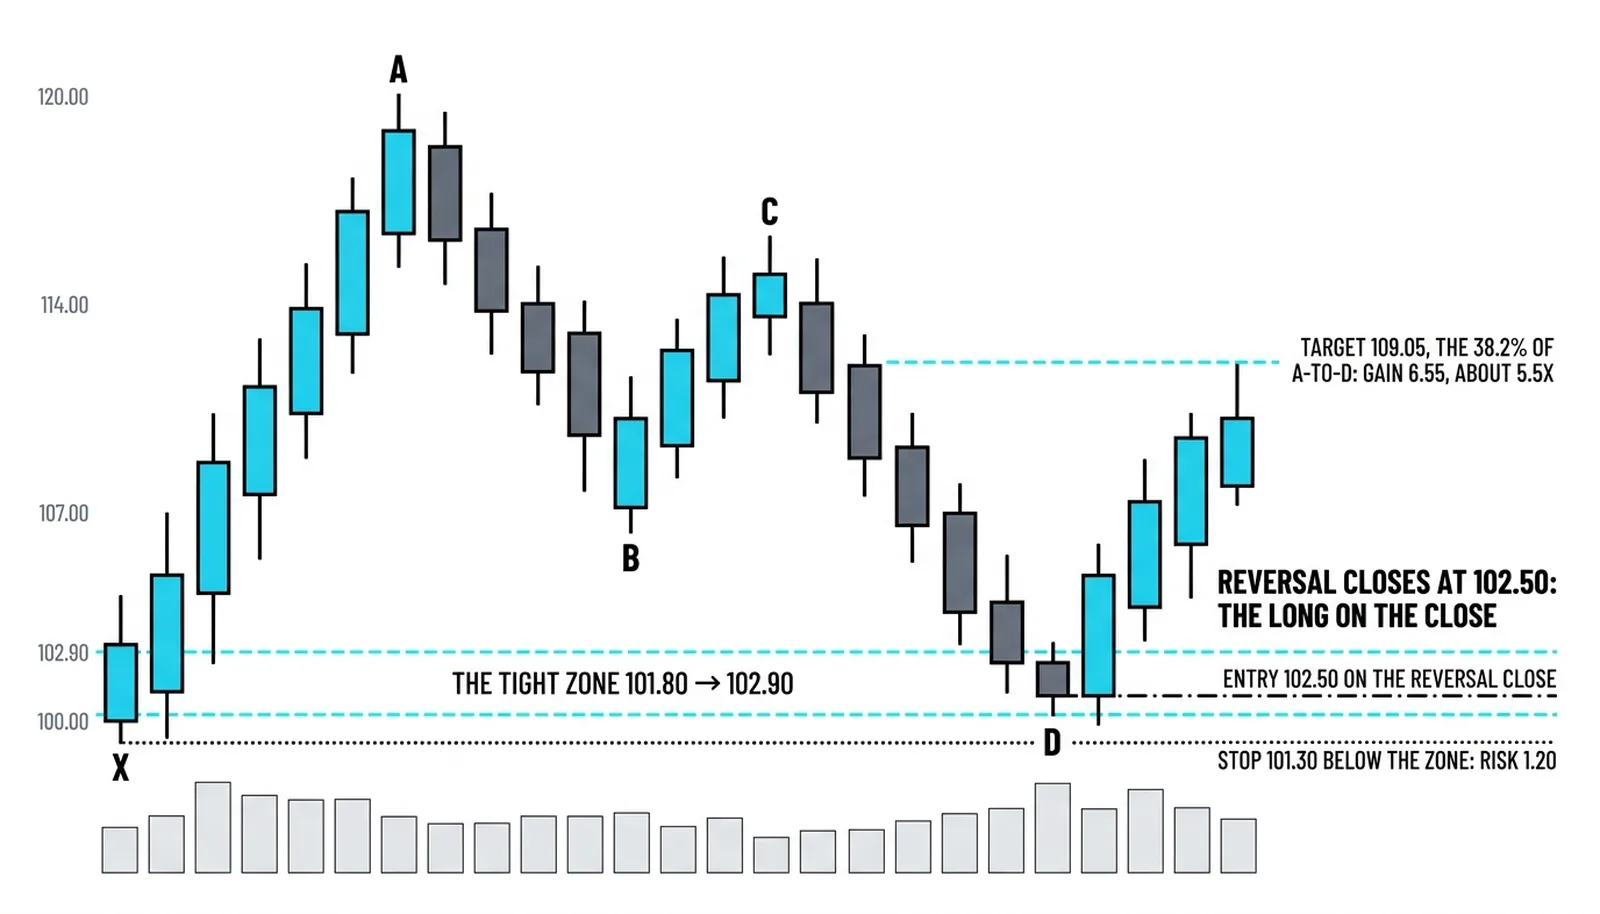
Price trades down into the zone and prints a reversal candle that closes at 102.50. The long is taken at 102.50. The stop sits at 101.30, below the zone's lower edge, risking 1.20 per unit. The first target is the 38.2 percent retrace of the A-to-D leg: the leg is 17.72 points, 38.2 percent of that is 6.77, and 102.28 plus 6.77 gives 109.05. The gain from entry to target is 6.55 against a risk of 1.20, about 5.5 times the risk.
That reward-to-risk is the reason the pattern is worth the measuring effort. A trader who wins this trade one time in three and loses the other two still comes out ahead, because each loss costs 1.20 and each win returns 6.55.
Now the failed version. Price closes at 101.00, below the zone. The pattern is void in one candle. The trader who took the long at 102.50 is out at 101.30 for the planned 1.20 loss, and the market falling further is no longer their problem. The trader who moved the stop lower because the ratios "should" hold owns a much larger loss on the same drawing.
The pattern that is right about the location and wrong about the stop is a full loss either way. The zone's edge decides, not the trader's conviction.
Bat Questions, Answered
What is the bat pattern?
The bat pattern is a five-point harmonic structure, X-A-B-C-D, defined by a shallow B-point retracement of 38.2 to 50 percent and a D point at the 88.6 percent retracement of the XA leg. It marks a potential reversal zone where the final leg of a pullback is expected to exhaust, and it comes with a built-in invalidation level just beyond that zone.
What makes the bat different from the gartley?
The difference is depth. The gartley requires a B point near 61.8 percent of XA and completes its D at the 78.6 percent retracement. The bat demands a shallower B, capped at 50 percent, and a deeper D at 88.6 percent. The bat trades later, closer to the X low, with a tighter stop and typically a larger reward-to-risk. Confusing the two usually means a B point was measured loosely.
Why is the 88.6 percent line important?
The 88.6 percent retracement is the ratio that defines the bat's completion point, introduced by harmonic trading doctrine as the square root of the 78.6 percent level. It sits deep enough inside the original swing that a reversal from it traps the maximum number of late sellers, while a break beyond it leaves almost no structural support before the X low itself. That combination makes it both the entry anchor and the natural boundary for the stop.
What is the win rate of the bat pattern?
No fixed win rate exists, because results depend on the market, the timeframe, the entry trigger, and how targets are managed. Published trader experience generally puts harmonic completion trades in the range of roughly half winning when taken mechanically, with the profitability coming from reward-to-risk ratios of three to one or better rather than from accuracy. A pattern that wins 40 percent of the time at five-to-one beats a pattern that wins 70 percent of the time at one-to-one. Judge the bat on the math of a full series, never on the outcome of the next trade.
Next in the harmonic sequence: the butterfly, where the D point stops obeying the XA swing entirely and extends past it, and where the trade flips from deep retracement to terminal extension.