The P-Shape Profile: Reading a Bullish Day
The P-shaped profile is a bullish session shape with a fat volume base at the bottom of the day's range and a thin tail stretching up top. It is the signature of a day that bought early and decisively, pushed away from value, and found no acceptance above. On its face, it is the bullish day type in the profile tradition, and it is the first of the classic day-type shapes this level covers.

Picture a grain silo filling from the bottom: the wide settled weight of the day's business stacked low, and only a thin column of late arrivals standing above it. That image is the shape in one line. Most of the day's contracts changed hands down low, early, and in size. The upper stretch of the range exists, but it is narrow, lightly traded, and unpopulated. The letter P is not a metaphor someone invented for marketing. It is what the volume distribution literally looks like when you rotate the day's profile on its side.
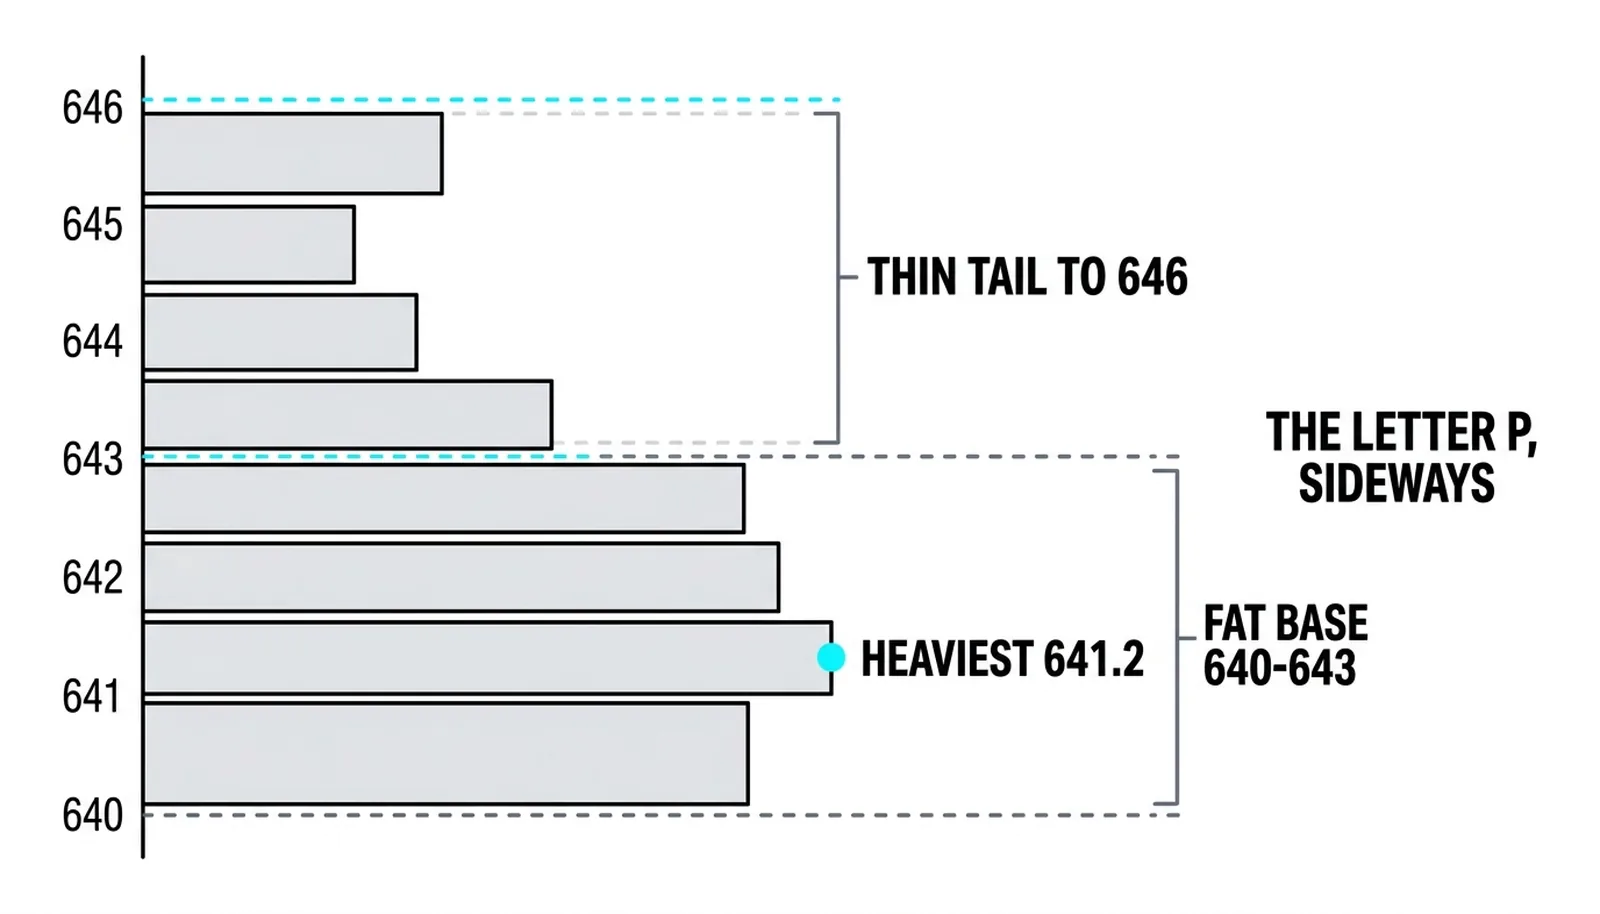
The preceding lessons in this block own the profile windows and the fixed-versus-anchored ranges, so this one does not re-teach them. What you need here is one idea carried forward: the value area is the fat part of the letter, the zone where roughly seventy percent of the day's business printed. Everything else in this lesson is about what it means when that fat part sits at the bottom of the range instead of the middle.
The Anatomy of the P
The P has two parts, and each part proves something different. The fat base is the value area, sitting low in the day's range. It proves that buyers and sellers did heavy, two-sided business down there and agreed on price. High volume means acceptance. The market spent time at those levels because both sides were willing to trade there in size.
The thin tail is the upper stretch of the letter, a column of prices where volume thins out to almost nothing. It proves the opposite of acceptance. Price traveled up there, found few willing participants, and left. A thin tail is a probe that never got accepted. The market tested higher ground, and the auction above the base had no depth to it.
Read the two parts together and the shape tells one story: heavy acceptance low, rejection high. The day's center of gravity sits at the bottom of its own range, and everything above that base is territory the market visited but refused to settle. That asymmetry is what makes the P a shape worth naming at all, rather than just another distribution.
What the Shape Says About the Auction
The auction story behind a P runs in two acts. Act one is initiative buying. Early in the session, buyers stepped in and bought aggressively, before the crowd arrived. Initiative activity is the kind that moves price away from value, and it is what built the fat base and then pushed price up off it. Someone with size wanted in, and they wanted in early.
Act two is the rejection above. Once price lifted away from the base, the sellers never showed up to contest the move. No responsive selling arrived to push price back into the base and fill the upper range with two-sided trade. The tail stayed thin because there was no argument up there. The day the sellers stayed home is the day the tail stays empty.
That combination is why the tradition classifies the P as bullish. Initiative buying below, an uncontested lift, and no acceptance above means the market tried to go higher and met no resistance worth the name. The classic accumulation and distribution framework holds that the cause built at one level pays out in the effect at the next, and a P-shape is that logic drawn in one session: the cause is the fat base, the effect is the lift.
The tail top itself becomes a marked level. It is the day's rejection zone, the highest price the probe reached before the market lost interest. On following sessions, that level is a reference: price accepted above it extends the bullish story, and price rejected at it again tells you the ceiling is real.
Trading the P and the Short-Covering Trap
The trade logic follows the anatomy. Pullbacks into the fat base on quiet volume are the shape's own buy zone. You are buying back into the area where the day's business was accepted, at prices the market already validated in size, with the thin tail above you as open air. The thin tail is where fading trades live, but only conditionally: if the next day opens below the tail and cannot reclaim it, shorting the rejection zone has the shape's logic behind it.
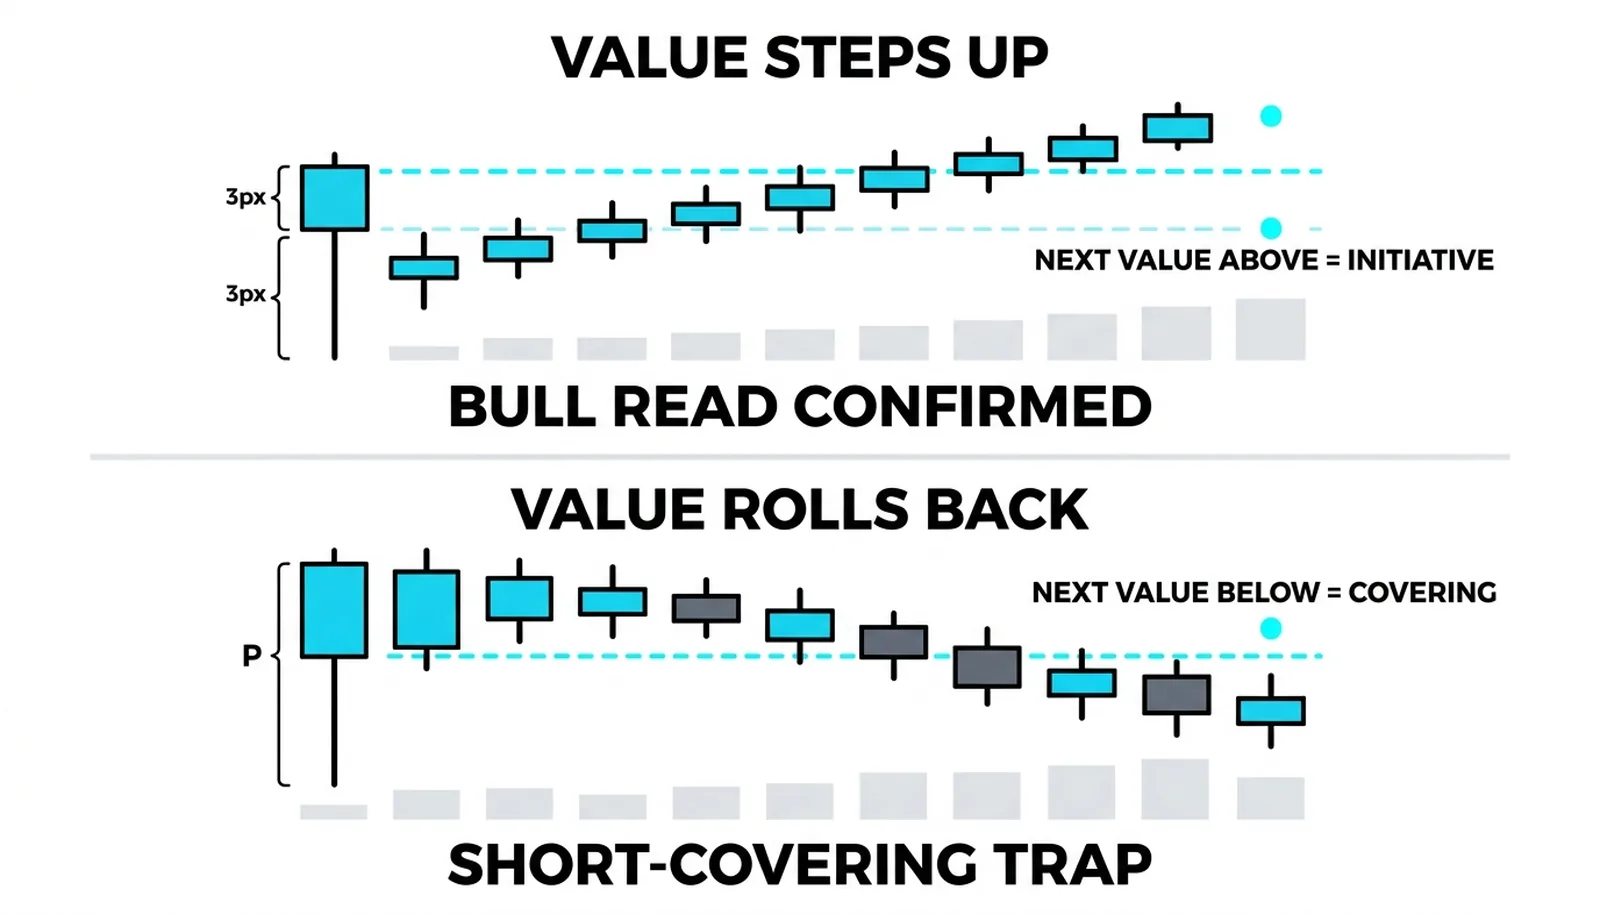
Now the first honesty beat, and it comes from the tradition's own author. Market profile theory cautions that a P-shape can be a short-covering rally rather than new initiative buying. Traders forced out of short positions buy back in, and that forced buying prints the exact same shape: a fat base, a sharp lift, a thin tail. The letter looks identical. The fuel behind it is completely different. Short covering is old business closing out, not new money entering, and it has no reason to continue once the shorts are flat.
The tell is what happens next. If value migrates up behind the shape on the following days, meaning the next session's value area forms higher than the P's base, the bull read is confirmed. New business is being accepted at higher prices, which only happens with genuine buying interest. If the P sits alone and price rolls over back through the base, it was covering, not buying. The shape proposes; the next session disposes.
The second honesty beat is about timing. The shape is read at the close, not during the day. Mid-session, every developing profile looks like it might become anything. A morning lift always sketches the outline of a P until the afternoon either fills in the upper range or leaves it thin. Guessing a P before the tail exists is reading tea leaves. Wait for the session to finish writing the letter.
One P, Scored
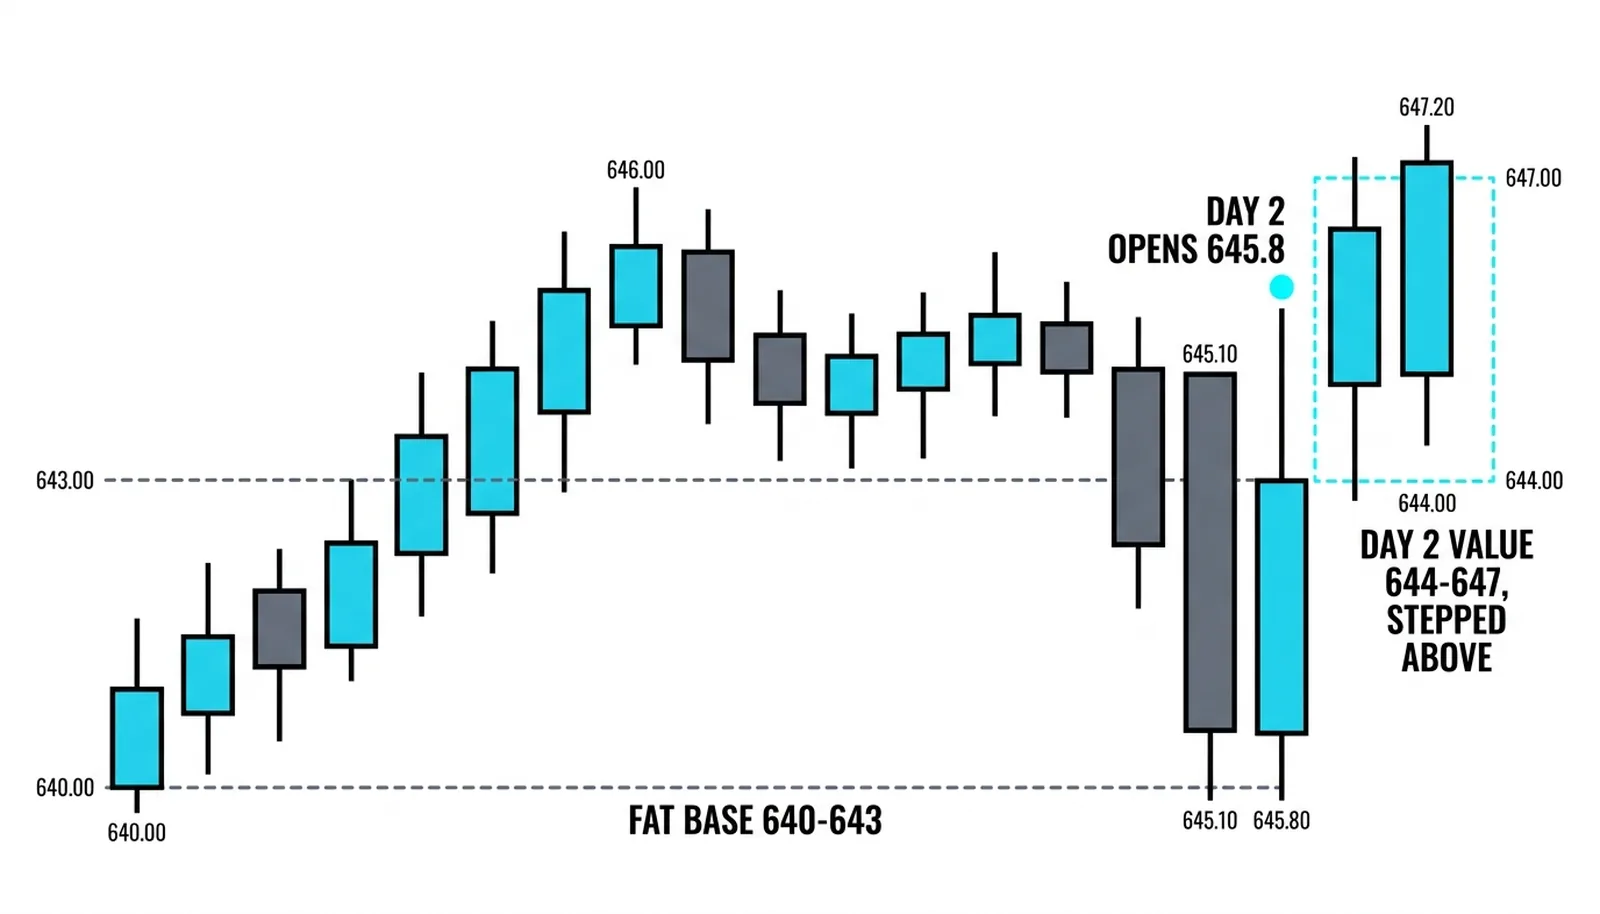
All numbers here are invented and round, purely for illustration. A stock opens at 640. Initiative buying drives it to 646 by midday. The afternoon never leaves a band between 643 and 645.5. When the session closes, the profile shows seventy percent of the day's volume between 640 and 643, with the heaviest single bin at 641.2, and a thin tail of light volume stretching up to 646. The close prints at 645.1, sitting inside the tail.
That is a textbook P. The base at 640 to 643 is the fat letter body, the tail from 643 to 646 is the probe that found no acceptance, and the close in the tail says the market ended the day still holding the lifted ground. The read at the close: bullish shape, unconfirmed.
| Session stage | Price | Volume behavior | The read |
|---|---|---|---|
| Morning drive | 640 to 646 | Heavy trade to 643, thinning above | Initiative buying; base forming low |
| Afternoon | 643 to 645.5 | Light, two-sided drift | No sellers contesting; tail stays thin |
| Close | 645.1 | Seventy percent of volume below 643 | P-shape confirmed at the close |
| Next day | 645.8 open; 643.5 to 647.2 range | Value area forms 644 to 647 | Value stepped above the base; bull read confirmed |
Now walk the trade logic. The next day opens at 645.8, inside the prior tail. An early dip toward 643 tests the top of the old base and holds at 643.5. That is the pullback-into-the-base buy zone doing its job: quiet volume on the dip, acceptance below, buyers defending the area the shape marked as fair. A trader who faded the tail top at the open, expecting the P to be short covering, got stopped as price reclaimed 646 and pushed to 647.2. The tail-top fade failed because the follow-through evidence never supported it.
The deciding fact is the new value area at 644 to 647, stepped fully above the prior day's 640 to 643 base. Value migrating up is the market profile's confirmation. The market did not roll back into the old base and expose the P as covering. It built fresh acceptance at higher prices, which is what genuine initiative buying produces. The shape alone could not prove that. The next session could.
P-Shape Profile, Answered
What is a P-shaped profile in trading?
It is a daily volume profile with a fat volume base low in the range and a thin, lightly traded tail above it, so the distribution drawn sideways resembles the letter P. The fat base is the value area, and the thin tail is a probe higher that never gained acceptance.
What does a P-shaped profile mean?
It means initiative buyers acted early and decisively, price lifted away from the accepted value zone, and sellers never arrived to contest the higher ground. The auction accepted prices low and rejected them high, which is the bullish day type in the profile tradition.
Is a P-shaped profile always bullish?
No. Market profile theory warns that the same shape can be printed by short covering, where forced buy-backs lift price without any fresh long money behind the move. The confirmation test is whether value migrates higher on following days; a P that sits alone and rolls over was covering, not buying.
How do you trade a P-shaped day?
Buy pullbacks into the fat base on quiet volume, since that is the zone the market already accepted in size, and treat the tail top as a rejection level to fade only if the next session opens below it and fails to reclaim it. Read the shape at the close, then let the next day's value placement confirm or cancel the bull read before sizing up.
The P is only half of the classic pair. The next lesson mirrors it: the B-shaped profile, where the fat base sits at the top of the range, the thin tail hangs below, and the day's story runs in the opposite direction.