The B-Shape Profile: Reading a Bearish Day
The B-shaped profile is the bearish day type in the profile tradition: a session where the fat base of volume sits at the top of the range and a thin tail of trades hangs below, the signature of a day that sold early, pushed away from value, and found no acceptance underneath. It is the mirror image of the P-shape from the previous lesson. Same anatomy, flipped vertically. Where the P showed buyers building a base low and probing higher, the B shows sellers doing the building high and a probe lower that nobody defended.

Think of a reservoir draining through its spillway: the deep settled weight of the day's business sits high, and only a thin stream of late trades dribbles out the bottom. That image carries the whole read. The crowd did its business up top. The bottom of the day was an afterthought.
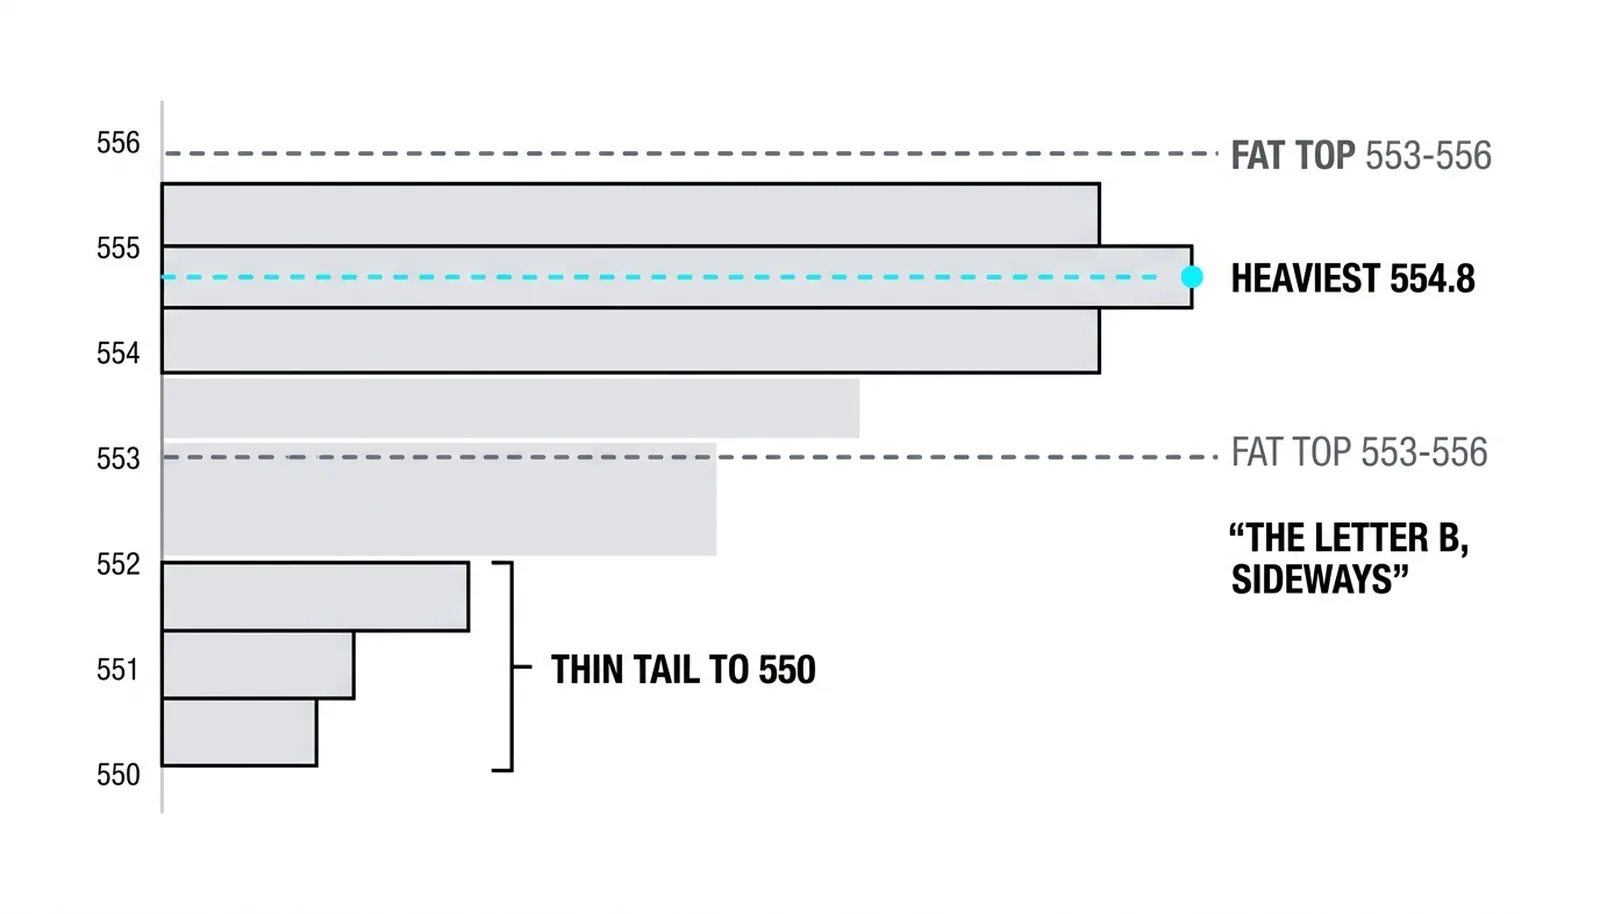
The Anatomy of the B
The previous lesson on the P-shape covered the shared mechanics: a fat base where most volume transacted, a thin tail where price traveled fast on light trade, and a value area nested inside the fat part. None of that changes here. Only the orientation does.
In a B-shape, the fat top is the value area. Roughly seventy percent of the session's volume prints in the upper portion of the range, usually in the early part of the day. That is where buyers and sellers agreed to do business before the selling took over.
The thin lower tail is the probe that never got accepted. Price dropped below the established value zone, traded briefly on light volume, and closed down there or near it. The tail is not a new base. It is a rejection zone, a stretch of prices where the market found nothing to do.
The day's story, in sequence: initiative selling early, a market that left value downward, and a lower region where buyers never showed up in size. The close matters. A B that closes inside its own tail is stronger evidence than one that recovers into the fat top by the bell.
What the Shape Says About the Auction
The auction read starts with timing. Sellers took control before the crowd. The heavy volume at the top of the range is the morning's business, and the move down out of that zone happened while most participants were still positioned for a normal day.
Price then left value downward and stayed out. That is the key behavioral fact. Buyers never contested the breakdown. If dip buyers had conviction, the tail would have filled in with volume and the shape would have rounded into something balanced. It did not.
The tail bottom is the day's rejection zone. It marks the lowest prices the session printed, accepted only briefly and on thin participation. That zone becomes a reference for the next session: hold above it and the probe lower failed; trade back into it and the selling may not be finished.
One honest caveat: the shape is read at the close, not during the session. A developing profile that looks like a B at lunch can fill in through the afternoon and finish as a D-shaped balance day, the shape family's third member, covered two lessons ahead. Traders who act on a half-formed B are trading a guess.
Trading the B and the Liquidation Trap
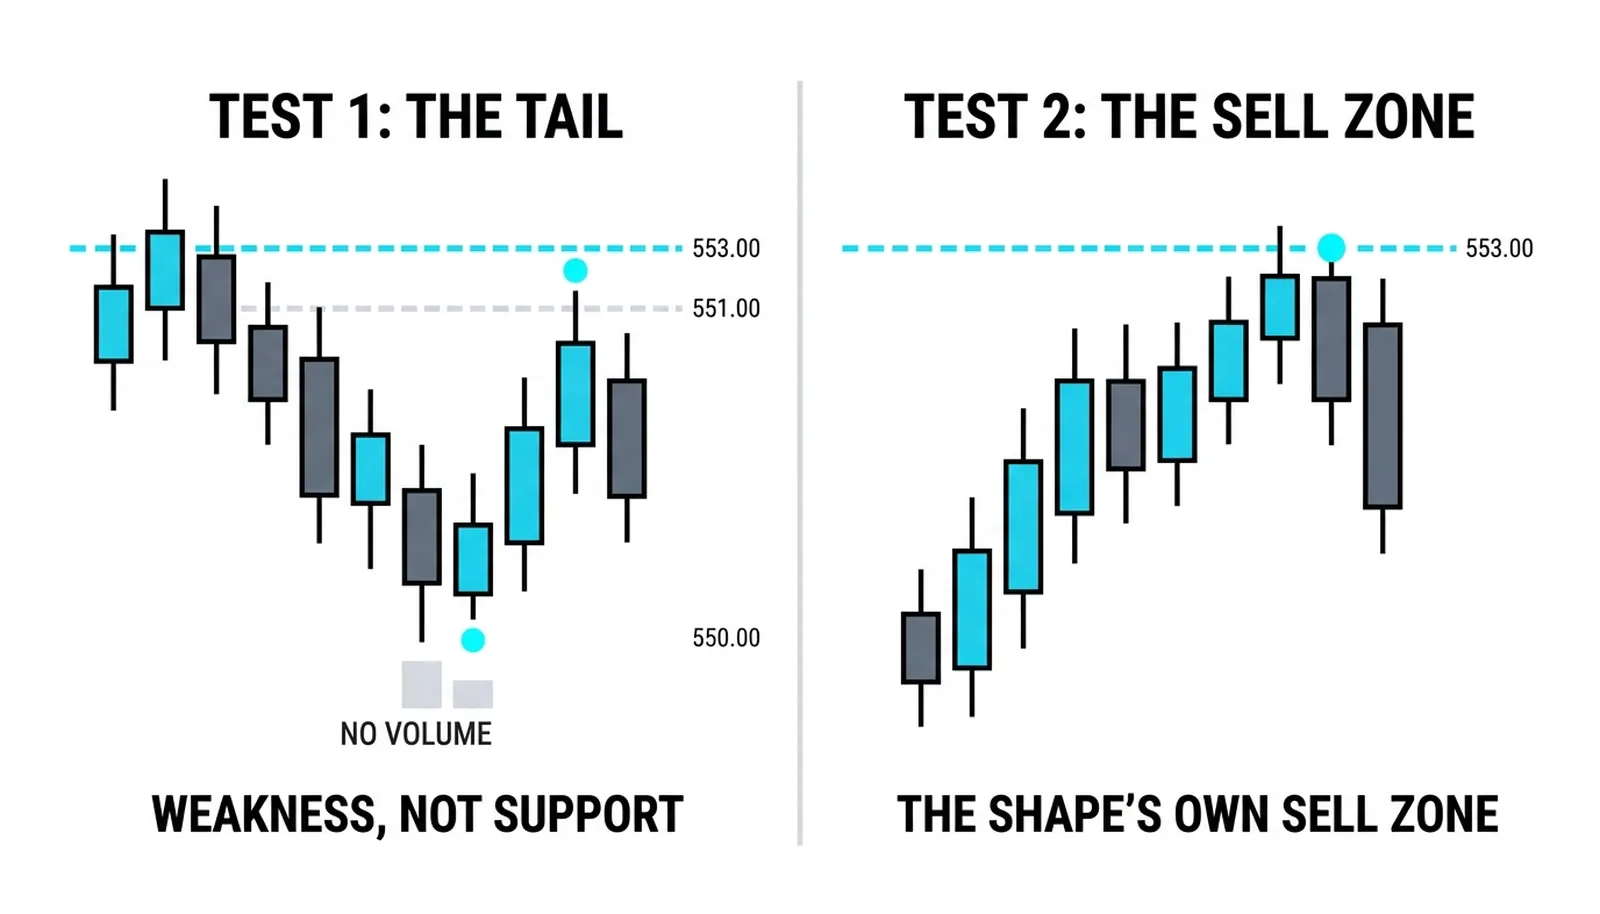
The standard trade logic has two branches. First, rallies back into the fat top on quiet volume are the shape's own sell zone. The old value area is where the day's business was done before the break, and a low-volume return into it is a retest, not a recovery. Second, the thin tail is where dip buyers live if the next day opens above it, because an open above the tail says the probe lower found no followers.
Now the trap. Market profile theory reads the b-shape as selling that is often long liquidation rather than fresh initiative shorting. Holders are dumping inventory, and at least some buyers are staying patient, waiting for longer-term prices rather than chasing. Liquidation is finite. When the inventory is gone, the selling pressure is gone with it.
That is why the shape alone is not a signal. The tell is the aftermath. If value migrates down behind the B over the next session, the bear read is confirmed, because the market accepted the lower prices as the new fair area. If the B sits alone and the next day reverses up through it, that was liquidation finding its floor, and shorting the shape was shorting the end of the move.
Wyckoff made the same distinction decades earlier in the work on distribution and selling climaxes: who is selling, and whether anyone is absorbing it, matters more than the fact of the decline itself.
So the discipline is simple. The B tells you what happened. The next day's value tells you what it meant.
One B, Scored
All numbers here are invented round figures for illustration.
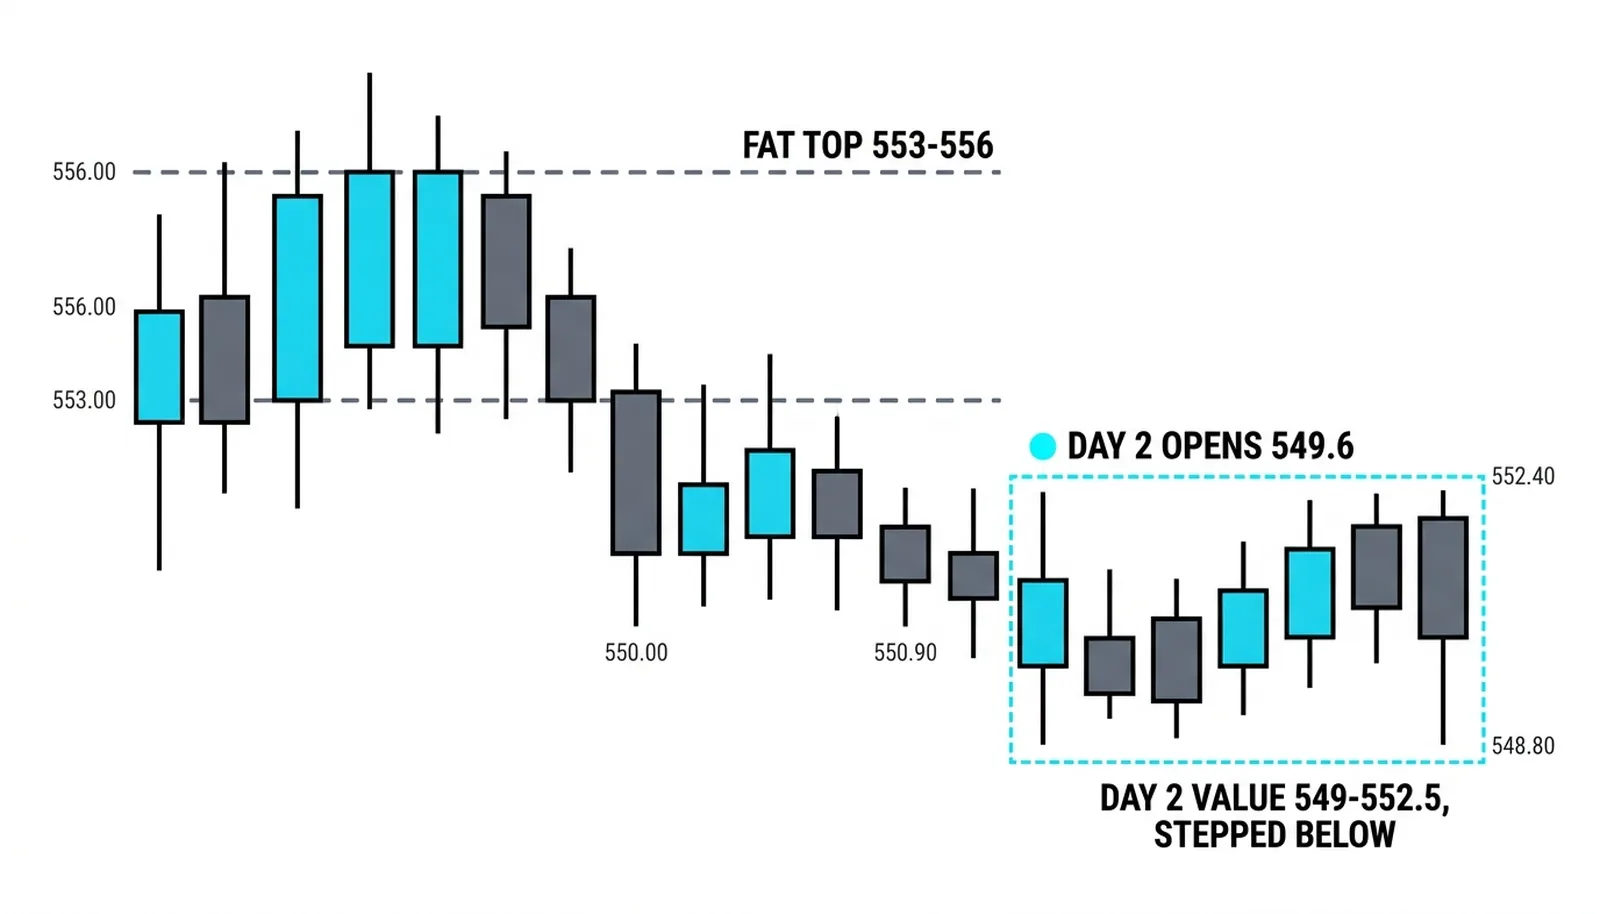
A stock opens at 556. Initiative selling drives it to 550 by midday, and the afternoon never leaves 550.5 to 553. The finished session profile shows seventy percent of the day's volume between 553 and 556, the fat top, with the heaviest single bin at 554.8. A thin tail of light volume hangs down to 550. The close prints 550.9, inside the tail. That is a textbook B.
The next day opens at 549.6, trades between 548.8 and 552.4, and builds its value area from 549 to 552.5, stepped fully below the prior day's fat top.
| Session stage | Price | Volume behavior | The read |
|---|---|---|---|
| Morning, day one | 556 down to 553 | Heavy, seventy percent of the day in the top zone | Value established high; sellers active inside it |
| Midday break | 553 to 550 | Thin, fast trade | Initiative selling; no acceptance below value |
| Afternoon and close | 550.5 to 553, close 550.9 | Light; tail never fills in | Buyers stayed home; B confirmed at the bell |
| Next day | 548.8 to 552.4, value 549 to 552.5 | Value forms fully below the old top | Value migrated down; bear read confirmed |
Walk the two decision points. The tail-bottom bounce attempt: price dipped toward 550 and lifted briefly, but the bounce produced no volume and no sustained trade above 553. A failed bounce at the tail bottom on light volume is weakness, not support. The rally toward 553 stalled in the lower edge of the old fat top, exactly the shape's sell zone, and it stalled on quiet trade. Both tests said the same thing: no buyers with conviction.
The confirmation arrived the next day. Value stepped fully below the prior day's top, meaning the market accepted the lower prices as the new fair area. That stepped-down value is what the shape alone could not prove. Had day two instead opened above 553 and built value back inside the old top, the B would have read as liquidation finding its floor, and the bearish trade would have been wrong.
B-Shape Profile, Answered
What is a B-shaped profile in trading?
A B-shaped profile is a session whose volume distribution has a fat base at the top of the range and a thin tail hanging below. The fat top is the value area where most business was done; the tail is a downward probe that found no acceptance. It is the mirror of the P-shape and the bearish member of the profile day-type family.
What does a B-shaped profile mean?
It means sellers took control early, price left the established value zone downward, and buyers never contested the move. The market did its business high, probed low, and found nothing worth doing down there. On its face, it records a day the sellers won.
Is a B-shaped profile always bearish?
No. Market profile theory holds that the selling is often long liquidation, holders dumping inventory, and liquidation ends when the inventory runs out. The deciding evidence is the next session: value migrating down confirms the bear read, while a B that sits alone and reverses upward was liquidation finding its floor.
How do you trade a B-shaped day?
Rallies back into the fat top on quiet volume are the shape's natural sell zone, and the thin tail becomes a buy zone only if the next day opens above it and holds. The shape is read at the close, never mid-session, and the trade is confirmed or cancelled by where the following day builds its value.
The next lesson steps back from single-day shapes to the tools that build them: how the profile is actually constructed from time and price, and how to read a developing distribution before the closing bell locks it in.