Retail Sales: Consumer Spending as a Signal
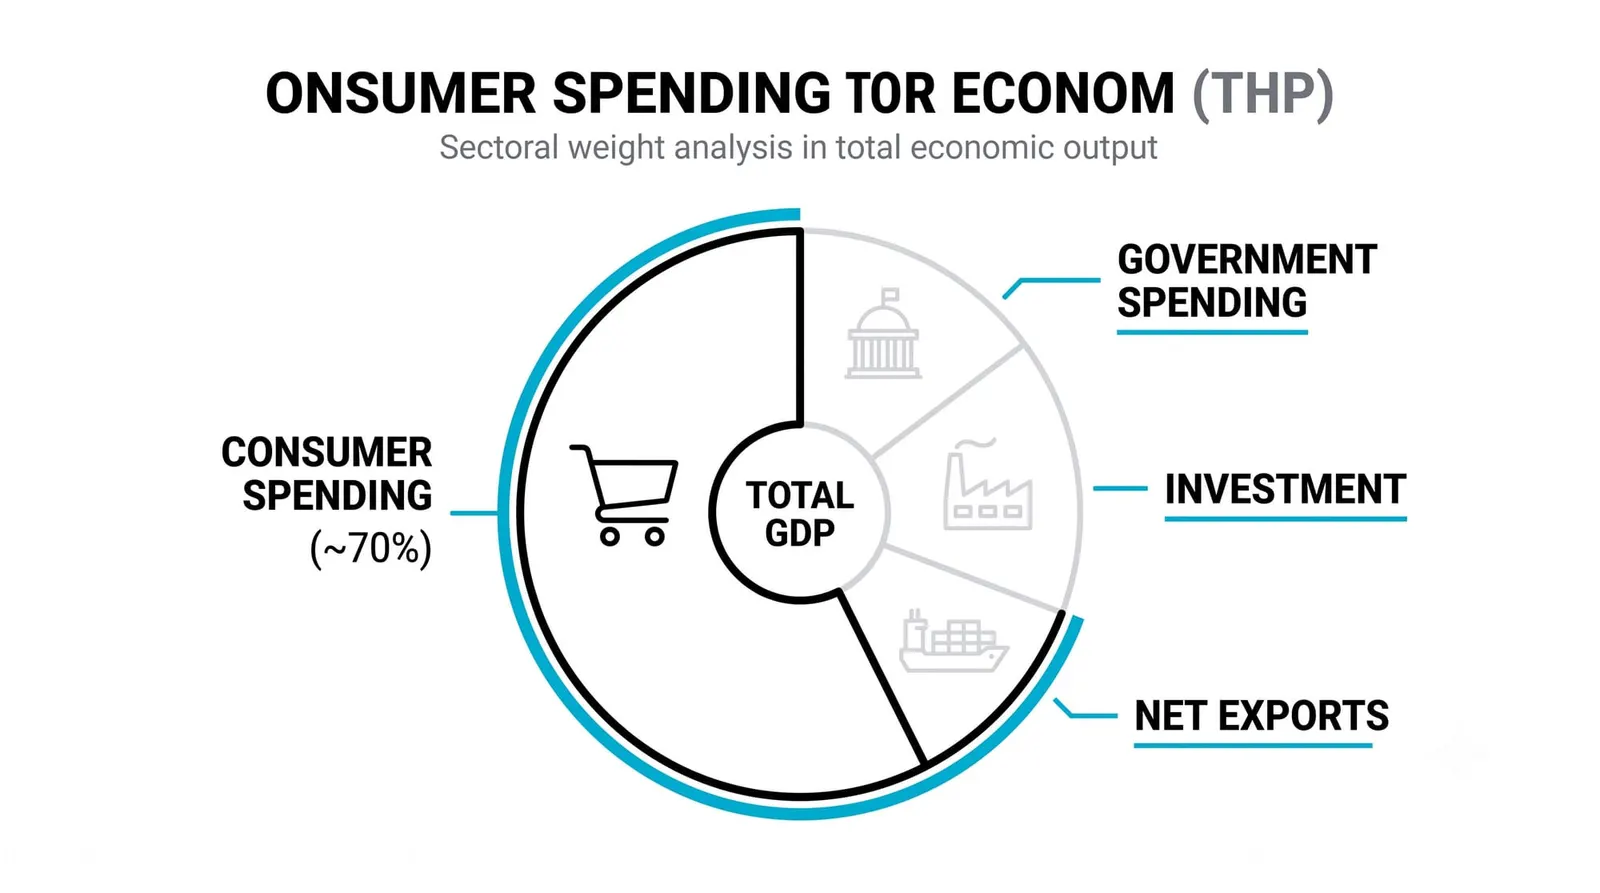
Retail sales tracks what consumers spent at stores and online during a month, and because consumer spending is the largest block of demand in most developed economies, the report is the freshest monthly reading of whether the household engine is speeding up or stalling. That alone is why traders care about a release that, on the surface, sounds like a tally of shopping.

Think of retail sales as what the checkout scanners hear, aggregated into one number. It reports what people did, never what they said they would do. Surveys ask households how confident they feel; this report counts the money that actually changed hands. That gap between talk and action is why the number earns attention even from traders who ignore most data.
You already know from earlier in this level that household consumption is the biggest single block of macro demand in economies like the United States. This lesson is about the monthly instrument that measures that block directly, its quirks, and how to read it without getting fooled.
What Retail Sales Actually Captures
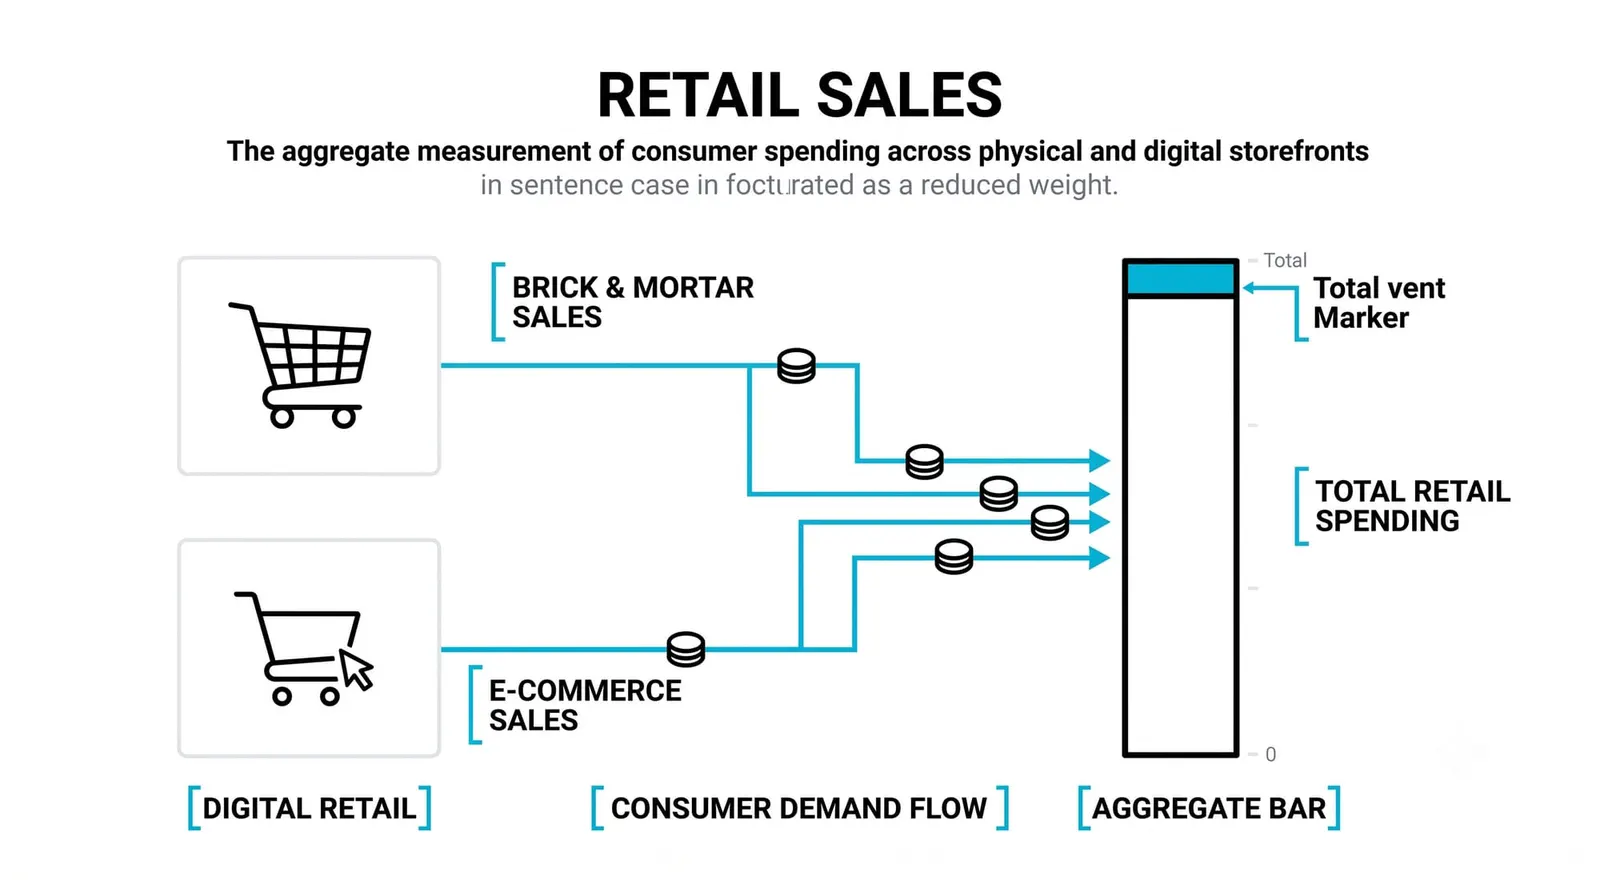
The report measures receipts at retailers: physical stores, car dealers, gas stations, restaurants, and online sellers. That scope matters more than most new traders realize.
Most services are excluded. Rent, healthcare, insurance, haircuts, and streaming subscriptions do not appear in the headline figure, even though services make up the majority of household spending in developed economies. The report therefore covers the goods-heavy slice of consumption, not consumption as a whole.
The values are nominal. No inflation adjustment happens inside the release. If prices across the economy rose sharply during the month, retail sales can rise too, even if people bought fewer items. A strong headline sometimes reflects price tags growing, not baskets growing.
Two components swing the number month to month more than any others:
- Autos. Cars are expensive, so a shift in vehicle sales moves the total even when nothing else changed.
- Gasoline. Gas station receipts rise and fall mostly with fuel prices, not with how much people drive.
Both are volatile, and both can make a quiet month look busy or a busy month look quiet. Keep that in mind every time you see the headline.
Why Consumer Spending Carries So Much Weight
Spending runs in a loop, and the loop is the economy. Households earn income from jobs, spend that income at businesses, and businesses use the revenue to hire, which puts income back in households. The report you are reading measures one full side of that loop.
Jobs feed spending directly. The employment report, covered earlier in this level, tells you how many paychecks exist and how fast they are growing. Retail sales tells you what those paychecks turned into. A strong jobs month followed by weak spending suggests households are saving or paying down debt instead of buying, and that choice changes the growth outlook.
When the household engine stalls, the rest of the economy feels it within quarters, not years. Businesses see revenue soften, slow their hiring, and trim orders to suppliers. GDP, which gets its own lesson later in this level, is where all of this eventually lands in one quarterly sum. Retail sales is the early monthly hint of what that sum will contain.
This is also why central banks watch the report. Persistent strength in spending can keep demand pressure on prices. Persistent weakness can signal the slowdown that tighter policy was designed to produce, or one arriving on its own.
Headline vs Core Retail Sales: Reading the Split
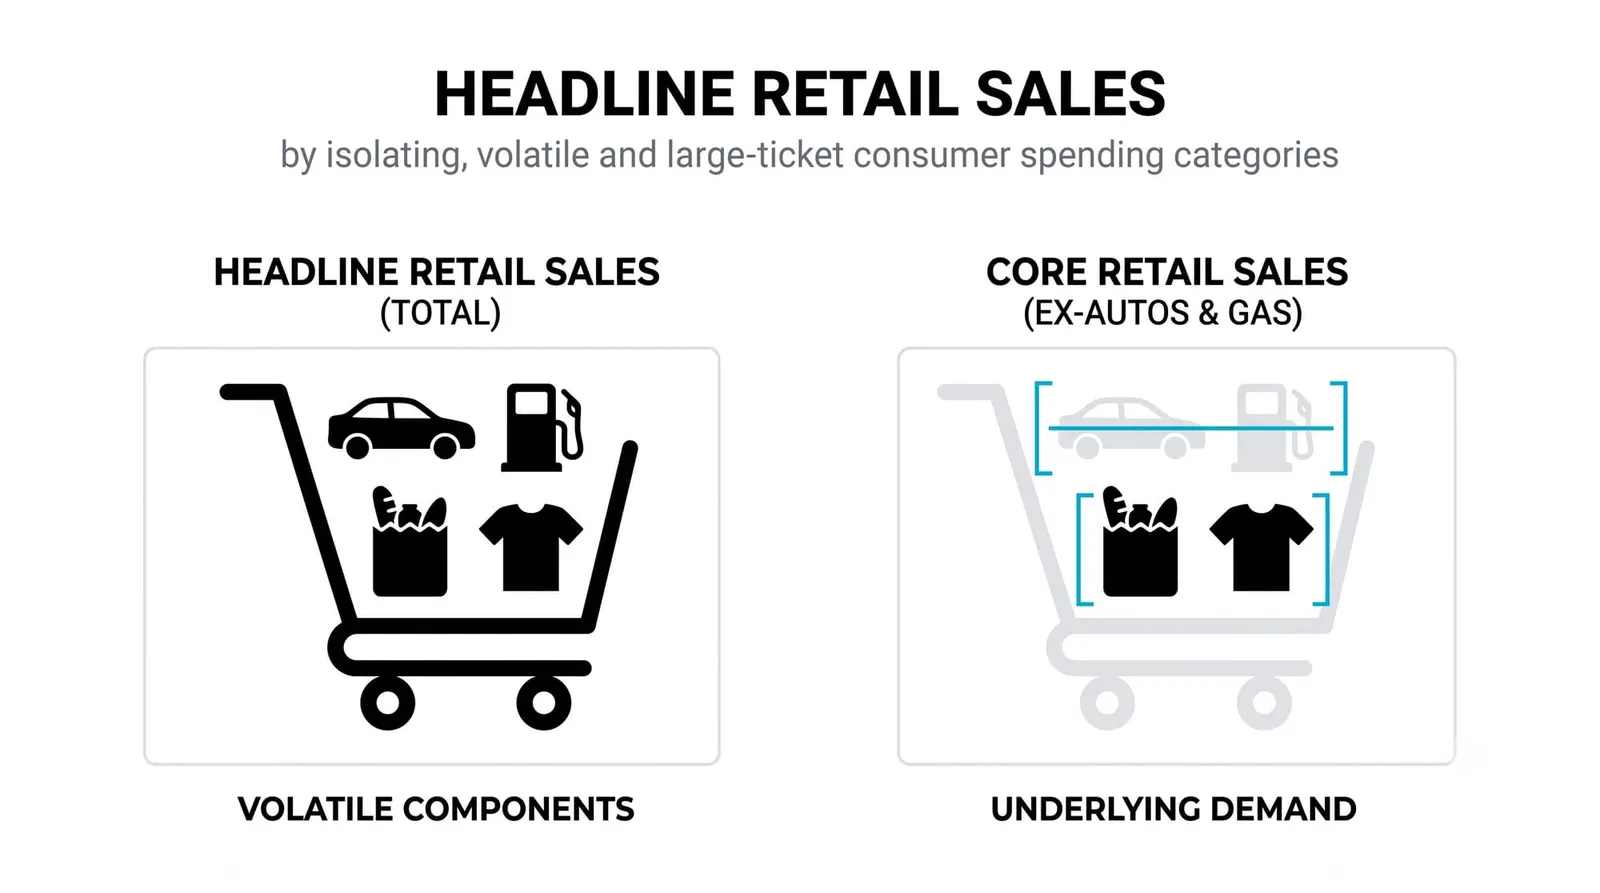
Start every reading by separating the headline from the core. The headline includes everything. The core strips out autos, and analysts commonly also exclude gasoline and building materials when judging the underlying trend.
There is a third cut worth knowing: the control group. This is the subset of retail sales that feeds directly into the consumer spending component of GDP calculations. Many professionals skip the headline entirely and go straight to the control group, because it maps to the growth number that anchors the whole macro conversation.
A strong headline with a weak core usually means prices at the pump did the work. Gasoline receipts surged, the total rose, and the everyday consumer underneath barely moved. The reverse also happens: a soft headline with a firm control group often means falling fuel prices masked healthy spending elsewhere.
The practical habit is simple. Read the headline last. Check the core and control group first, form a view on the underlying consumer, then look at the headline to see what story the media will run with. The gap between those two is where mispricing lives in the first minutes after release.
How This Report Trades Differently From PMI
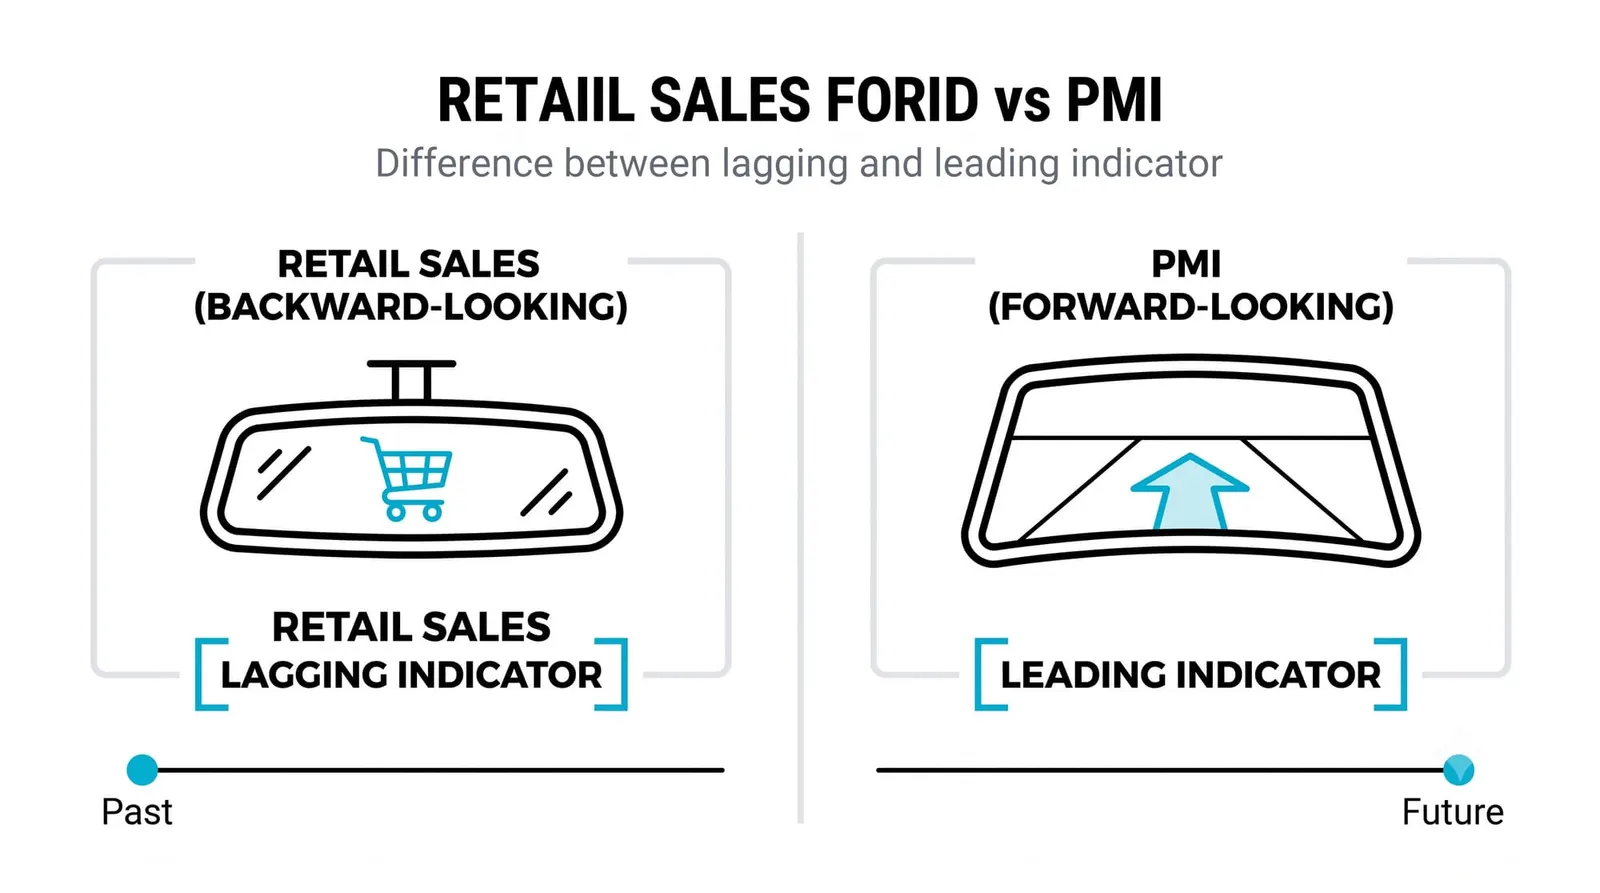
PMI surveys ask purchasing managers how business feels. Retail sales counts transactions. One is opinion collected in the present; the other is hard data about a month that already ended.
That difference cuts both ways. Hard data carries more authority, but it arrives backward-looking and noisy. Retail sales is revised, sometimes substantially, and the revision to the prior month can matter as much as the new print. A strong headline paired with a downward revision to last month tells a weaker story than the headline alone.
Markets react hardest when the report contradicts the trend the surveys suggested. If PMI and confidence surveys pointed to a resilient consumer and retail sales then prints weak, the repricing can be sharp, because positioning was built on the survey story. When the report confirms what surveys already implied, the reaction is often muted even on a big number.
Volatility is the baseline expectation here, not the exception. Weather, holiday timing, and promotional calendars all shift spending between months. One print rarely establishes a trend. Three prints in the same direction start to.
One Month, Two Stories
Imagine a hypothetical month where the headline retail sales print comes in at +0.8 percent, well above what forecasters expected. Gasoline prices jumped sharply that same month.
Now look under the hood. Core retail sales manages only +0.1 percent. The control group also prints +0.1 percent. Strip out the fuel effect and the consumer essentially stood still.
The flattered headline says the consumer is roaring. The flat core says spending volumes went nowhere and the gain was mostly money burned at the pump, which actually leaves households with less to spend on everything else next month.
Bond markets tend to read through the split. Yields might tick up on the headline alone, then settle back or drift lower as desks digest the weak control group, because flat real spending points to softer growth ahead. Stock index futures can pop on the headline and fade within the hour as sector-level detail shows the strength concentrated in gas stations rather than broad retail.
The lesson generalizes. The first move on this report is frequently the wrong move, because the first move trades the headline and the second move trades the split.
| Measure | What It Includes | What It Tells You |
|---|---|---|
| Headline retail sales | All retail receipts: autos, gasoline, food, general merchandise, online | The raw total, heavily swayed by autos and fuel prices |
| Core retail sales | Total excluding autos (and often gasoline and building materials) | The underlying pace of everyday consumer spending |
| Control group | The subset that feeds the consumption component of GDP | The cleanest link between this report and the growth outlook |
| Revisions | Updated figures for prior months | Whether the trend you thought existed actually existed |
The Retail Sales Report, Answered
Does retail sales include services?
No, with the partial exception of restaurants and bars. The report covers goods-focused retail, so housing, healthcare, and most other services sit outside it. Broader consumer spending data, released separately, captures the services side later in the month.
Why is the report so volatile?
Because big-ticket and price-driven components dominate the total. Auto purchases bunch up, gasoline receipts swing with fuel prices, and seasonal events shift spending between months. The monthly number is a noisy sample of a smoother underlying trend.
How much does weather move it?
More than most traders expect. Severe storms can suppress a full month of activity in affected regions, and unusually warm winters can pull forward spending that would have happened later. Analysts routinely adjust for weather, so an obvious weather effect is often priced before you see the number.
What is the control group?
It is the slice of retail sales that flows directly into the consumer spending portion of GDP calculations. It excludes autos, gasoline, building materials, and food services. Professionals treat it as the cleanest single line in the release because it connects this report to the growth number everything else keys off.
Next up in this level: consumer confidence, where you will study what households say about their finances and intentions, and learn exactly when the survey story and the scanner story diverge in ways you can trade around.