PMI: The Leading Economic Indicator
PMI stands for purchasing managers index, and it is a monthly survey of purchasing managers asking whether business conditions improved, held steady, or worsened, compressed into a single number where 50 marks the line between expansion and contraction. It lands before most hard data, which is why traders call it a leading indicator. When the calendar shows a PMI release, you are looking at one of the earliest reads on the economy available that month.

The idea is simple. Instead of waiting for factories to report output or governments to count sales, the survey goes straight to the people placing the orders. Think of it as counting how many houses on a street have their lights back on after a storm; enough lit windows and you know the street is recovering before the utility company publishes its repair totals. The survey trades precision for speed, and that trade is the reason it exists.
What the Survey Actually Asks
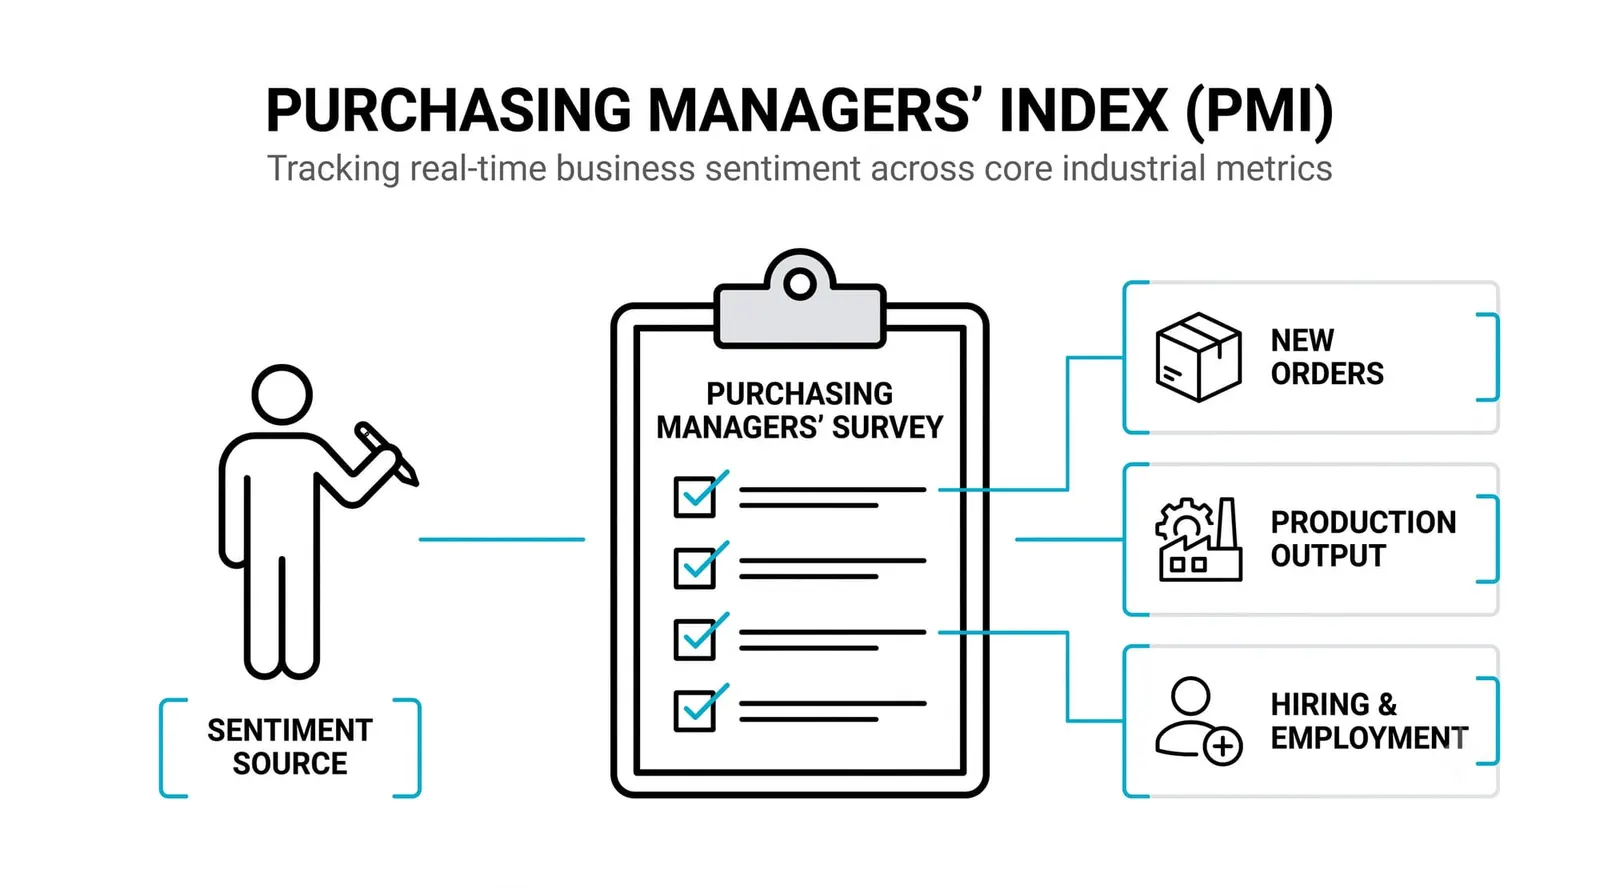
Purchasing managers are the people inside companies who buy inputs: raw materials, components, supplies, services. They see demand before anyone else does, because orders flow through their desks weeks before finished goods reach a shelf. If business is picking up, they buy more. If customers are going quiet, they pull back. The survey simply asks them which direction things moved.
Each respondent answers questions across several categories, and those answers become sub-indices. The main ones you will see quoted are new orders, employment, prices paid, and delivery times. Each one captures a different pressure point inside the same economy.
The math behind the headline number is called a diffusion index. Take the percent of respondents reporting improvement, subtract nothing, and add half the percent reporting no change. An equivalent way to say it: the percent reporting improvement minus the percent reporting worsening, plus 50. If everyone says "same as last month," the index prints exactly 50. If more say better than worse, it climbs above 50.
This is a survey, not a count of transactions. You met the survey-versus-hard-data distinction in the retail sales lesson: one side measures what people say and feel, the other measures what actually changed hands. PMI sits firmly on the survey side, and you should hold that in mind every time you read one.
| Sub-index | What it asks | What it hints at |
|---|---|---|
| New orders | Are incoming customer orders rising or falling? | Future production and demand direction |
| Employment | Are firms hiring or cutting staff? | Labor market momentum before jobs data prints |
| Prices paid | Are input costs rising or falling? | Pipeline inflation pressure |
| Delivery times | Are suppliers delivering faster or slower? | Supply chain strain; slower often signals strong demand |
The 50 Line: Why One Number Splits the Whole Reading
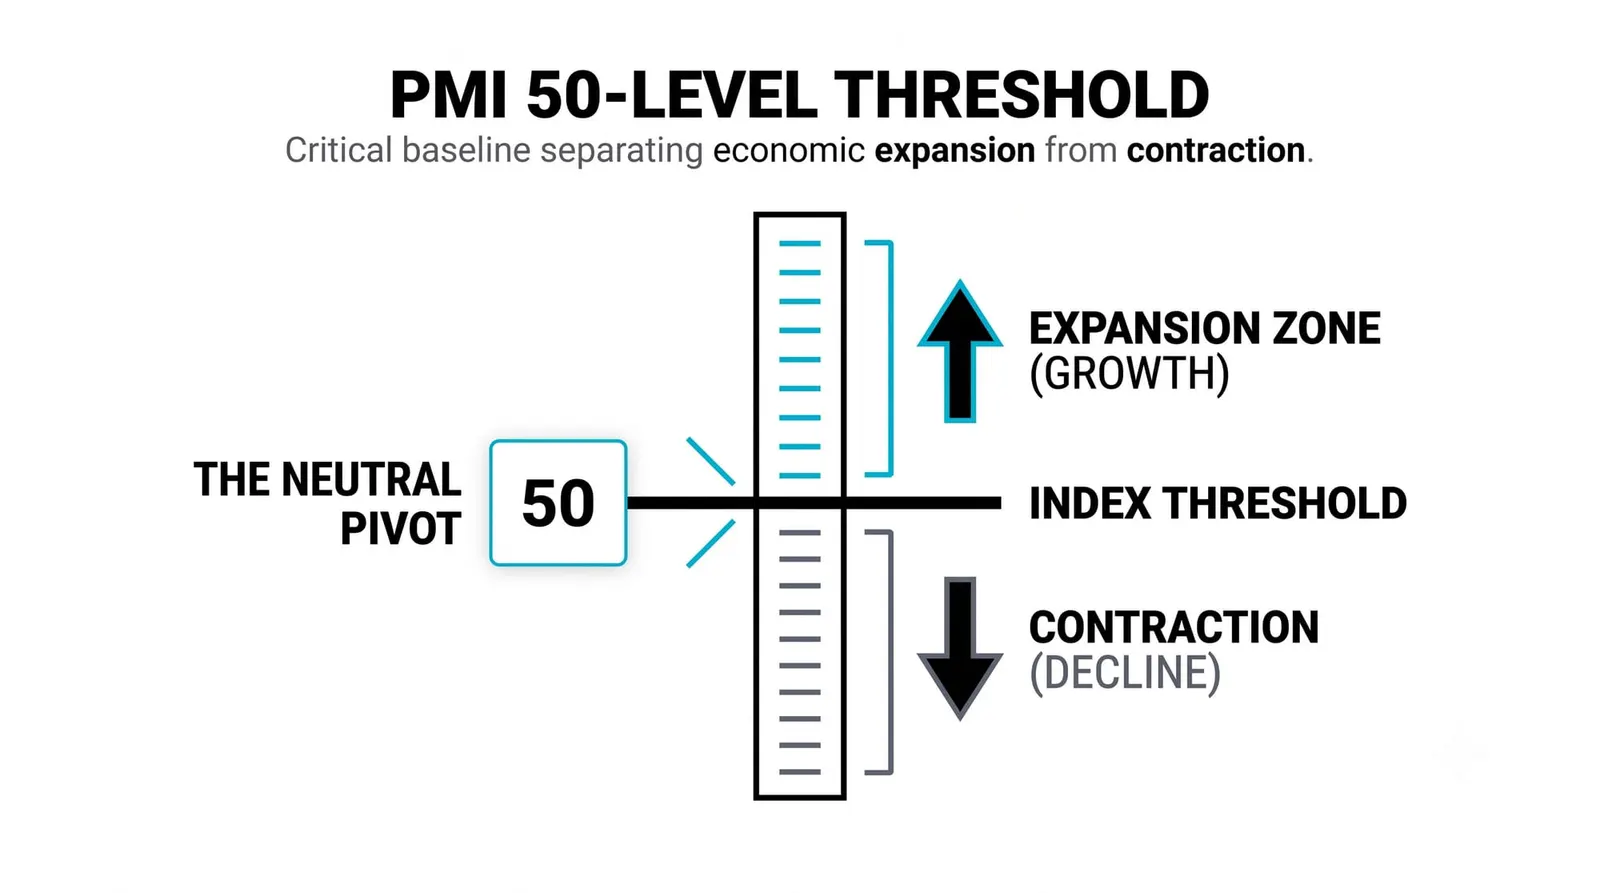
Everything in a PMI report organizes around a single threshold. Above 50 means more firms reported improvement than deterioration, so the sector is expanding. Below 50 means the balance tipped the other way, and the sector is contracting. The number itself is a direction signal before it is anything else.
Distance from 50 tells you speed. A reading of 51 is expansion at a crawl. A reading of 58 is expansion with conviction. Think of 50 as still water and the reading as how hard the current runs in either direction.
What newer traders miss: the change matters as much as the level. A print of 52 is a mild tailwind, fine and forgettable. But a drop from 61 to 53 can be the sharpest story of the month, even though 53 is still expansion. The economy is still growing, yet the momentum just broke hard, and markets trade the change in momentum as much as the level. Read every PMI as two numbers: where it sits, and which way it moved.
Why PMI Is Called a Leading Indicator
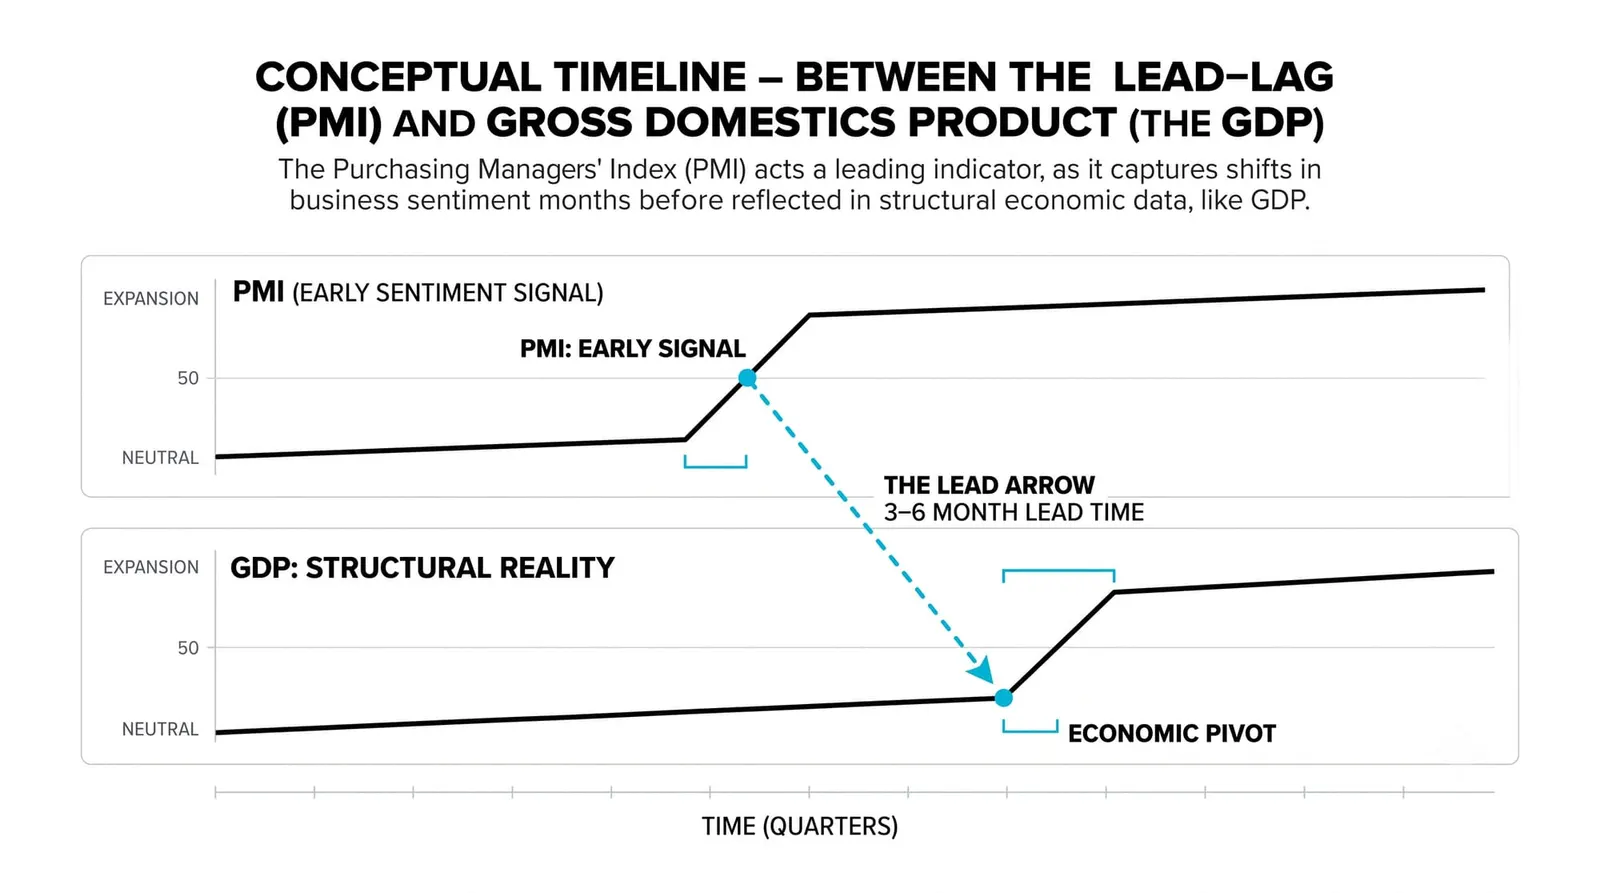
Orders placed today become production tomorrow. That one sentence is the entire logic. A purchasing manager who increases orders this month is forecasting demand, and the factory floor responds to that order weeks later. By the time output, sales, and employment data confirm the shift, the survey flagged it a month or more earlier.
The new orders sub-index is the sharpest end of the survey, because it sits furthest upstream. Employment and output reflect decisions already made. New orders reflect decisions being made right now. When you open a PMI report, many experienced readers go to new orders first and the headline second.
The hard data still matters. GDP gets its own lesson right after this one, and it is the confirming number the PMI previews. The survey senses the turn; the official accounts verify it. Traders position on the survey and check their work against the confirmation.
Manufacturing versus Services: Reading Both Sides
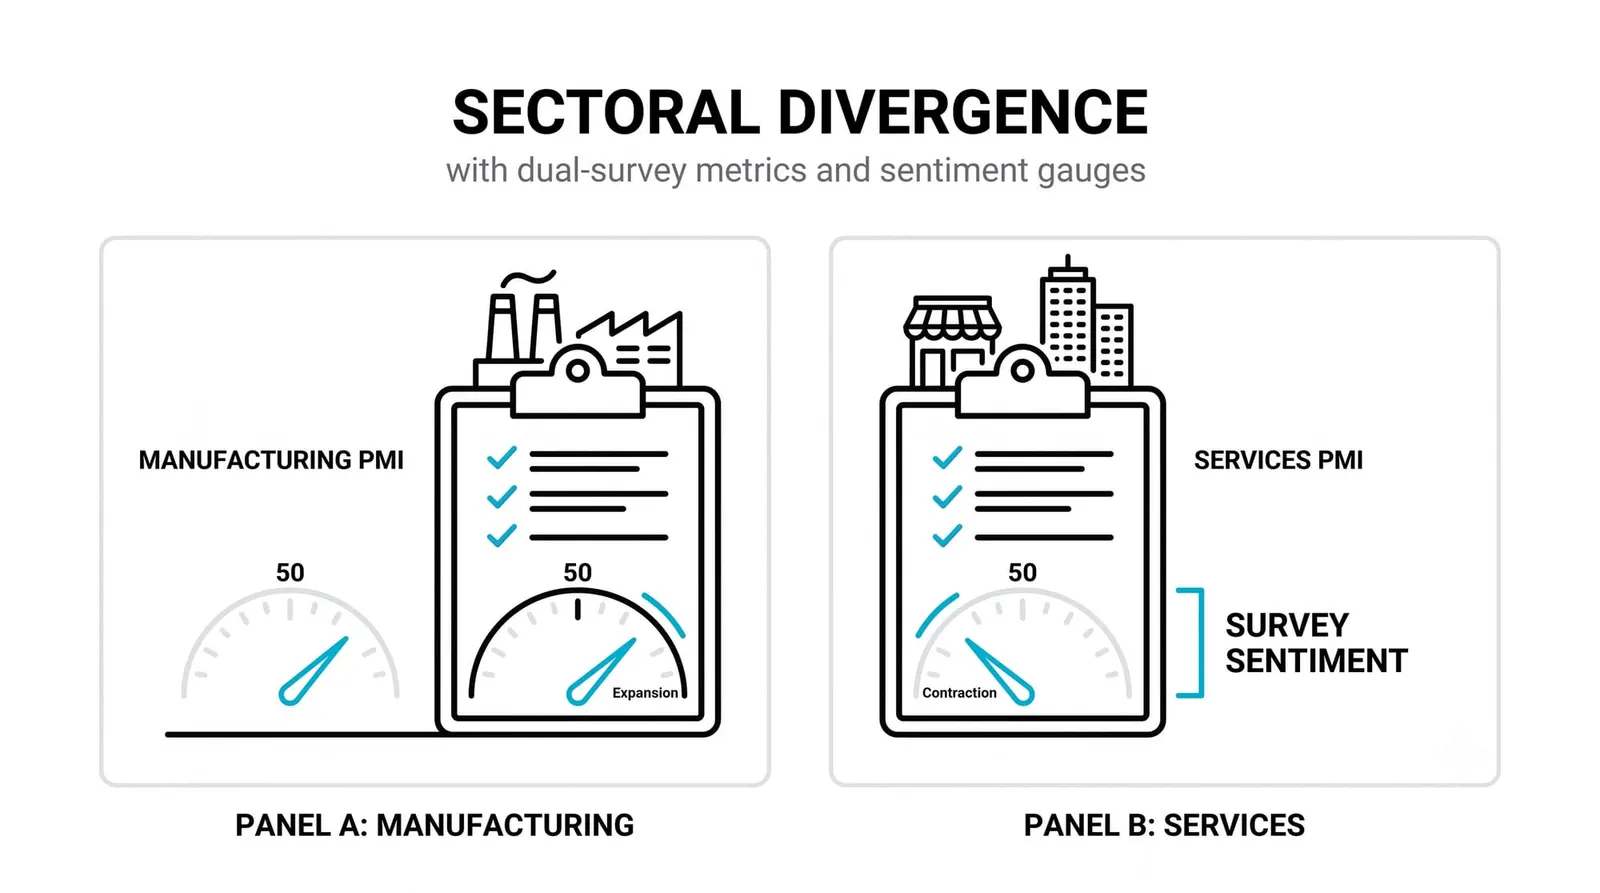
Most economies publish two separate PMI surveys: one for manufacturing, one for services. They are built the same way, but they cover very different slices of activity.
Services dominate employment in developed economies. Healthcare, finance, logistics, hospitality, professional work: that is where most people work and where most spending goes. Manufacturing, despite getting the louder headlines, is a smaller share of jobs in those economies. The factory survey gets attention because goods are cyclical, tradable, and sensitive to global demand, so manufacturing turns earlier and swings harder.
The divergence between the two surveys is its own signal. When manufacturing sinks while services hold up, the economy is usually absorbing a goods-sector shock, often from trade or inventory cycles, while households keep spending on services. When both roll over together, the slowdown is broad and harder to dismiss. One survey wobbling is a story. Both wobbling is a trend.
One Quarter, Two Surveys
Here is a hypothetical quarter with round numbers, built only to show the mechanics. Imagine manufacturing PMI slides from 55 to 48 across three months, while services PMI holds at 54 the entire time.
Read each survey alone first. Manufacturing at 55 was healthy expansion; at 48 it is contraction, and the path from 55 to 48 shows steady deterioration, not a one-month blip. Services at 54, unchanged, says the larger part of the economy kept growing at a moderate pace.
Now read them together. The divergence implies a goods-specific problem: perhaps falling export demand, an inventory correction, or weak business investment, while consumer-facing activity stays intact. Bond desks tend to lean toward the slowdown story, because a contracting factory sector pulls growth forecasts down and can ease rate expectations. Equity desks often split the difference: industrial and materials names look exposed, while service-heavy sectors look insulated.
Flip the case. Now imagine both surveys fall below 50 in the same quarter, manufacturing to 47 and services to 49. There is no mix story left to tell. Broad contraction across both sectors is the kind of alignment that shifts the whole macro conversation toward recession risk, because the survey is sensing weakness in every corner at once. Whether the hard data later confirms it is a separate question, but the warning is unambiguous.
The PMI Report, Answered
Is a PMI above 50 always good news?
No. A reading above 50 means expansion, but context decides whether that helps or hurts. In an overheating economy, a strong PMI can raise inflation fears and push rate expectations higher, which can pressure bonds and equities at the same time. The beat, miss, and in-line framework from earlier in this level applies here too: a 54 that was expected to be 56 can land as bad news, because markets price the expectation, not the absolute number.
Why do flash and final PMI readings differ?
Flash readings are early estimates built from most, but not all, of the survey responses, released roughly a week before the final number. The final incorporates the remaining replies, so it can revise up or down. The flash gets the bigger market reaction because it is first; the final matters when it revises the flash meaningfully, because a revision changes the story after positions are already set.
Can PMI predict recessions?
It can warn, but it cannot confirm. Sustained readings below 50, especially across both manufacturing and services, have historically preceded or accompanied downturns, because the survey captures the order flow that dries up before output does. But single weak months happen without recessions following, and the survey measures direction, not depth. Treat a sub-50 stretch as a signal to watch the confirming data, starting with GDP, rather than as a verdict on its own.
Which matters more for markets, manufacturing or services?
It depends on what the market is worried about at the time. Manufacturing moves first and swings hardest, so it tends to dominate during trade shocks and global growth scares. Services carries more weight for the domestic employment and inflation picture, because that is where most jobs are. When the two disagree, the disagreement itself is usually the most tradable information in the report.
Next in this level comes GDP, the hard-data heavyweight that confirms or contradicts everything the surveys hinted at. Read PMI as the early signal and GDP as the official count, and you will start to see how the monthly data flow fits together as one sequence.