Consumer and Business Confidence, Explained
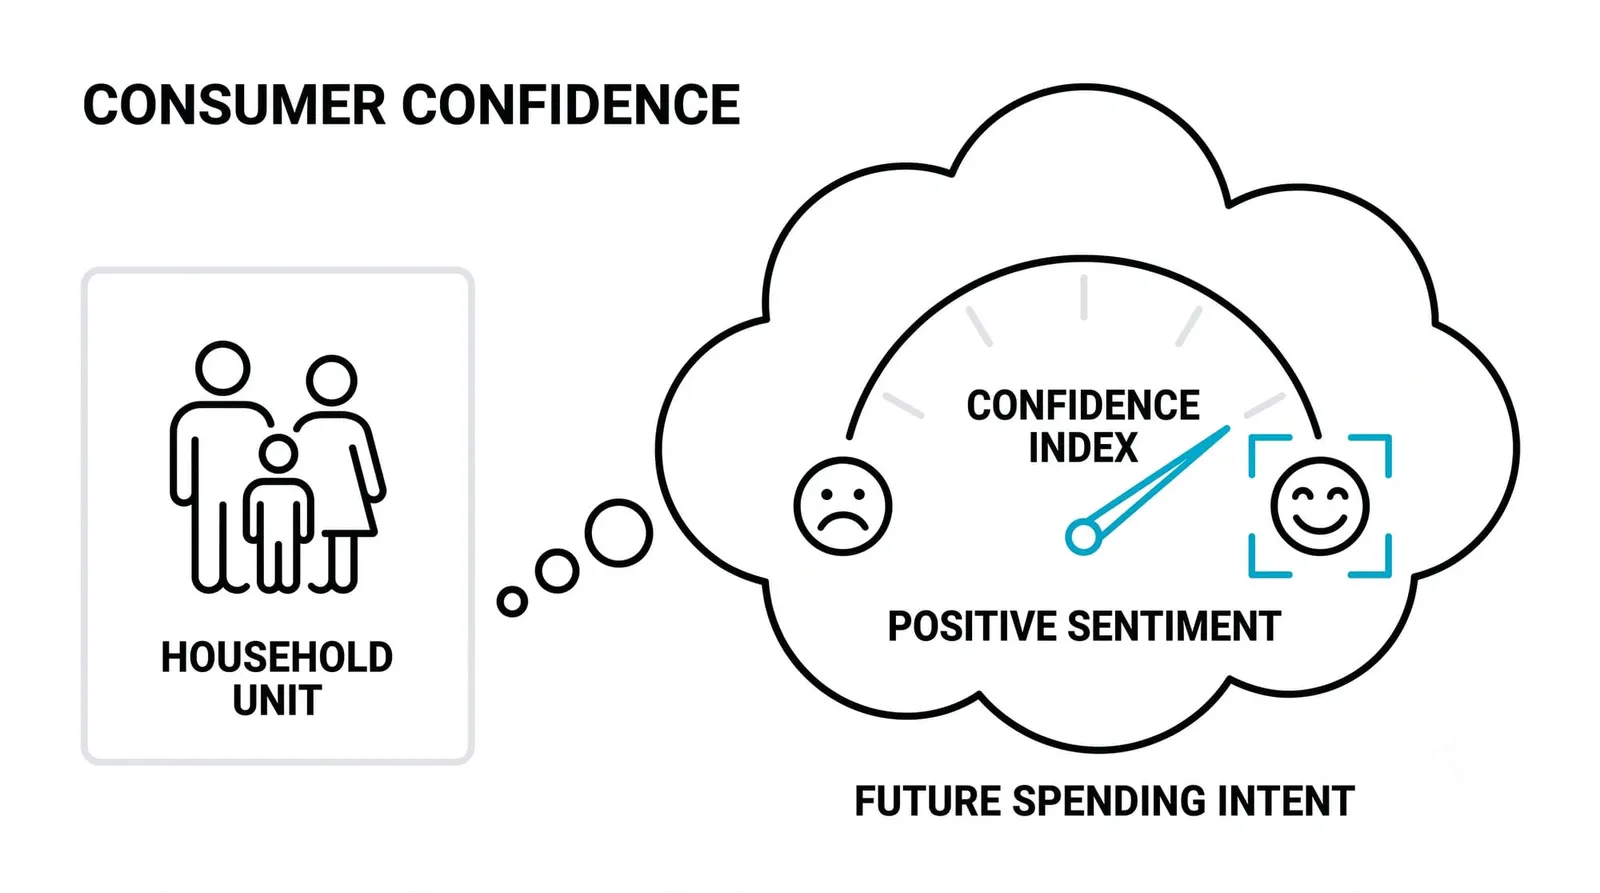
Consumer confidence surveys ask households how they feel about their finances and where the economy is heading, and business confidence surveys ask companies the same questions from the other side of the checkout counter. Neither survey pays a single bill. What they do is shift what people dare to spend and hire this month, which is why markets read them as early mood readings on spending itself.

You already know the hard side of this. Retail sales told you what consumers actually did with their money. Confidence data is the complement: what people said they felt, measured before the card statements exist. Think of confidence as a mood ring on the economy; it changes no one's income, but it changes what people dare to buy while wearing it.
Consumer Confidence: Measuring How People Feel About Spending
The major consumer surveys are built the same way at their core. A polling organization contacts a sample of households and asks a few dozen questions. Some cover current conditions: how do you feel about your finances today, is now a good time to find a job, is business activity good or bad. Others cover expectations: where do you think jobs, income, and business conditions will be in six months.
The answers get converted into an index, usually benchmarked against a base year set to 100. A reading of 110 means households feel somewhat better than they did in the base year. A reading of 85 means they feel worse. The absolute number matters less than the direction and the speed of change.
Watch the expectations sub-index. That is the part of the survey that moves ahead of actual spending. People rarely cut spending because today feels bad; they cut because they expect tomorrow to be worse. A household that fears layoffs in six months starts saving now, long before any layoff notice arrives.
Pay attention to the big-ticket intent questions too. Many surveys ask directly whether respondents plan to buy a home, a car, or a major appliance in the coming months. These plans are expensive, often financed, and easy to postpone. When home-buying intentions roll over, the housing data usually follows a few months later. When car-buying plans sag, auto sales tend to sag behind them.
One honest caveat: people answer surveys through the lens of whatever they saw on the news that week. Gas prices, stock market headlines, and political noise all bleed into the answers. The data is real, but it is soft by construction.
Business Confidence: Measuring How Companies Feel About Hiring
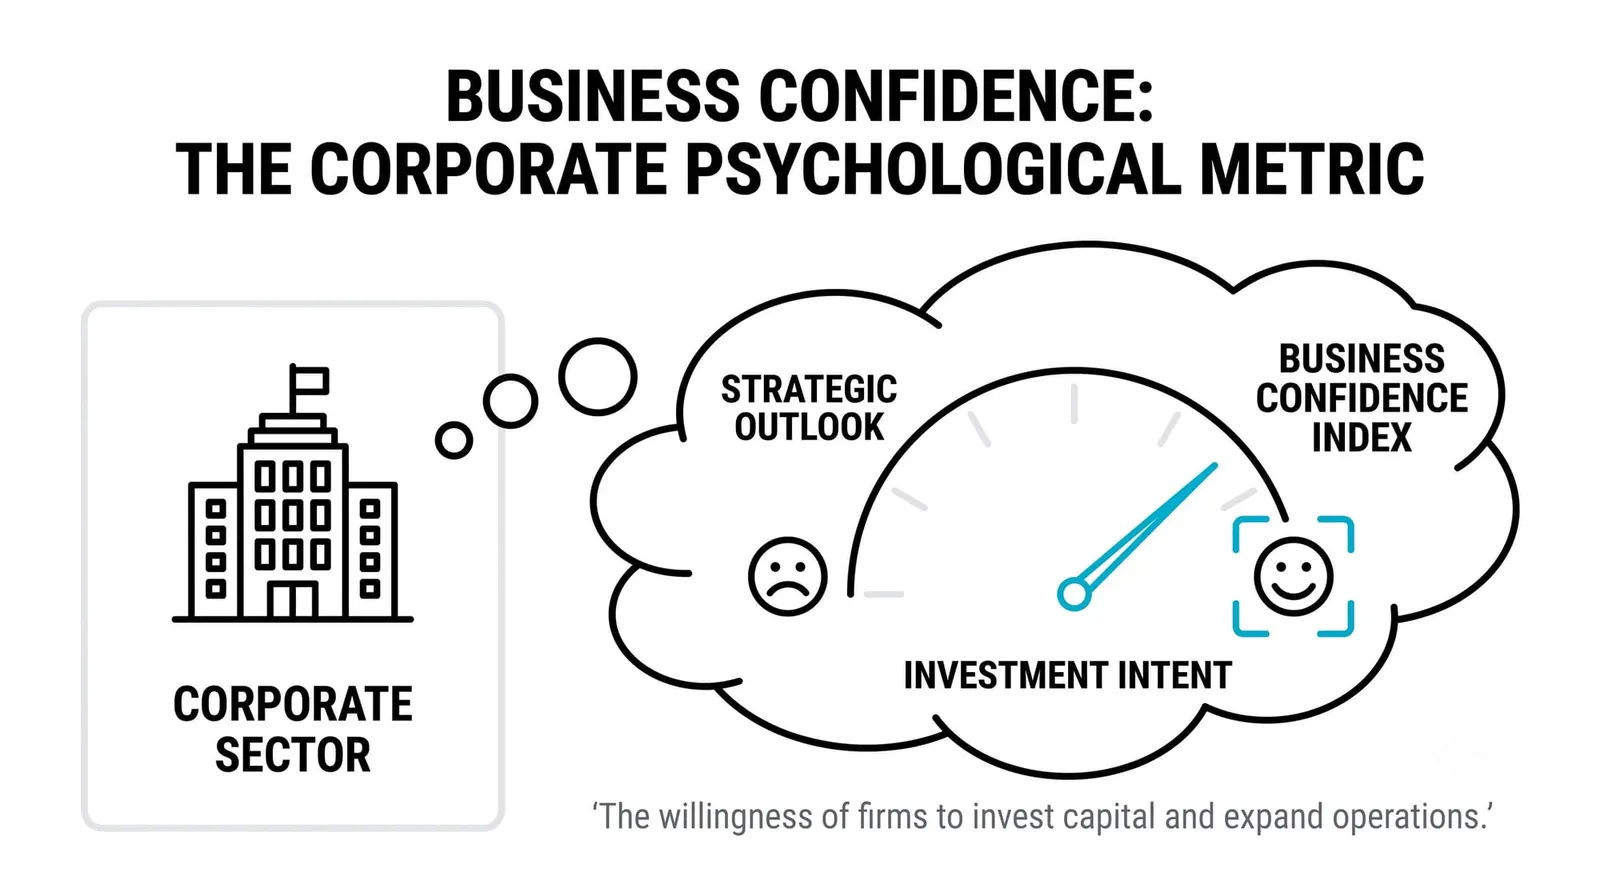
On the firm side, the mirror image exists. Business confidence surveys ask purchasing managers, executives, and small business owners about orders, output expectations, hiring plans, and investment intentions. A company that expects strong demand hires ahead of it. A company that expects weakness freezes headcount and delays the equipment purchase.
You have already met the PMI family and its expectations relatives. Business confidence surveys share the same diffusion machinery: respondents answer better, worse, or the same, and the index nets the positives against the negatives, typically with 50 as the line between expansion and contraction. The details differ by survey, but the scoring logic is the one you already know.
The reason traders care is mechanical. A confident purchasing manager is an order placed next week. Hiring intentions become job postings, then payrolls. Investment intentions become capital goods orders, then factory output. The survey captures the decision; the hard data captures the decision executed. The survey arrives first.
Small business surveys deserve a separate glance. Small firms hire a large share of workers in most economies and have thinner cash buffers, so their confidence swings harder and earlier than that of large corporations. When small business optimism drops sharply, the hiring slowdown that follows can be fast.
Why Confidence Data Leads Actual Spending and Hiring
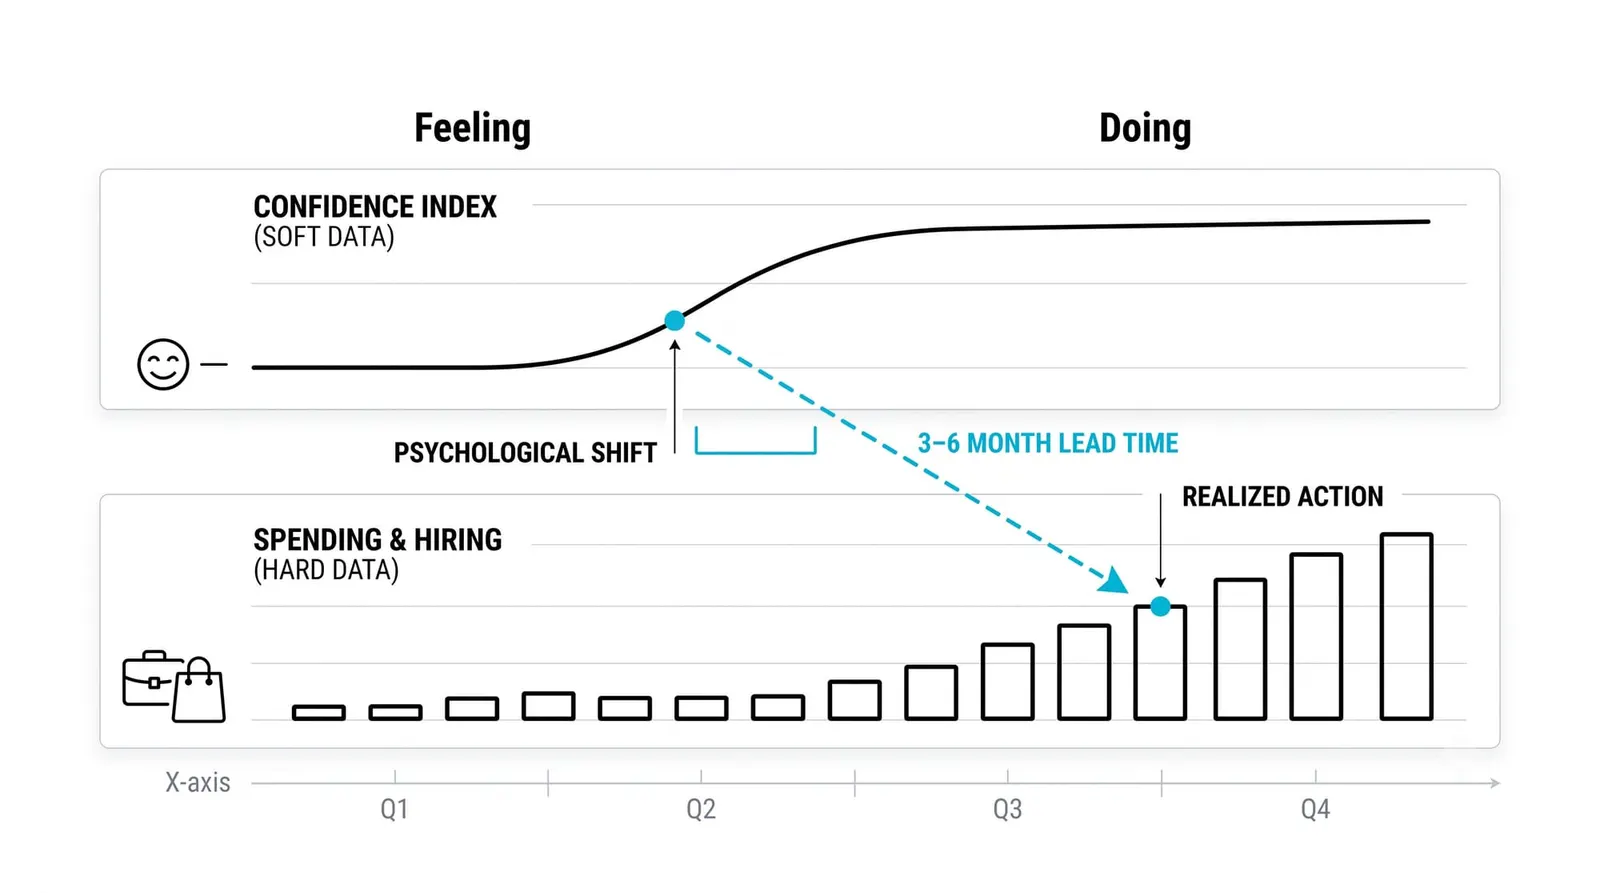
The causal chain runs in one direction: mood, then intent, then the card statement and the payroll. A worried consumer postpones the car purchase this month; the dealership reports weaker sales next month; the manufacturer cuts a shift the month after. The survey catches the first link in that chain.
The lead is real but short. Expectations data typically runs a few weeks to a few months ahead of the spending figures it predicts. It is not a crystal ball for next year. Treat it as a near-term tilt on the data you already track, nothing more.
The lead also breaks down in a specific way: a mood without income is a wish. Consumers can report strong confidence for months while their savings run down, and the spending eventually stops regardless of how they feel. Confidence predicts spending only when the financial capacity to spend exists alongside it. This is why the survey works best as a direction check on income and employment trends, not as a standalone signal.
Trading Confidence Reports Without Overweighting Them
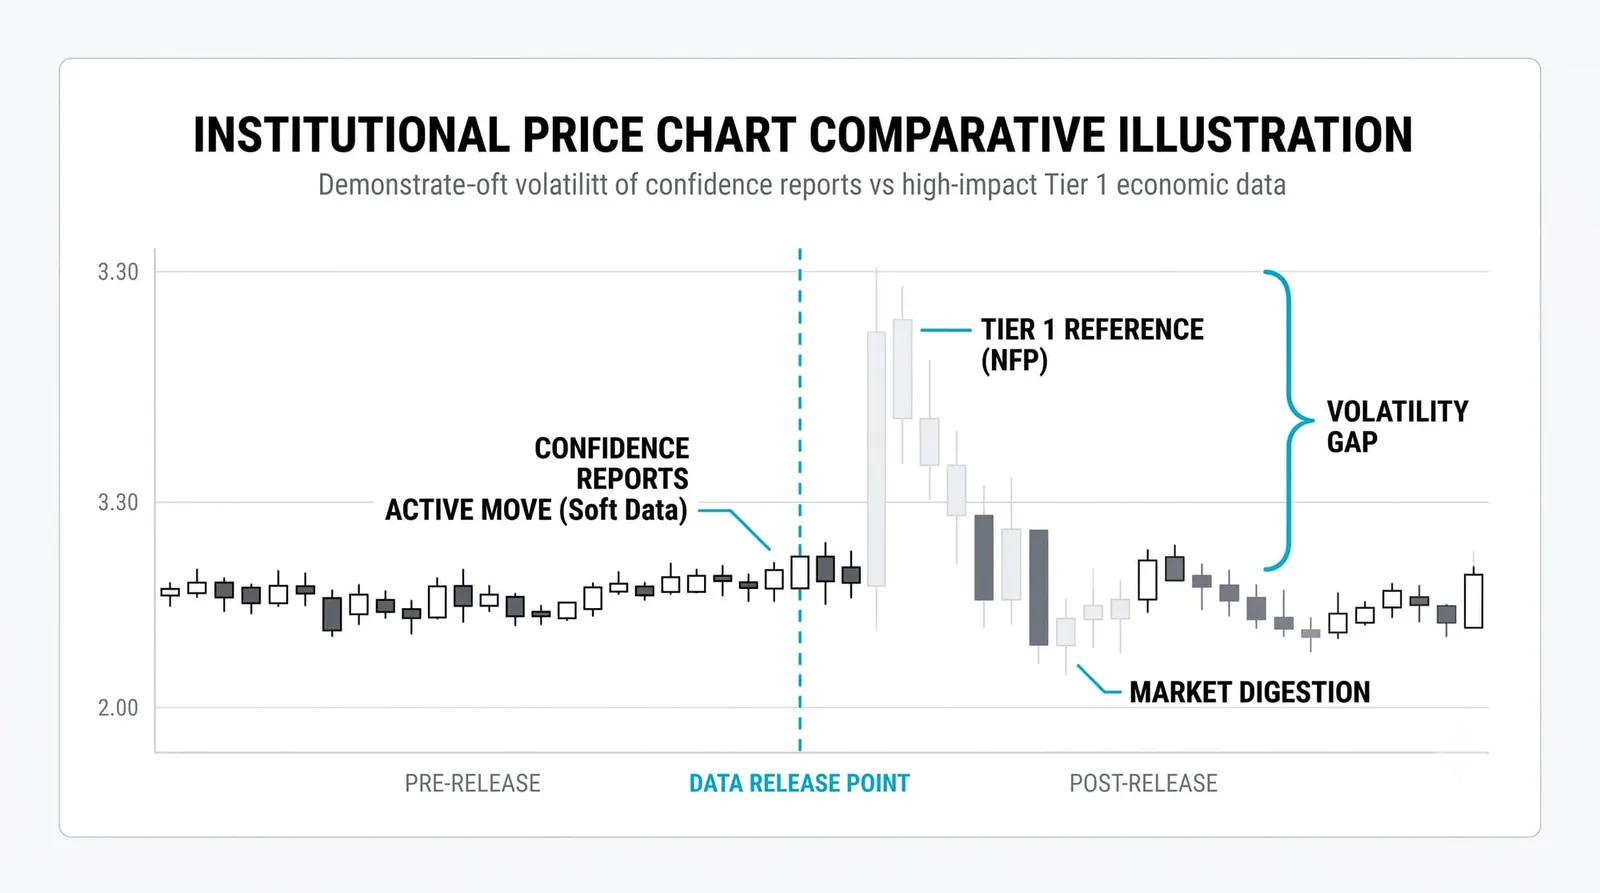
Confidence releases move markets when they surprise. A big miss on expectations can hit equity indices and the domestic currency within minutes, because traders reprice the next round of spending data on the spot. But these moves fade fast when the hard data contradicts them. A terrible confidence print followed by a solid retail sales number gets forgotten within days.
Run the said-versus-did check every time. Confidence that stays high while retail sales sag is a stale reading; people are answering from habit, not from their actual behavior. Confidence that collapses while spending holds firm is often a reaction to headlines rather than to household finances. In both cases, trust the did over the said.
The practical use is narrower than the headlines suggest. Use confidence data as a direction check on stories already in place. If your macro read says the consumer is tiring, a falling expectations sub-index confirms it and a rising one challenges it. What you should not do is build a position on a confidence print alone. The survey is an early whisper, and whispers are cheap.
One Quarter of Falling Confidence
Here is a hypothetical quarter with invented round numbers. Consumer confidence slides 12 points over three months, from 108 to 96. Over the same stretch, retail sales hold flat. Business confidence falls too, but only in the services survey; the manufacturing survey stays steady.
Three reads are possible.
- Mood lagging reality. Nothing is wrong yet; households are reacting to scary headlines, and the flat retail sales prove behavior has not changed. Implication for next quarter: spending holds, confidence recovers, and this was noise. A trader holding this read stays with existing positions and treats the confidence drop as a discount on sentiment-sensitive assets.
- Mood leading reality. The 12-point slide is the early warning, and flat retail sales are just the lag. Implication: next quarter's spending data weakens, and the services-side weakness in business confidence supports it, since services dominate consumer spending. A trader holding this read reduces exposure to consumer-driven sectors and watches the next retail sales print as the confirmation test.
- A divergence with its own story. Services confidence falling while manufacturing holds suggests the weakness is concentrated, perhaps in discretionary services rather than goods. Implication: a mixed quarter, soft in services, fine in goods. A trader holding this read differentiates instead of making one economy-wide bet.
Notice what the example does not allow: certainty. The same three prints support three different positions. The honest move is to size for ambiguity, name the data point that would prove each read wrong, and wait for it. In this case, that data point is the next retail sales release.
| Series | Who is asked | What it predicts | How fast it fades |
|---|---|---|---|
| Consumer confidence | A sample of households, on their finances and plans | Near-term spending, especially big-ticket items | Weeks; one mood swing rarely holds |
| Expectations sub-index | The same households, on the months ahead | The forward edge of the spending data | Fastest to move, fastest to reverse |
| Business confidence | Firms, on orders, output, and hiring plans | Investment and hiring a few weeks out | A quarter or two when the trend confirms |
| PMI | Purchasing managers, via the diffusion score | Production and orders before the hard data | Holds longer when the whole survey moves together |
Confidence Data, Answered
Can confidence stay high while the economy slows?
Yes, and it happens regularly. Households answer surveys based on their own jobs and recent headlines, and both can lag the underlying slowdown by months. High confidence during a slowdown is usually a lagging artifact, not a signal that the slowdown is fake.
Why do different confidence surveys disagree?
They sample different groups, ask different questions, and weight the answers differently. One survey may lean on labor market questions while another leans on personal finances, so a strong job market can push one up while high prices pull the other down. Disagreement between surveys is information about which pressure is dominating, not a flaw.
Do confidence numbers move markets much?
They move markets briefly when the surprise is large, then yield to hard data. A big expectations miss can shift prices for hours or a day; a retail sales or payrolls print that contradicts it erases the move. Treat them as second-tier releases that can sharpen or challenge the first-tier story.
Which sub-index should a new trader watch?
The expectations sub-index of the major consumer survey. It is the component with the best record of moving ahead of actual spending, and it is the piece professionals quote when they say confidence is deteriorating. Current conditions tell you how people feel now; expectations tell you what they are about to do.
Confidence completes the monthly macro dashboard: feelings, intentions, and the receipts that follow. With the economy covered, this level turns from it to the things you actually trade: how companies report, how money moves between sectors, and how sentiment gets priced.