Supply and Demand at the Macro Level
Supply and demand at the macro level is the same force that moves any single market, rebuilt at the scale of whole economies. Macro supply is how much labor, capacity, credit, and goods an economy can produce. Macro demand is how much spending is aimed at all of that output. The gap between the two is where prices, wages, and interest rates get their direction.

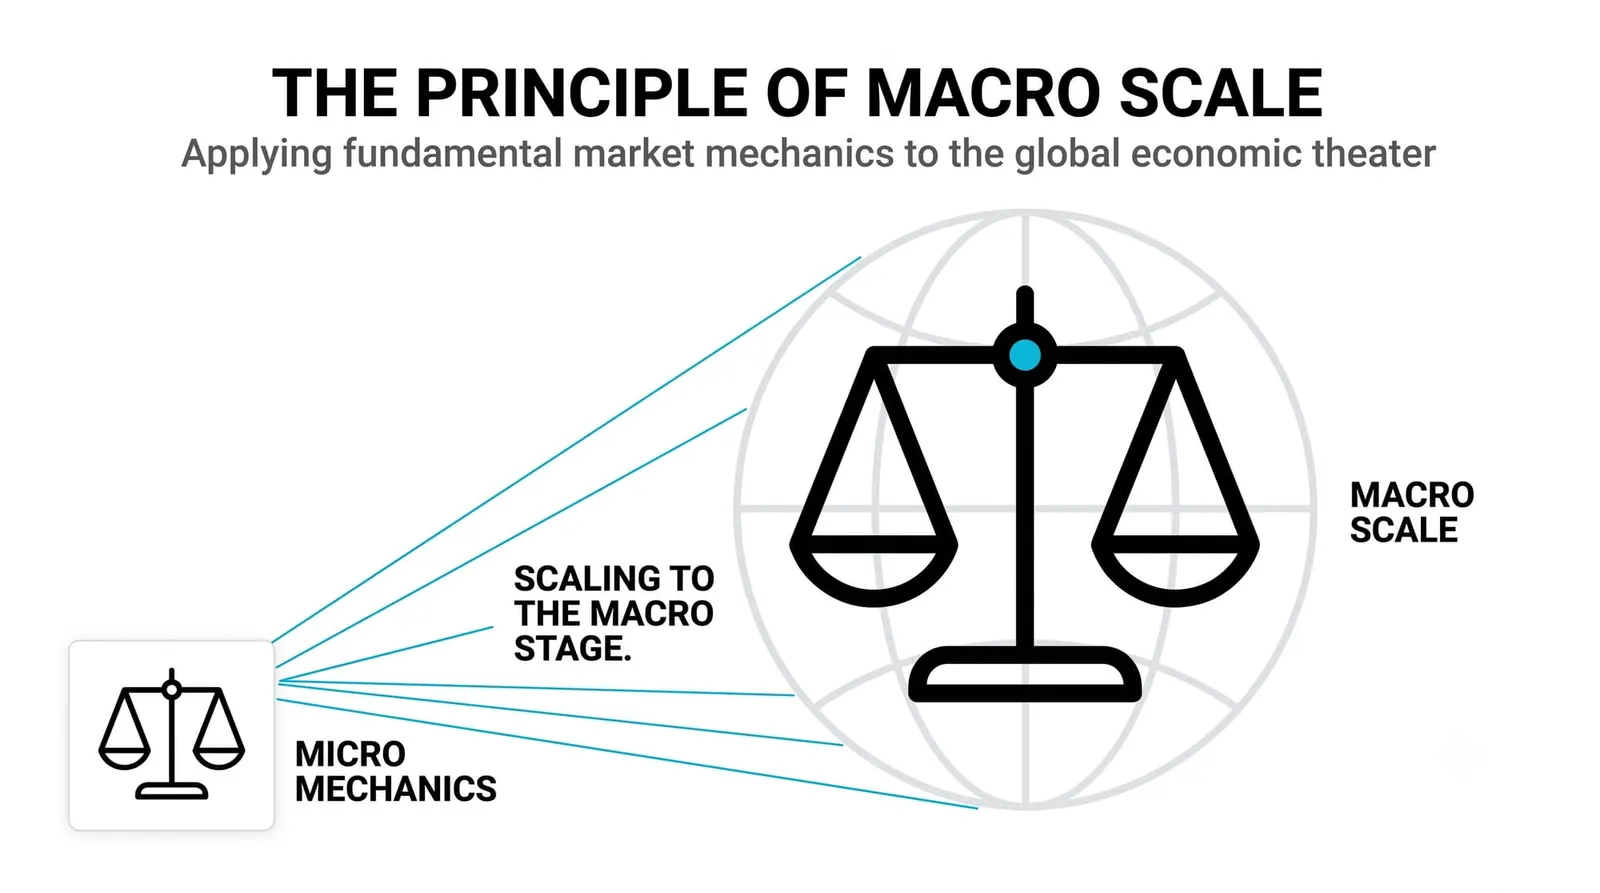
You already met this force on individual charts, where buyers and sellers pushed a single price around. That version stays in the earlier level. Here the stage gets bigger: instead of one stock or one currency pair, you are watching an entire country's output against an entire country's spending. It is the same seesaw you met on single charts, rebuilt at the scale of entire economies.
Once you can see that seesaw, most of what central banks, governments, and headlines talk about stops being noise. Inflation reports, jobs data, rate decisions: each one is a reading on which side of the plank is heavier.
What Macro Supply Actually Looks Like
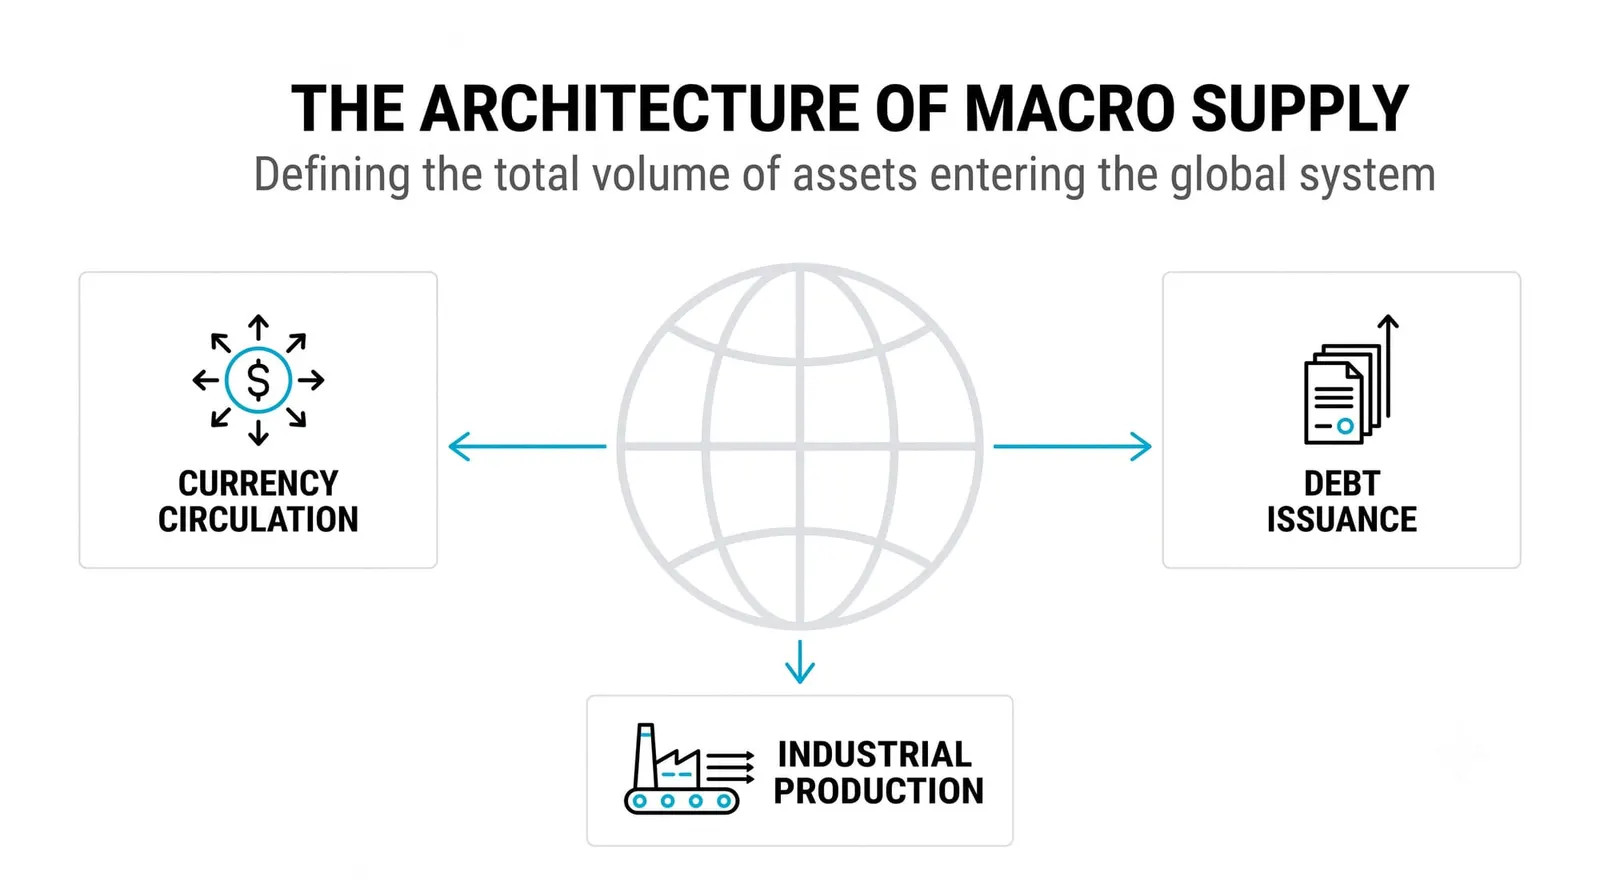
Start with the working-age labor force. An economy can only produce as much as its people can work, and that pool grows slowly. Populations age, birth rates shift, immigration policy changes. None of these turn on a dime.
Next is physical capacity: factories, ports, power grids, roads, and the machinery inside them. A new semiconductor plant takes years from decision to first output. Infrastructure takes longer. This is why supply cannot simply "respond" when demand surges.
Then there is credit. Banks can only lend against their capital and their confidence, and lending is the fuel most businesses use to expand. When credit is tight, even willing producers cannot grow.
Finally, commodities and goods: the oil, grain, metals, and manufactured products an economy extracts or makes. These depend on geology, weather, and long investment cycles.
The pattern across all four is speed, or the lack of it. Supply grows in years, because factories and workforces take time to build. Keep that fact in your pocket. It explains most of what follows.
What Macro Demand Actually Looks Like
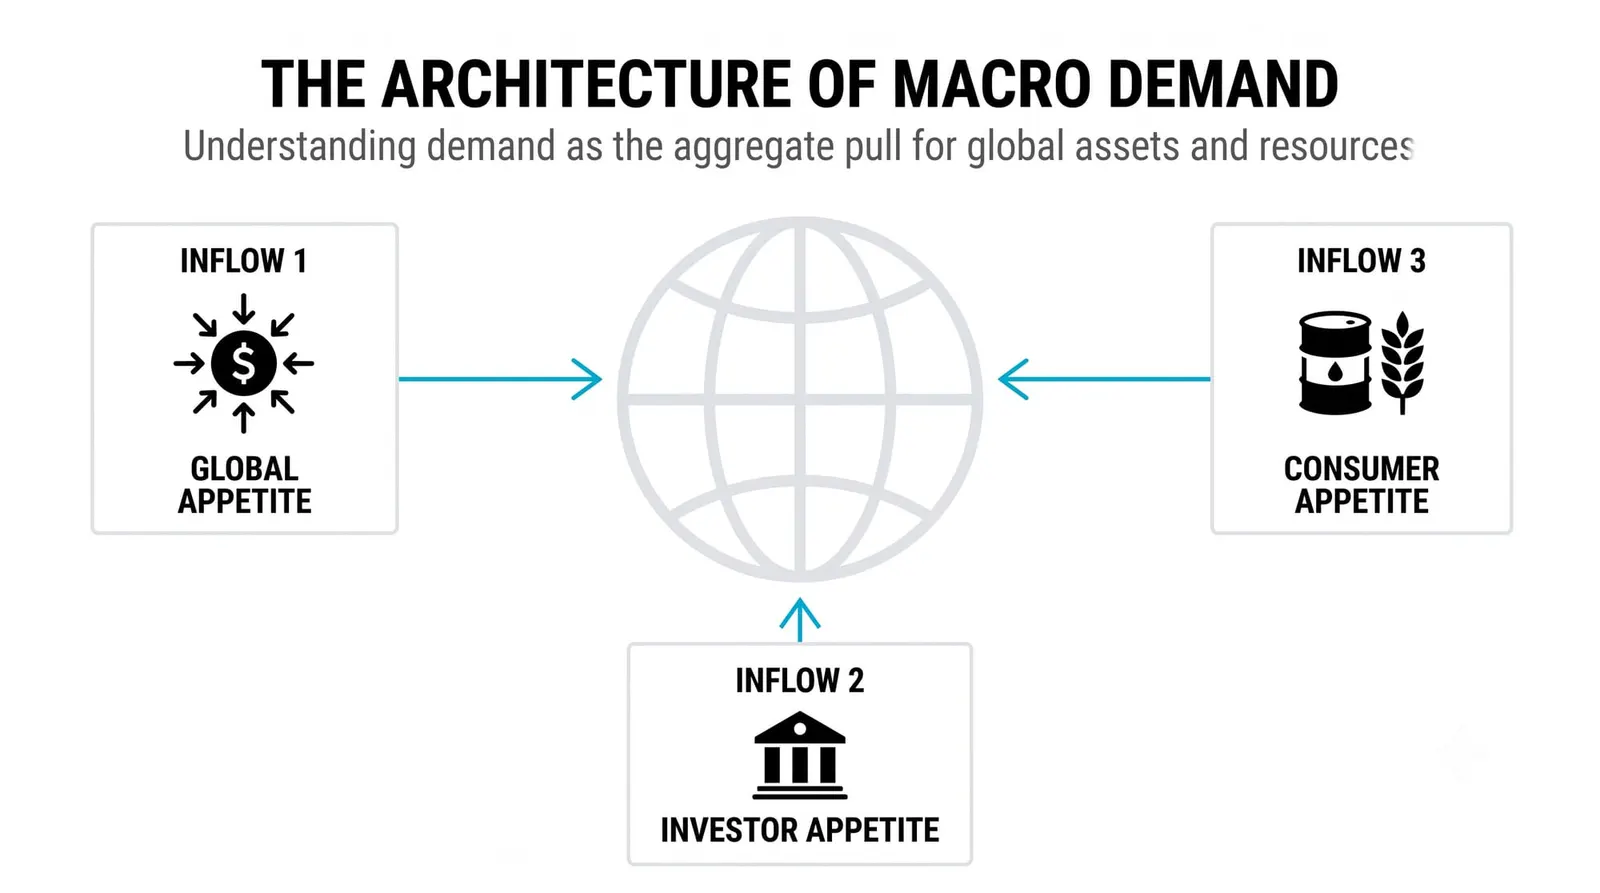
Demand has four big components, and together they account for nearly all spending in an economy.
- Consumer spending. Households buying food, rent, cars, services. In most developed economies this is the largest single block.
- Business investment. Firms buying equipment, software, and buildings, and hiring to expand.
- Government spending. Everything from salaries to infrastructure projects, set by budgets rather than by confidence.
- Foreign demand. What the rest of the world spends on a country's exports.
Unlike supply, demand moves fast. Confidence can crack in a quarter. A rate cut can loosen credit within months. A government can pass a spending package in a single session. Consumers can pull back the moment headlines turn grim.
So you have a slow side and a fast side. Supply crawls in years; demand swings in months. That mismatch in speed is the engine behind almost every macro story you will study in this level.
Why This Is the Foundation Under Every Driver Ahead
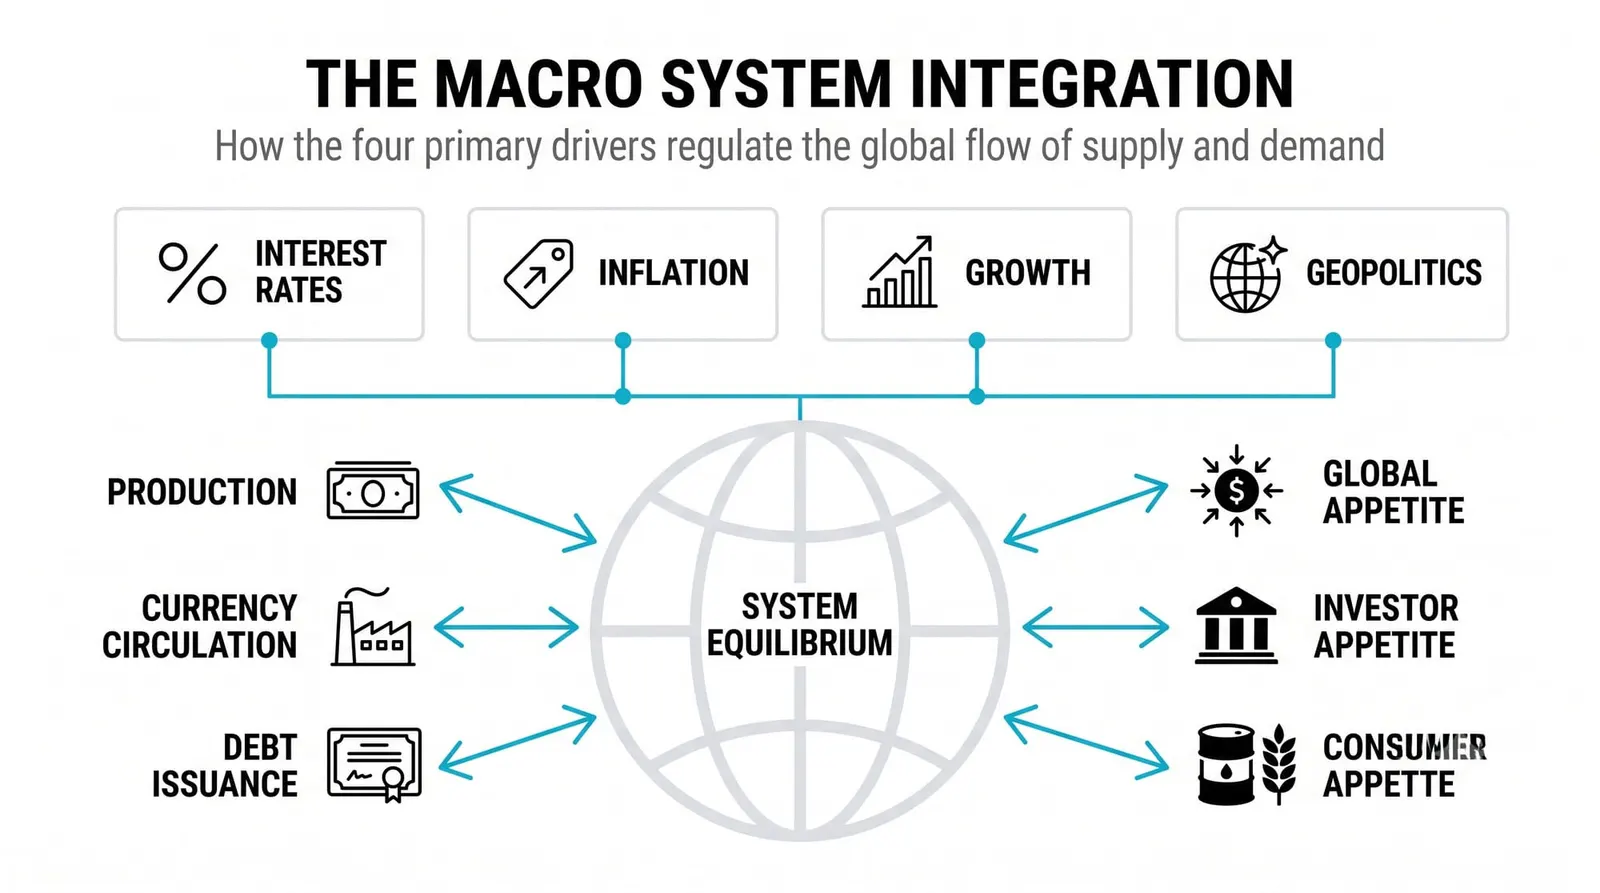
Inflation is what happens when demand outruns supply for long enough. More spending chases a quantity of goods that cannot grow quickly, so prices absorb the difference. That is the mechanic at the core, even though later lessons will add detail about money supply, expectations, and wages.
Recessions are the mirror. Demand collapses while supply, built over years, keeps producing. Factories run below capacity, workers get laid off, and prices soften or fall. The seesaw tips the other way.
Every later lesson in this level sits on this frame. Interest rates are a tool for pressing on the demand side. Employment reports measure how fully the supply of labor is being used. Currency moves partly reflect which country's demand-supply balance looks healthier. If you hold the seesaw clearly, each new topic becomes a detail attached to a structure you already understand, rather than a new pile of facts.
Skip this foundation and the rest of the level turns into memorized definitions. Build it properly and the rest becomes cause and effect.
Too Much Money, Too Few Goods
Here is a purely hypothetical economy with round numbers, built only to show the mechanics.
Imagine total demand in this economy grows 10 percent over two years. Credit is loose, consumers feel confident, and the government is spending. Over the same two years, supply can only grow about 3 percent a year, because that is how fast the workforce and factory capacity expand.
That gap does not disappear. It has to show up somewhere, and it shows up in three places:
- Rising prices. Buyers compete for a limited pool of goods, so sellers charge more. This is inflation doing its basic work.
- Longer lead times. Orders pile up faster than factories can fill them. Delivery waits stretch from weeks to months.
- Wage pressure. Firms competing for a fixed pool of workers bid pay upward, which feeds back into costs and prices.
Now flip the seesaw. Same economy, but demand falls 5 percent while supply keeps producing at its built-up capacity. The gap reappears on the other side:
- Discounts. Sellers cut prices to move inventory that buyers no longer want at full price.
- Idle capacity. Machines and floor space sit unused because running them costs more than the output earns.
- Layoffs. Labor is part of supply, and when demand shrinks, firms release workers they no longer need.
Same economy, same machinery, same people. The only thing that changed was which side of the seesaw carried more weight. Prices, lead times, and jobs are just the visible readings of that tilt.
| Concept | What it includes | How fast it moves | What the gap produces |
|---|---|---|---|
| Macro supply | Labor force, factory and infrastructure capacity, credit, commodities and goods | Slowly, over years | Sets the ceiling on sustainable growth |
| Macro demand | Consumer spending, business investment, government spending, foreign demand for exports | Quickly, in months | Sets the pace of spending against that ceiling |
| Demand outruns supply | Spending grows faster than output can | Gap builds over quarters | Rising prices, longer lead times, wage pressure |
| Supply outruns demand | Output continues while spending falls | Gap builds over quarters | Discounts, idle capacity, layoffs |
Macro Supply and Demand, Answered
Can supply and demand move at the same speed?
Rarely, and only for short stretches. Supply is constrained by physical build times and demographics, so it trends slowly. Demand responds to confidence, credit, and policy, so it swings faster. When the two happen to grow in step, you get the quiet, stable periods economists call balanced growth, and they tend not to last.
Which side moves prices faster?
Demand moves prices faster in the short run, because it can shift within months while supply cannot. Over longer horizons, supply dominates: an economy's productive capacity decides where prices and living standards settle once the demand swings wash out. Traders feel the demand side first; historians credit the supply side.
Does this apply to currencies too?
Yes. A currency's value reflects demand for it, driven by trade flows, investment flows, and rate expectations, against its supply, which central banks and banking systems influence. The same seesaw logic applies, which is why the lessons on currencies later in this level will feel familiar once this frame is in place.
Where do I watch these numbers?
Watch the standard releases: GDP reports for total output and spending, employment reports for labor supply and usage, inflation readings for the price gap, and industrial production or capacity utilization for the supply side. You do not need to forecast them. You need to read them as measurements of which way the seesaw is tilting.
Next in this level comes the price of the gap you just learned to read: inflation, what it measures, and why every trader watches it.