Hidden Divergence: The Continuation Signal
Most traders learn divergence as a reversal tool: price stretches to a new extreme, momentum declines to confirm, and the fade is on. That is one half of the family. The other half prints nowhere near an extreme. It prints one pullback into an established trend, and it says the opposite thing: keep riding. This is hidden divergence, and its whole job is trend continuation.

The distinction sorts itself by location. In the universal divergence lesson, the two families were introduced side by side: regular divergence appears at swing extremes and flags exhaustion, while hidden divergence appears inside pullbacks and flags continuation. This lesson stays with the second family and works it properly, because a trend follower who can read a pullback gets earlier and cleaner entries than one who waits for the trend to prove itself again on price alone. The continuation versus reversal decision is the most consequential one on a chart, and hidden divergence is one of the few momentum readings that speaks directly to it.
What Hidden Divergence Actually Says
Divergence means price and a momentum oscillator disagree about the same swing. During a pullback in an uptrend, price makes a higher low: sellers pushed price down, but they could not reach the previous low. Now check what the oscillator did across those same two lows. If the oscillator made a lower low, it fell harder than price did. The sellers, in momentum terms, got weaker results out of a stronger-looking effort. That mismatch, price holding higher while momentum sinks, is hidden bullish divergence.
The mirror image works in a downtrend. Price rallies off the low and makes a lower high: buyers could not push through the old high. If the oscillator across those two highs makes a higher high, the buyers got a bigger momentum result out of a weaker price effort. The trend's underside is stronger than the price chart admits. That is hidden bearish divergence, and it says the downtrend probably has more room.
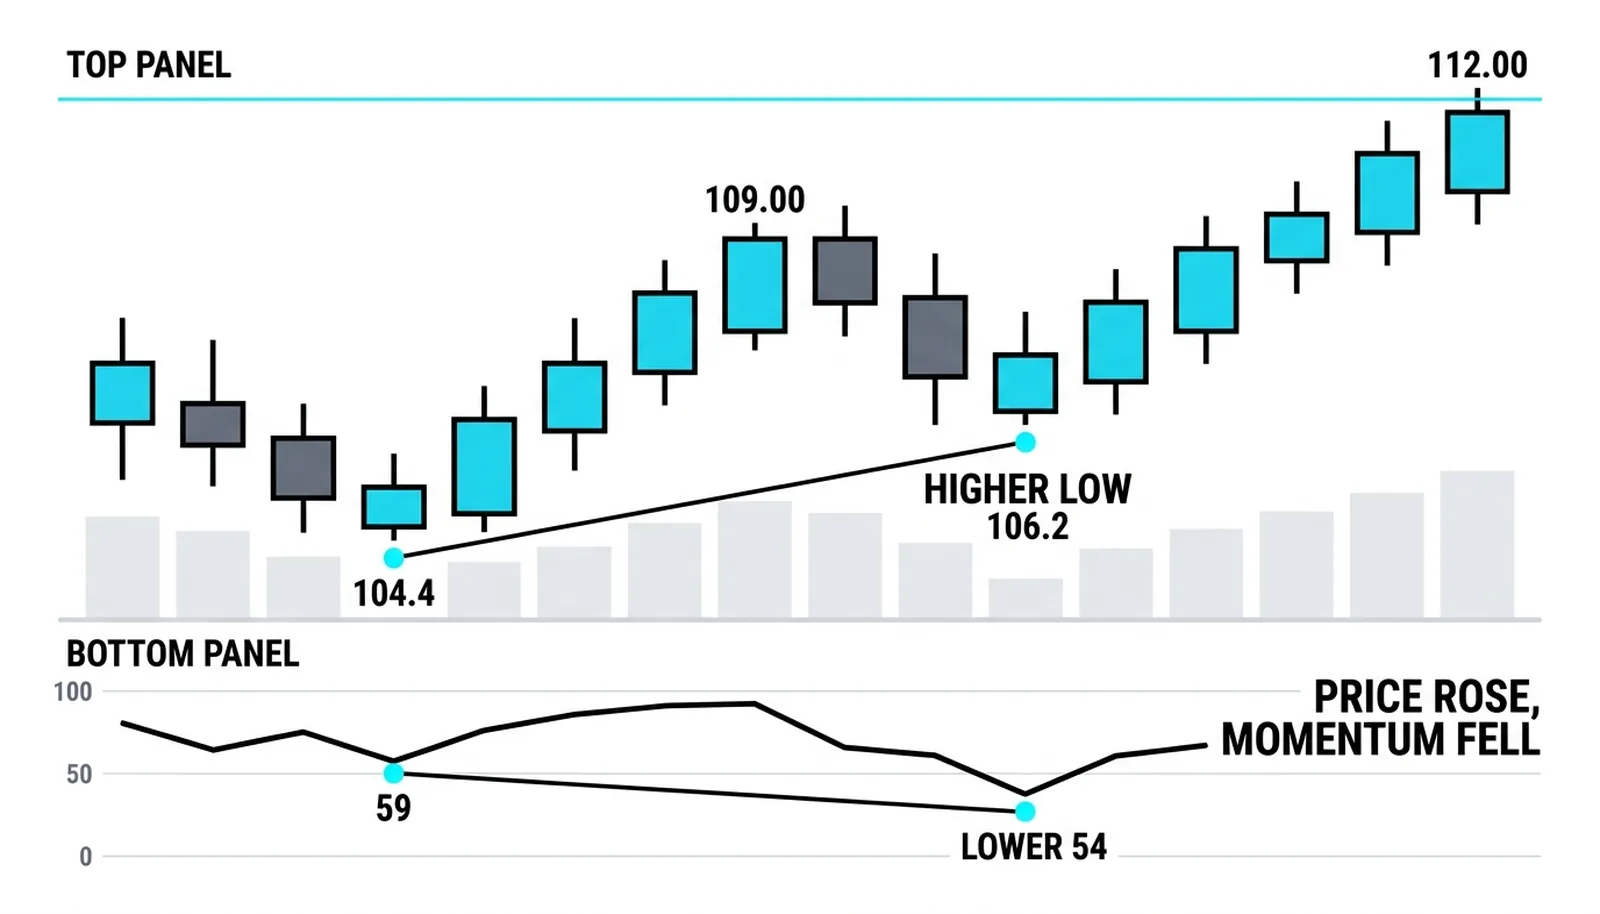
The chart above shows the anatomy. Price bottoms at 104.4, rallies, and pulls back to 106.2: a higher low by almost two points. The RSI underneath does the opposite. Its first bottom reads 59, its second reads 54, nearly five points lower. The price low rose, the momentum low fell, and that spread is the entire signal. Note where it printed: not at a top, not at a bottom, but in the ordinary middle of an uptrend, which is exactly the point. Regular divergence lives at extremes; hidden divergence lives in pullbacks.
The Four Families at a Glance
Because the two families share a mechanism and differ only in location, the cleanest reference is a single map of all four combinations.
| Type | Price does | Oscillator does | Trend context | Message |
|---|---|---|---|---|
| Regular bullish | Lower low | Higher low | End of downtrend | Possible reversal up |
| Regular bearish | Higher high | Lower high | End of uptrend | Possible reversal down |
| Hidden bullish | Higher low | Lower low | Pullback in uptrend | Continuation up |
| Hidden bearish | Lower high | Higher high | Pullback in downtrend | Continuation down |
One reading habit prevents most mix-ups. Identify the trend first, then read the divergence. The same two-swing comparison flips meaning entirely depending on whether it printed at an extreme or inside a retracement, and the trend is what tells you which one you are looking at. The chart below puts the two habitats side by side: the same market, the disagreement at the terminal extreme on the upper panel, and the disagreement one pullback in on the lower panel.
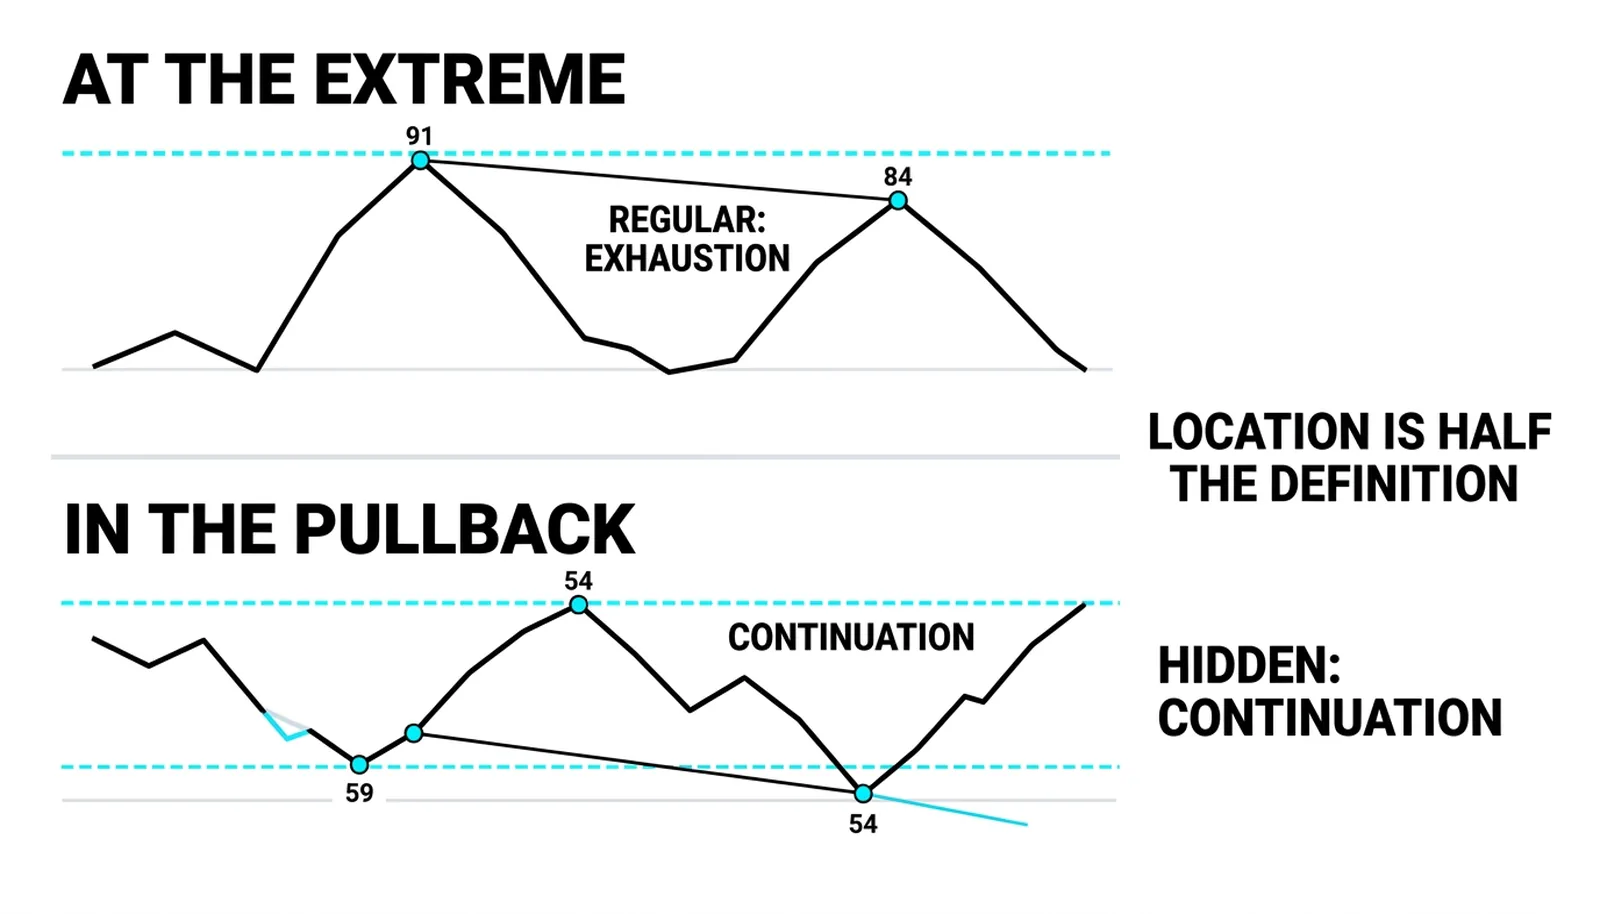
Where a signal prints is not scenery; it is half the definition. The indicator-specific versions of this logic, on RSI and on the stochastic, follow the same map; only the thresholds and the smoothing differ.
Why Pullback Signals Suit Trend Followers
A reversal divergence asks you to bet against the current trend, which means the signal can fire several times before the trend actually breaks. A continuation divergence asks the opposite: confirm that pullback selling is weak, and enter with the trend at a better price than the last swing offered. The risk positioning is friendlier too. Entering near a pullback low puts the invalidation point, the level that says the trend failed, just below the entry, rather than a full trend width away.
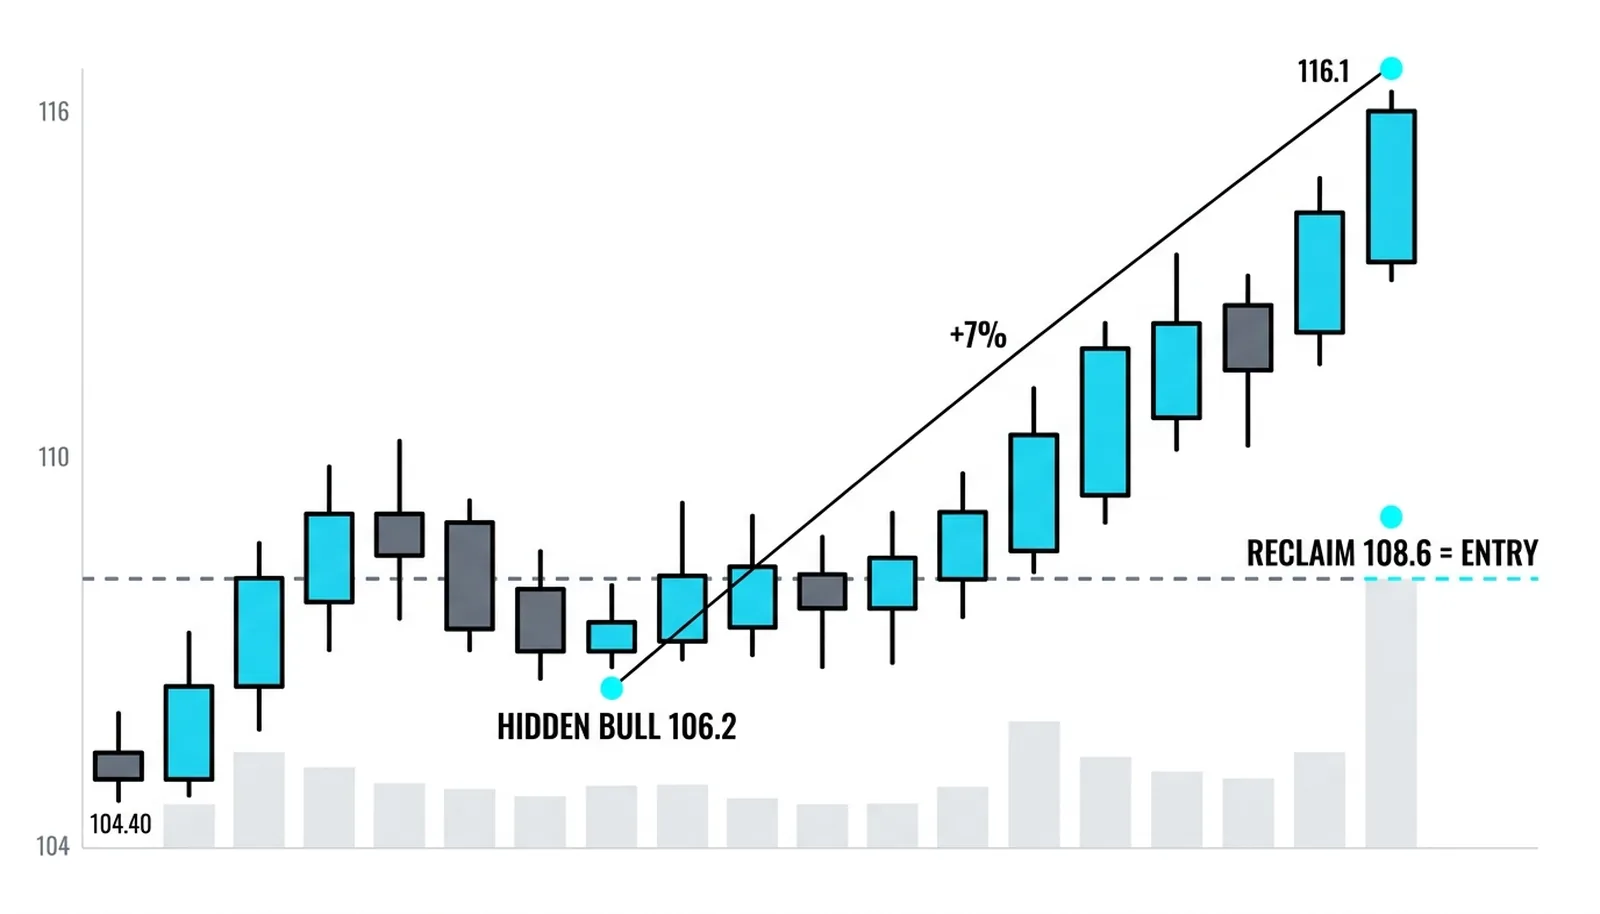
Think of the pullback as a load test on a bridge: engineers drive trucks heavier than any traffic the span will ever carry, and the deck holding under that load is what certifies it for service. Hidden divergence is the certificate: the selling load pressed harder in momentum terms, and the price structure held anyway. The chart from the anatomy section carries through: after the 106.2 higher low with RSI at 54, the advance retook the entry zone near 108.6 and ran to 116.1, a gain of almost seven percent while the pullback itself had retraced only a fraction of the trend.
Reading It Without Fooling Yourself
Three disciplines keep hidden divergence honest. First, demand a real trend before hunting for it. Hidden divergence in a directionless market is noise wearing a pattern's clothes; the signal's premise is that a trend exists to continue. Second, use major swing points on both series. The price higher low should be an obvious pivot that any chart reader would mark, and the oscillator bottoms should sit under those same pivots, vertically aligned. A divergence built on minor wiggles predicts nothing. Third, let price confirm before committing fully. The signal completes when the pullback ends and price turns back in the trend direction; the divergence warns you the pullback is weak, and the turn tells you it is over.
Timeframe matters here the same way it does everywhere in divergence work. Higher timeframes produce fewer, cleaner pullback divergences; fast charts produce them constantly and most mean nothing. If a setup only exists on a five-minute chart, treat it as a fraction of a setup.
Where Traders Go Wrong
The classic error is direction confusion: spotting a mismatch at a pullback low, calling it bullish reversal divergence, and buying what is actually a hidden continuation signal in a downtrend pullback. The quadrant map above is the antidote; check the trend before naming the signal. The second error is trading the divergence as an entry trigger by itself. Divergence describes a condition, momentum behaving oddly relative to price; the entry still comes from price structure, a broken micro-trendline, a reclaimed level, or a simple close back in the trend direction. The third error is expecting continuation signals to survive any trend. A hidden divergence against a headline shock, a gap, or a parabolic move is a coin flip; momentum tools measure normal conditions, and shocks break normality.
Used with those guards, the signal does one job well: it tells a trend follower that the pullback in front of them is weak relative to the trend, early enough to act on. That is a narrower promise than the reversal signals make, and it is a more deliverable one.
Hidden Divergence, Answered
How is hidden divergence different from regular divergence?
Location and message. Regular divergence prints at swing extremes and suggests the move is exhausting; hidden divergence prints inside pullbacks and suggests the trend will resume. Price makes the opposite pattern in each: lower lows with higher oscillator lows at reversals, higher lows with lower oscillator lows in bullish continuations.
Which indicators can show hidden divergence?
Any bounded momentum oscillator: RSI, the stochastic, MACD, CCI. The mechanics only require that the indicator measures momentum over a lookback, so a deeper pullback prints a lower reading even when price holds higher. Unbounded or price-derived tools like moving averages cannot produce it.
Does hidden divergence work in a range?
Poorly. The premise is a trend worth continuing, and a range has none. In sideways conditions the signal degrades into noise, which is why the trend check comes before the divergence check.
Should the entry wait for confirmation?
Yes. The divergence is the warning that pullback sellers are weak; the entry trigger is price turning back in the trend direction, such as a close above the pullback's declining line or a break of the last minor high. Entering on the divergence alone means catching a falling knife with extra steps.