Reading a Chart Like a Story
Reading a chart like a story means starting at the left edge and moving right, asking at every swing who is winning, whether anything changed, and what buyers and sellers are likely to do next. The chart only reads in one direction. You are not forecasting an ending; you are following a plot that is still being written.

A chart is a story that only reads forward; every swing is a plot point, and skipping ahead is where readers get lost. Most losing trades come from readers who jumped to the last page and guessed. This lesson is about the reading method itself: sequence, cause and effect, context, and updating. No patterns, no indicators, no candle anatomy. Just how to read.
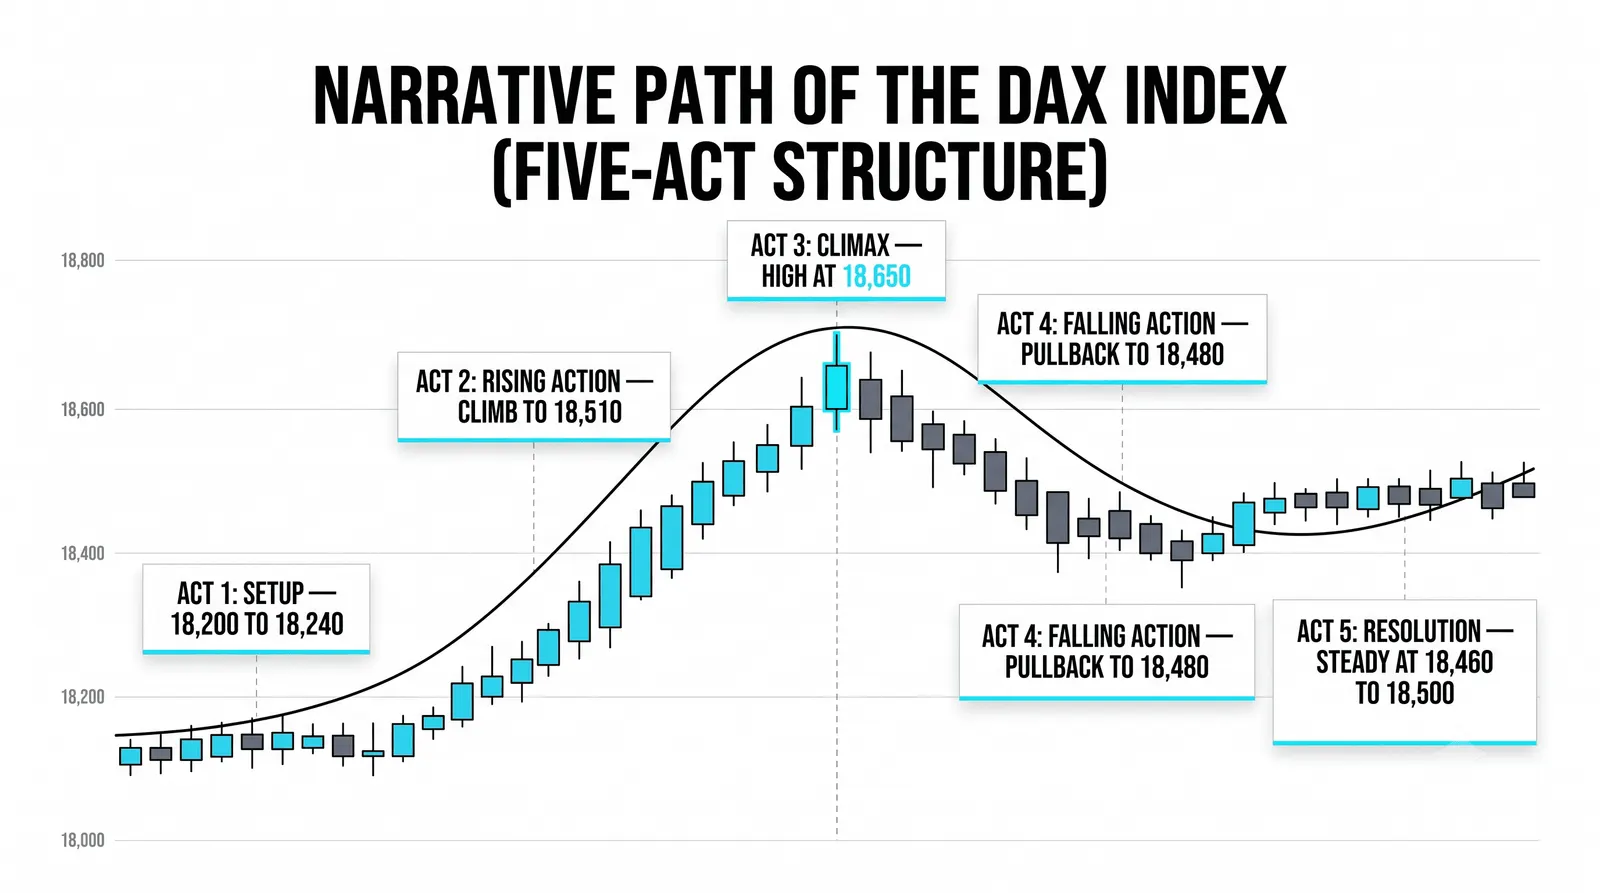
Left to Right, In Order
The chart only makes sense in sequence. The newest candle is a consequence of everything printed before it. Price sits where it sits because of a chain of events, and you cannot understand the last link without the chain.
Most beginners open a chart and stare at the right edge. They see the current price, form an opinion in three seconds, and start hunting for a reason to click buy. That is reading the last sentence of a chapter and claiming you know the book.
Read from the left instead. Start far enough back that you can see the major swings. Move right one leg at a time. At each swing high and swing low, pause and note what happened: who pushed, who absorbed, who gave up. By the time you reach the right edge, the current price is no longer a mystery. It is the latest sentence in a paragraph you actually read.
This feels slow the first twenty times. Then it becomes fast, because your eyes learn the route. Experienced traders still read left to right; they have just done it ten thousand times.
Cause and Effect
Every move on a chart is a response to the move before it. A breakout causes follow-through, or it causes a failure. A failed rally causes sellers to press harder. A sharp drop causes bargain buyers to test the water. Nothing happens in isolation.
At each plot point, ask three questions:
- Who won? Did buyers or sellers control this swing? Look at where the move started and where it ended, not at the noise in between.
- How hard did they win? A rally that covers ground quickly and holds it is a strong argument. A rally that grinds, stalls, and gives half of it back is a weak one.
- What did it cost them? If buyers pushed price up but had to fight through heavy selling the whole way, their win was expensive. Expensive wins tend to get retraced. Cheap wins tend to extend.
These three questions turn a shape on a screen into a sequence of decisions made by real participants. That is the difference between seeing a chart and reading one.
Notice what this excludes. You are not naming patterns. You are not checking an oscillator. You are tracking a contest between two sides and scoring each round. Patterns and tools can come later, and they work better when they sit on top of a read like this.
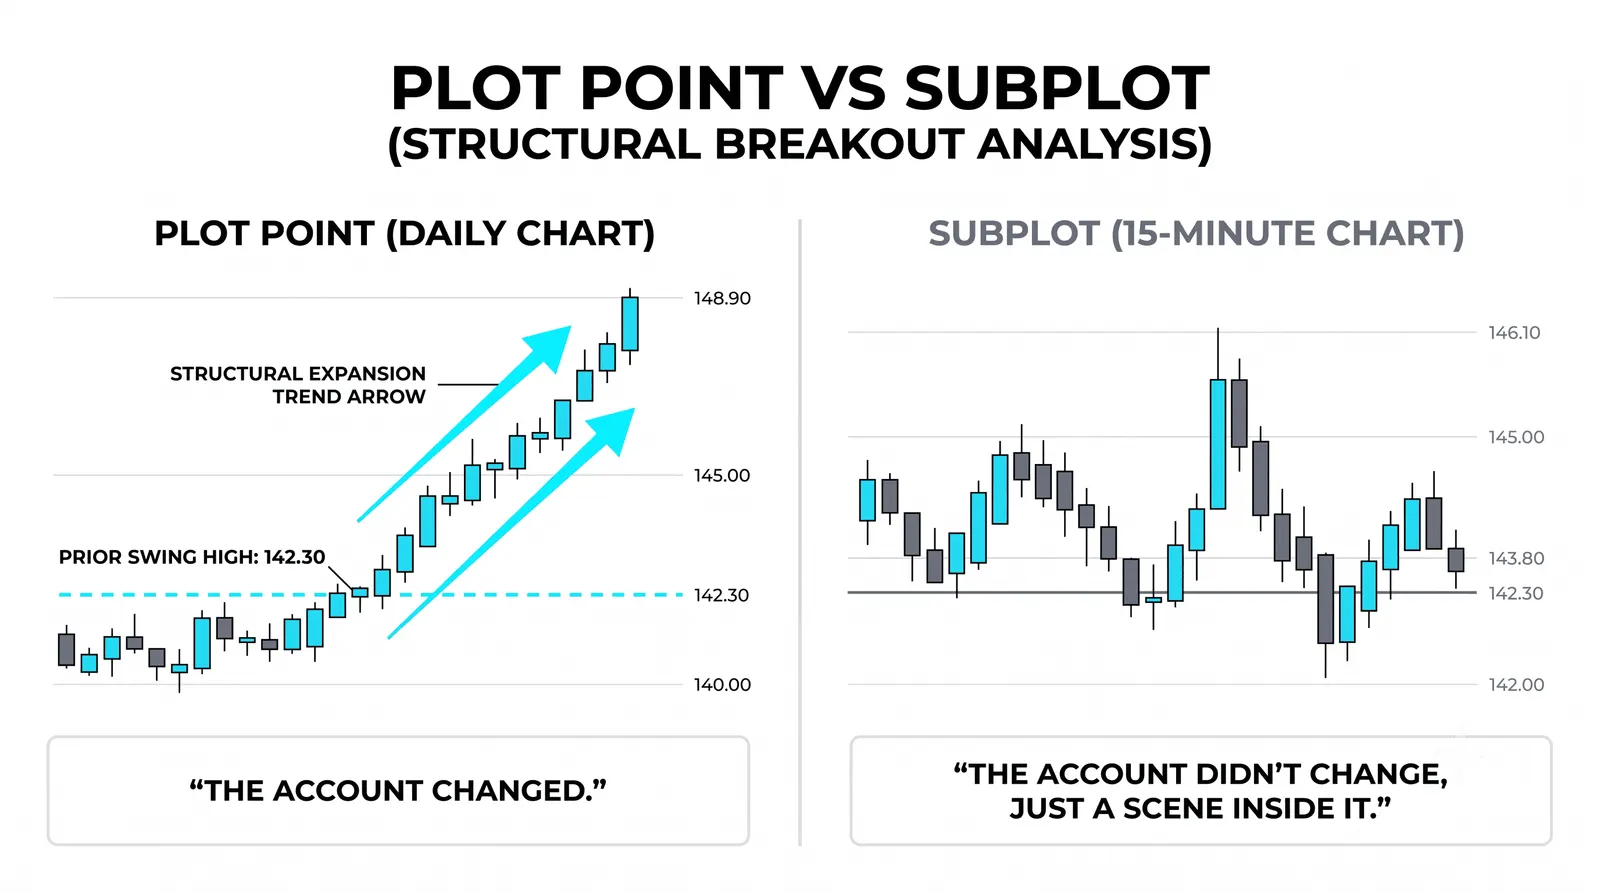
The Story So Far Versus What Happens Next
Here is the honest split. You can summarize the story so far with evidence. You cannot know the ending. Nobody can.
The story so far is factual. Buyers have won every swing for two months: that is observable. The last pullback stopped above the prior breakout: that is observable. Sellers tried twice at a level and failed twice: observable. You can write these things down and defend them with the chart in front of you.
What happens next is a probability at best. The moment you confuse your summary with a prophecy, you stop reading and start hoping.
The trader's version of a summary is a short written statement: who is winning, what evidence supports that, and where the story would be proven wrong. That last part matters most. A good read always includes its own invalidation. "Buyers are in control unless price closes below the last major pullback low" is a complete thought. "Buyers are in control" is half of one.
Write the summary before you trade, not after. If you cannot write it, you have not read the chart. You have glanced at it.
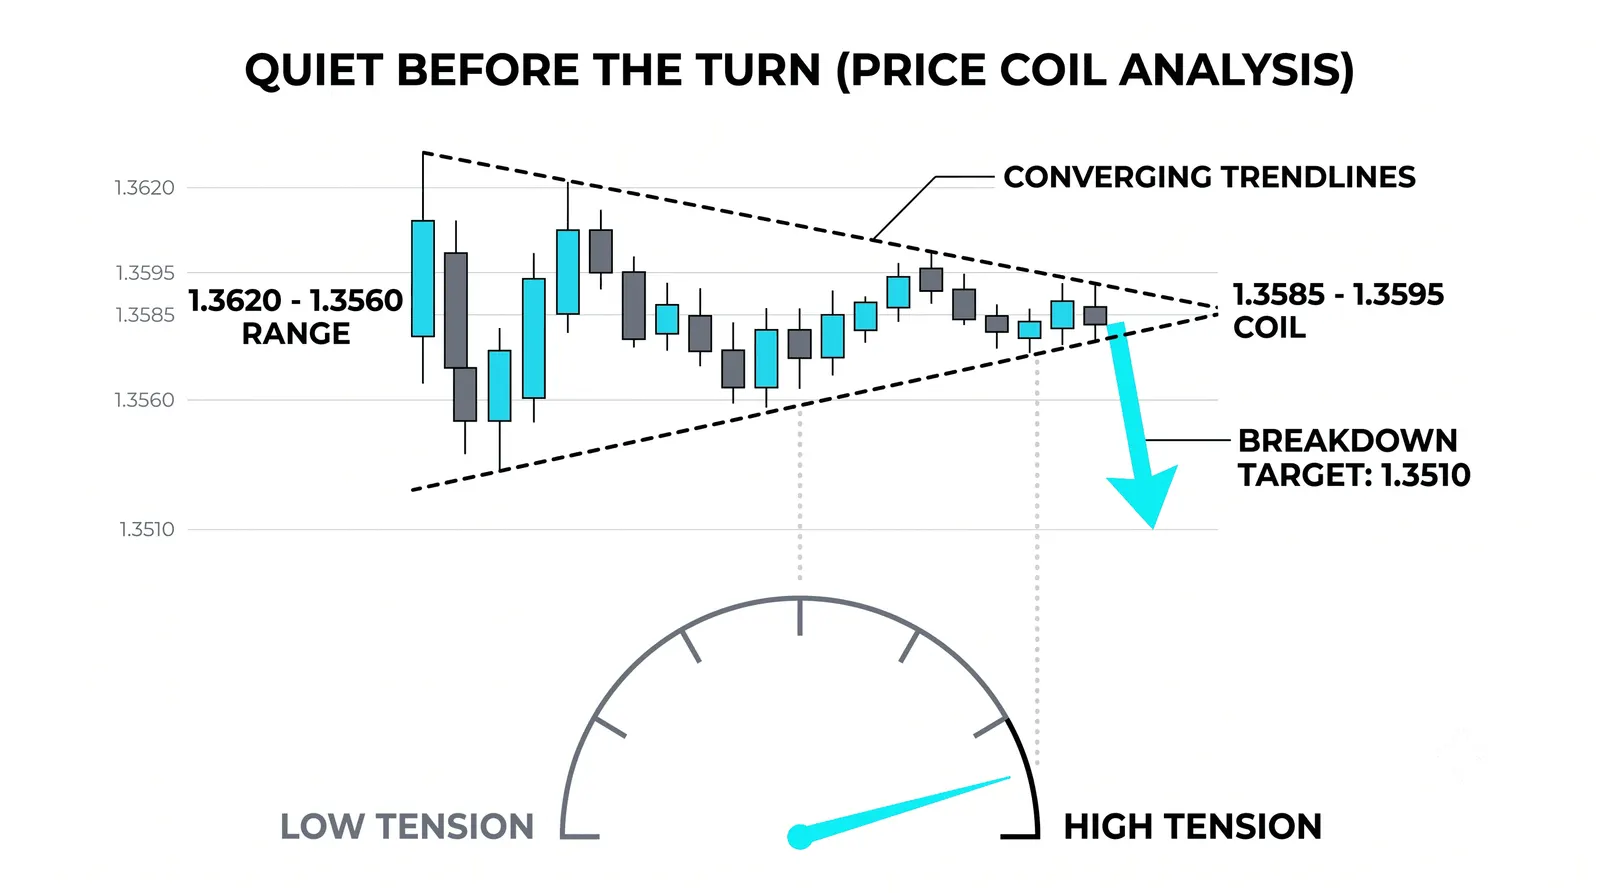
Rereading and Updating
New candles are new chapters. A summary written on Monday can be outdated by Thursday, and updating it is reading, not flip-flopping.
Traders get attached to their first read. They wrote "buyers in control" on Monday, price broke down on Wednesday, and they kept the old summary because changing it felt like admitting a mistake. The mistake was keeping the stale read, not writing the first one.
Build a habit of rereading at fixed intervals. Once a day for swing trades, once per session for intraday work. Ask the same three questions at the newest swings. Compare the answers to your written summary. If the evidence changed, change the summary. If the evidence did not change, do nothing, and let "do nothing" be a decision you made on purpose.
Updating also means deleting. When a level stops mattering because price has moved far away from it, strike it from the summary. A card cluttered with old plot points is as useless as no card at all.
The Summary That Fits on a Card
Here is a hypothetical read, with round numbers, done the way this lesson describes. A stock rallied from 100 to 115 over two months, pulled back to 110 over six sessions, then resumed and reached 118.
Walk it left to right. From 100, buyers pushed price to 115. That is a fifteen-point win over two months, steady rather than frantic. Then sellers took a turn: six sessions down to 110. Note where the decline stopped. The old breakout area near 108 held. Sellers had five points of progress and could not push through the level where buyers originally took control. Then buyers resumed and carried price to 118, a new high.
Now score it with the three questions. Who won? Buyers, across the whole sequence. How hard? They made new highs after the pullback, which is the strongest answer available. What did it cost them? Little; the pullback was shallow relative to the rally and was bought within six sessions.
The card reads:
- Uptrend intact.
- Buyers have won every argument since 100.
- The pullback held above the old breakout near 108.
- Story so far favors buyers.
- A close below 108 changes the plot.
Every sentence on that card is evidence, not a guess. "Uptrend intact" is backed by higher highs and a higher low. "Buyers won every argument" is backed by the sequence of swings. "108 matters" is backed by the fact that sellers were stopped there. And the final line is the invalidation, the price at which the summary stops being true and must be rewritten.
Notice what the card does not say. It does not say the stock will reach 125. It does not say buy. It says who is winning, why, and what would prove the read wrong. Decisions come after the read, and they are only as good as the read underneath them.
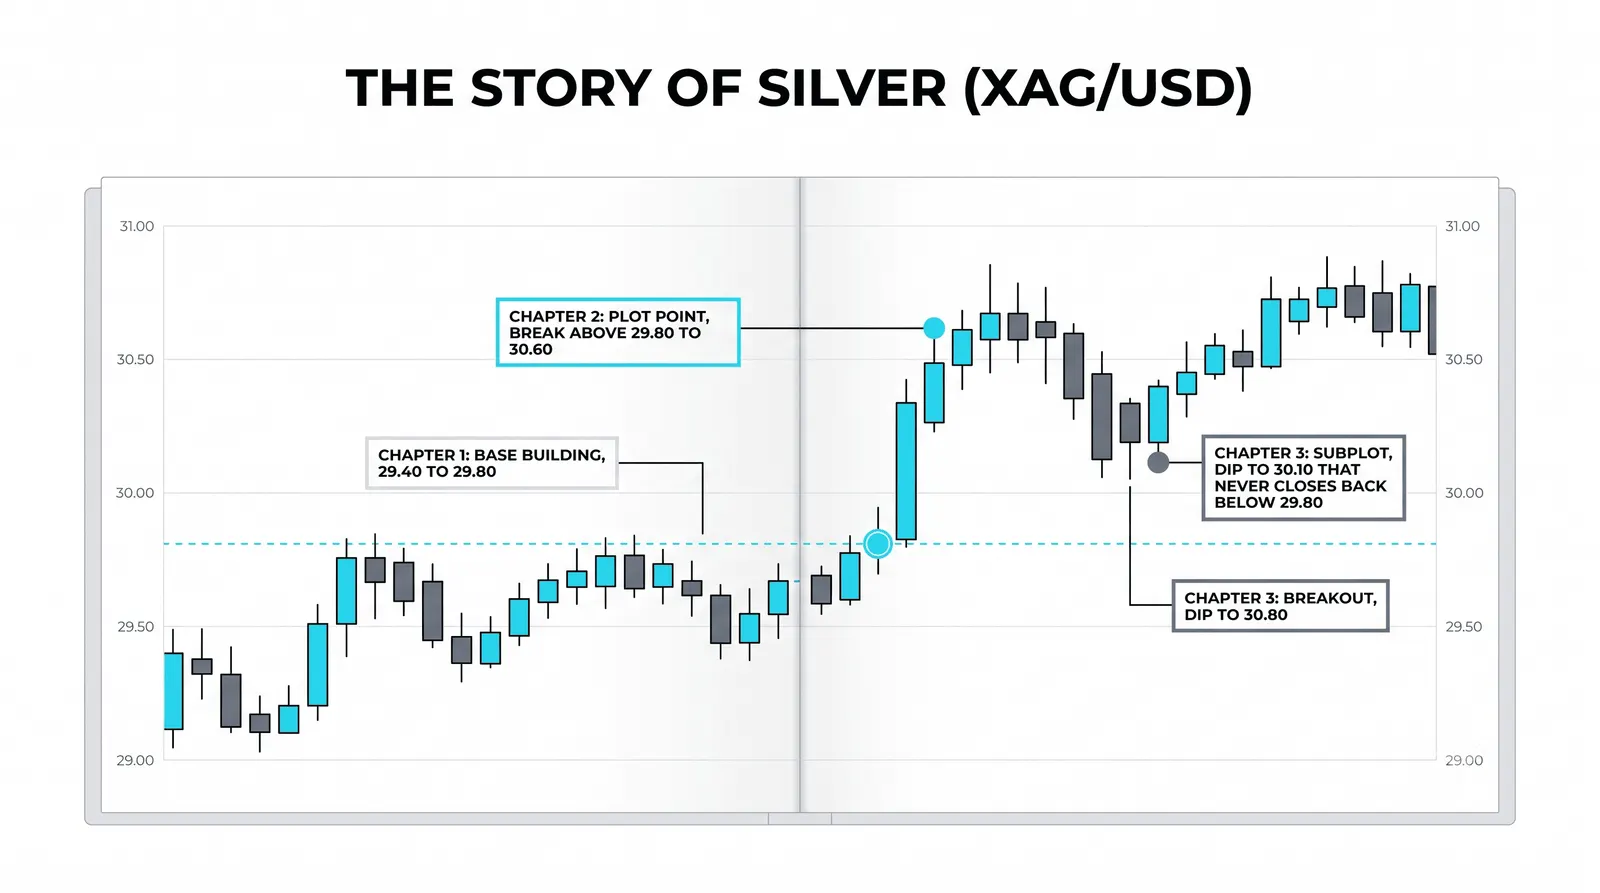
Five sentences. That is enough. If your summary needs two paragraphs, you are describing, not reading.
Reading a Chart, Answered
How far back should I read before the current price?
Far enough to see at least two or three complete swings in each direction, and far enough to find the last time control changed hands. For a swing trade on a daily chart, that usually means several months. If the entire visible chart is one straight move, zoom out until you find the last argument between buyers and sellers.
Can two traders read the same chart differently?
Yes, and it happens constantly, because the chart is the same but the timeframes and summaries differ. A trader reading the last two weeks may correctly conclude sellers are winning while a trader reading the last year correctly concludes buyers are. Both reads can be evidence-based. The disagreements that matter are the ones where one side has no evidence at all.
Does reading replace prediction?
It replaces the need to be right about the future with the discipline of being right about the present. You still form an expectation, but it is conditional: if buyers keep winning, the story continues; if price closes below the level on your card, the story changed. You trade the condition, not the forecast.
What do I do when the story changes mid-position?
You act on the new read, because the position was built on the old one. If your card said "a close below 108 changes the plot" and price closes below 108, the reason for the trade is gone. Exit, reduce, or tighten according to your plan, then rewrite the summary. Holding a trade on a summary you no longer believe is not conviction. It is avoidance.
Next in this level, you will take this reading method up a timeframe and learn how the same story looks different when you change the scale, and why the bigger chart gets the final say.