Switching Timeframes Without Getting Lost
The clean way to switch between timeframes without getting confused is to fix the roles in advance: the higher chart always answers direction, the lower chart only answers timing, and you move between them on a fixed ladder instead of jumping wherever your eyes wander. That single decision removes most of the noise. The rest of this post is about building that ladder and holding it when the market gets loud.

Switching timeframes is a painter stepping back from the canvas: close up you judge brush strokes, from across the room you judge whether the painting works, and the two judgments answer different questions. Traders get into trouble when they ask a brush-stroke question and accept a whole-canvas answer, or the reverse.
Why Flipping Charts Scrambles Decisions
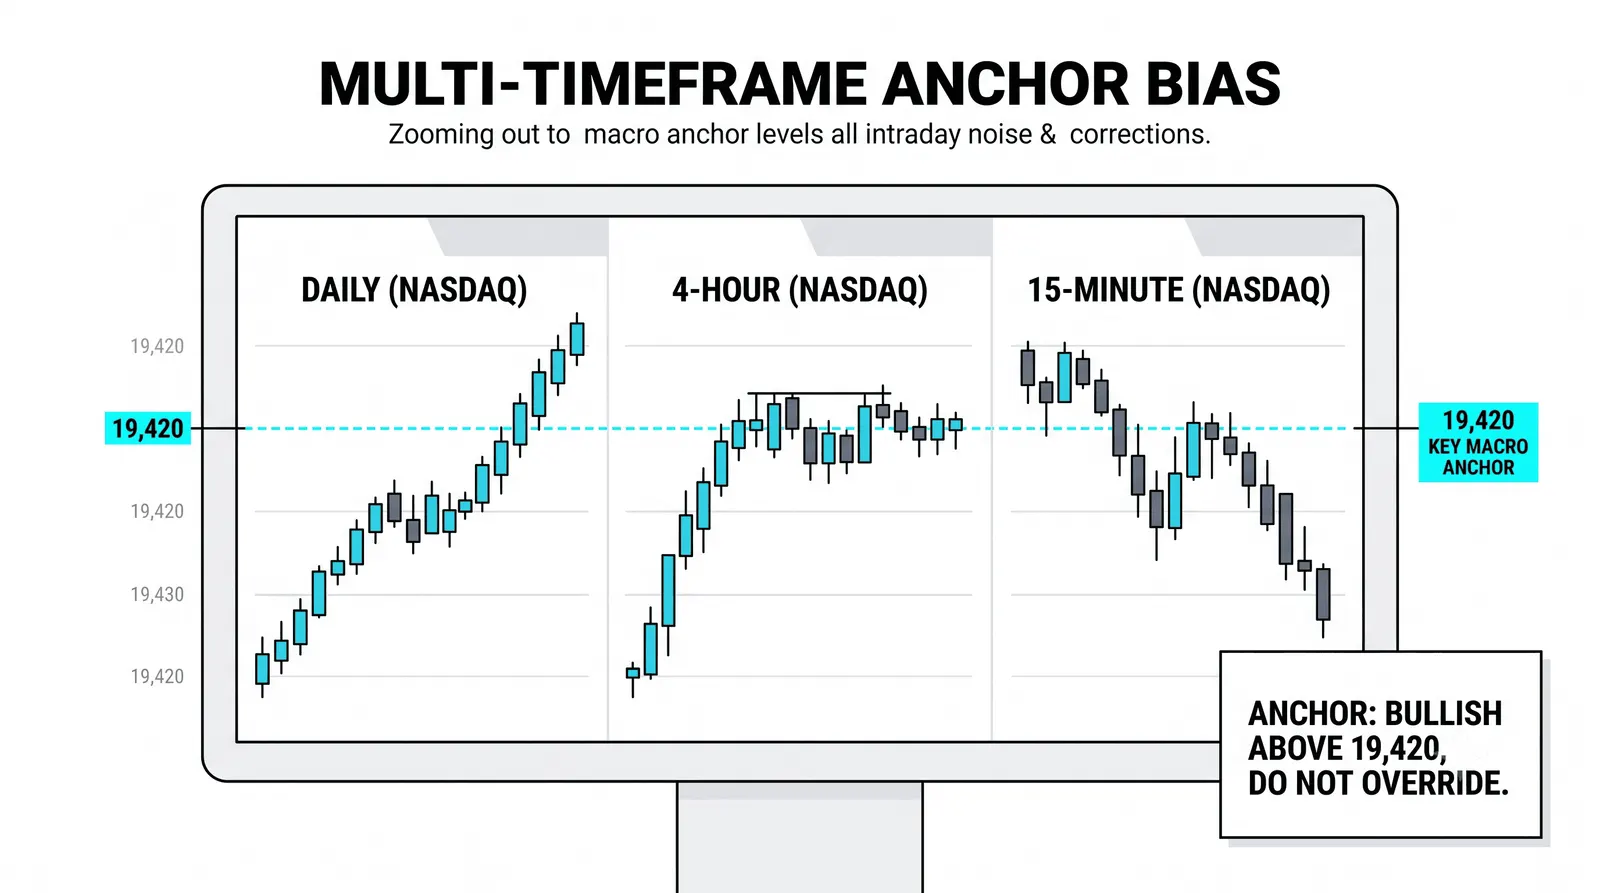
Every timeframe carries its own trend and its own levels. The 15-minute chart can be in a clean downtrend while the daily chart sits in a strong uptrend, and both statements are true at the same time. Neither chart is wrong. They are simply measuring different things.
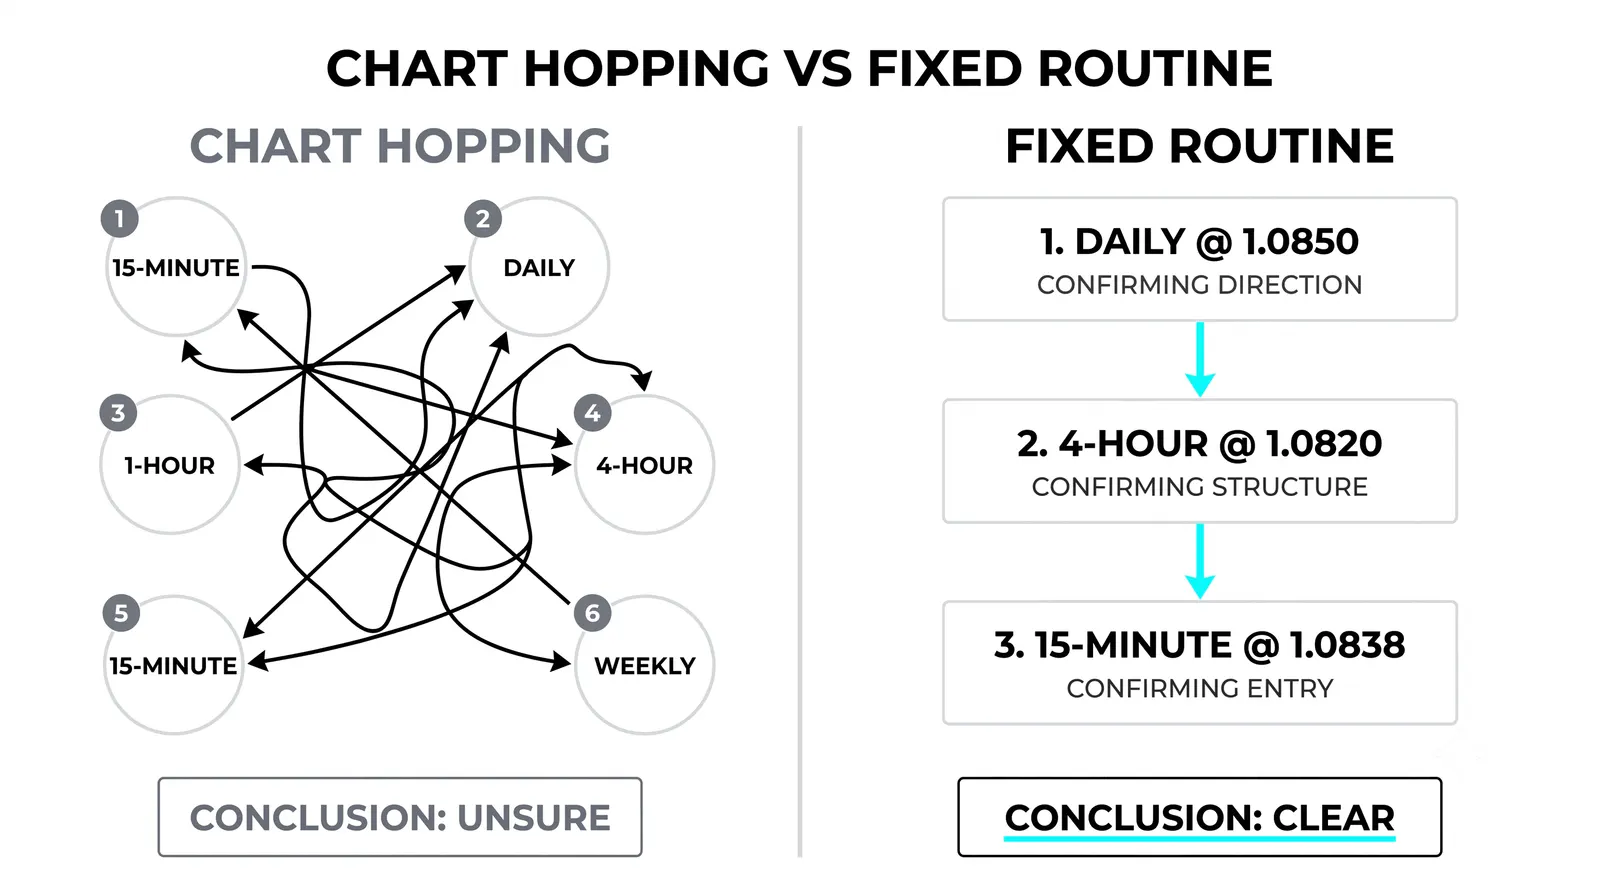
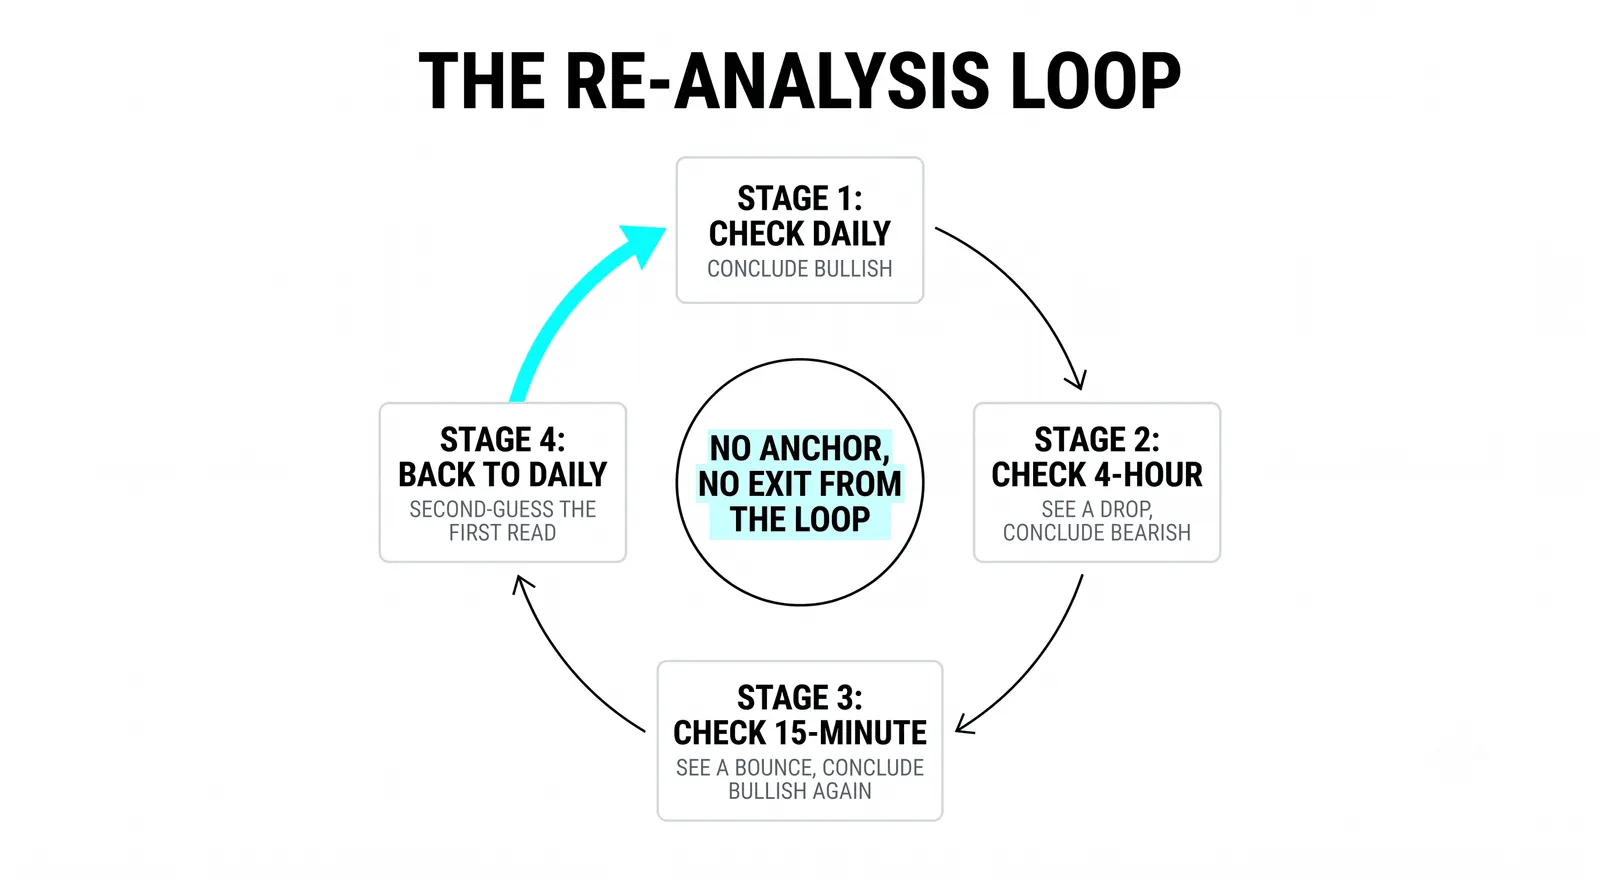
The problem is not the charts. The problem is what you do with them when no roles are assigned. Without fixed jobs for each timeframe, you unconsciously shop for the chart that agrees with the trade you already want. You feel bullish, so you keep flipping until some timeframe, somewhere, shows you a green signal. That is how bias sneaks in pretending to be analysis.
Chart-hopping feels like diligence. It is usually the opposite. Each new chart adds information without adding a decision rule, so you end up with five opinions and no framework for weighing them. Confusion is the natural result, and confused traders either freeze or force a trade to end the discomfort.
The fix is structure decided before the moment arrives, and it beats in-the-moment discipline every time.
The Fixed Ladder
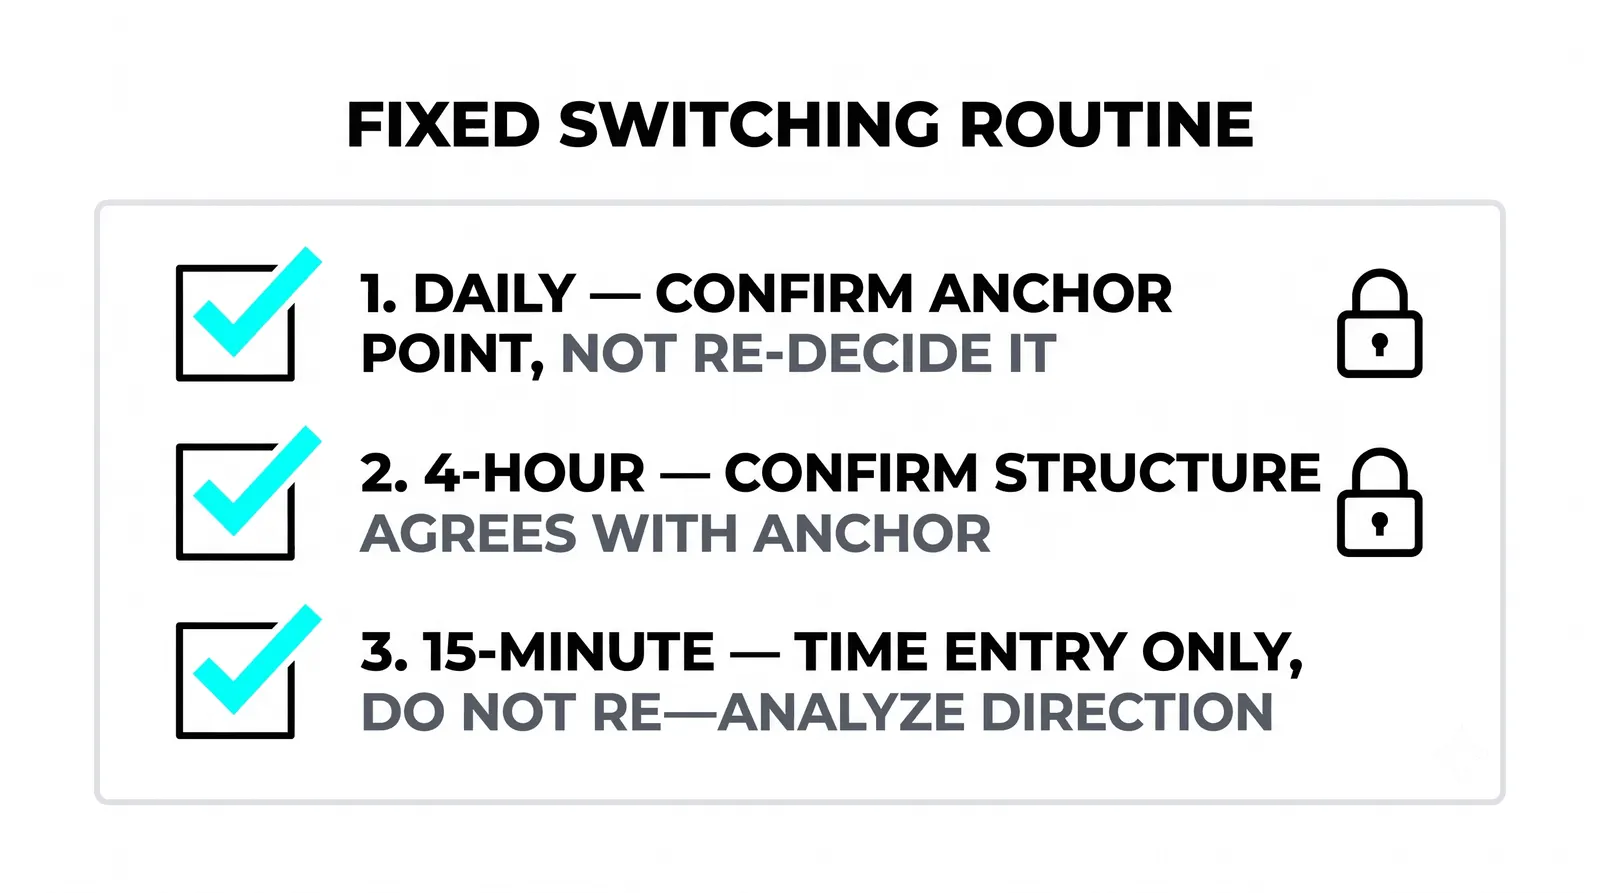
A ladder means each timeframe has one job, and you climb it in the same order every session.
- Weekly, once a week. Open it on the weekend or Monday morning. It answers one question: what is the dominant direction, and where are the major levels? Write the answer down. Then close it.
- Daily, each morning. This chart tells you the current phase (trending, pulling back, ranging) and the nearest level that matters. It converts the weekly bias into a specific area of interest for the day.
- Intraday, only for timing. The 1-hour or 15-minute chart earns your attention only after the first two agree on a scenario. Its sole job is to fine-tune entry, stop, and target placement.
Same order, every session, no exceptions on exciting days. Especially no exceptions on exciting days. Excitement is exactly when traders skip the weekly, find a thrilling intraday pattern, and take a trade straight into a daily resistance level they never looked at.
Think of the ladder as a filter, not a suggestion. If the weekly and daily do not produce a scenario, the intraday chart does not get a vote. You are done analyzing, and the correct position is flat.
Rules That Survive the Switch
Three rules keep the ladder intact when price starts moving fast. Write them somewhere you can see them.
First: the higher chart decides. When timeframes disagree, the higher one wins by default. A bullish daily chart and a bearish 15-minute chart is not a debate. It is an uptrend experiencing a pullback, and your job is to look for where the pullback ends, not to short it because the small chart looks scary.
Second: an intraday signal never overrides a daily level. If the daily chart shows resistance at 50 and your 5-minute chart prints a beautiful breakout at 49.80, the daily level still stands. Intraday patterns are entry tools, not verdicts. The moment you let a small chart cancel a big level, the ladder is gone and you are back to shopping for agreement.
Third: a question about direction never gets answered on the intraday chart. If you catch yourself zooming into the 5-minute to figure out "which way the market is going," stop. That question belongs to the weekly and daily. The intraday chart can only tell you when, never whether.
These rules feel restrictive at first. That feeling is the point. Restriction is what keeps one bad impulse from becoming a bad trade.
A Monday Routine That Holds
Here is a hypothetical week with round numbers to show the ladder working end to end.
Monday morning. The weekly chart says up: higher highs, higher lows, price above the last major swing. The daily chart shows price on day three of a pullback toward support at 42. The ladder's verdict: direction is long, but there is no trade yet. Price has not reached the level, and there is no sign the pullback is finished. So the routine produces one action: set an alert at the daily support of 42 and walk away.
That alert is the routine doing its job. Without it, Monday becomes four hours of watching a pullback and talking yourself into an early entry.
Tuesday. Price trades down into the zone, and the 1-hour chart prints a reversal near 42.40: a strong rejection candle followed by a higher low. Now the intraday chart has earned its say, because the weekly and daily already agreed on direction and location. The entry lands at 43. The stop goes at 41.50, below the daily support level, because the daily level is what the trade is built on. The target is the prior daily high at 47.
The risk is 1.50 per share. The reward is 4.00. That is roughly 2.7 to 1, and every number came from the ladder: direction from the weekly, location from the daily, trigger and stop placement from the intraday. Nothing came from a single chart viewed in isolation.
Notice what the routine also did: it produced a full day of no trade on Monday, and it did so without any willpower. The ladder simply had no answer yet, so there was nothing to decide.
Reading the Combinations
Most confusion comes from mixed signals, so it helps to decide in advance what each combination means. Four combinations cover almost every session.
| Higher Timeframe | Lower Timeframe | Bias | Intraday Action |
|---|---|---|---|
| Up | Down | Long, but patient | Wait for the lower chart to bottom at a higher-timeframe level, then look for long entries |
| Up | Up | Long, aligned | Take long entries on pullbacks; this is the cleanest condition you will get |
| Flat | Any | None | Stand aside or cut size sharply; range conditions punish directional trades |
| Down | Any | Short or flat | Look for short entries on lower-chart rallies into higher-timeframe resistance; never buy dips against it |
The row that saves the most money is the first one. Higher up, lower down feels like conflict, and conflict makes traders freeze or flip their bias. The table reframes it: that combination is the standard setup for a pullback entry. You just have to wait for the lower chart to finish falling.
Switching Timeframes, Answered
Should I ever skip the weekly chart?
No. The weekly takes two minutes and it is the chart that keeps you from fighting the dominant move all week. Skipping it because you "already know the trend" is how traders end up shorting pullbacks inside a strong weekly uptrend. If two minutes of weekly context feels like too much work, the problem is not the chart.
How do I stop myself from chart-hopping mid-session?
Give each timeframe a scheduled window and close the others. Check the daily once in the morning, then work only from your intraday execution chart, with the daily levels marked on it. If you feel the urge to open a new timeframe, write down the question you want it to answer first. Most of the time you will find the question belongs to a chart you already read that morning.
Is this different for day trading?
The structure is identical; only the rungs shift. A day trader might use the daily for direction, the 1-hour for phase and levels, and the 5-minute for timing. The rules do not change: the higher chart decides, small signals never override big levels, and direction questions stay on the higher rungs. Shorter holding periods make the ladder more necessary, not less, because there is less time to recover from a bad read.
What do I do when the ladder gives no answer?
You do nothing, and that is a complete answer. When the weekly is flat, or the daily is mid-range with no level nearby, the ladder is telling you there is no edge worth paying for. Flat is a position. Traders who can sit through a no-answer day keep their capital and their focus for the days when all three rungs line up.
Once the ladder feels mechanical, the next skill worth building is marking higher-timeframe levels so precisely that your intraday chart almost reads itself. That is where structure reading and multi-timeframe thinking merge into one habit, and it is where this process starts paying for the discipline it demands.