Rate of Change (ROC), Explained
Rate of change, or ROC, is the momentum indicator divided by the starting price and multiplied by 100. That is the complete formula. It takes the same raw difference you already know and expresses it as a percent, so a two-dollar move can finally be compared honestly across a 20-dollar market and a 200-dollar one.

Think of it like fuel use quoted per 100 miles instead of per tank: the same consumption, in a unit that lets any two cars compare. Raw momentum quoted the tank. ROC quotes the rate.
Every signal you learned in the momentum lesson carries over to ROC unchanged. Zero-line crosses, divergences, the acceleration story. This lesson adds one thing only: normalization.
The Formula: Momentum, Normalized
ROC equals the close minus the close N bars ago, divided by that older close, times 100. The numerator is exactly the momentum indicator. The division and the multiplication are the new part.
Walk one example. Suppose a market closed at 50 ten bars ago and closes at 55 today. Momentum reads plus 5. ROC divides 5 by 50 and multiplies by 100, giving plus 10 percent.
The identity is worth memorizing: ROC equals momentum divided by the old close, times 100. If you can compute one, you can compute the other in a single extra step.
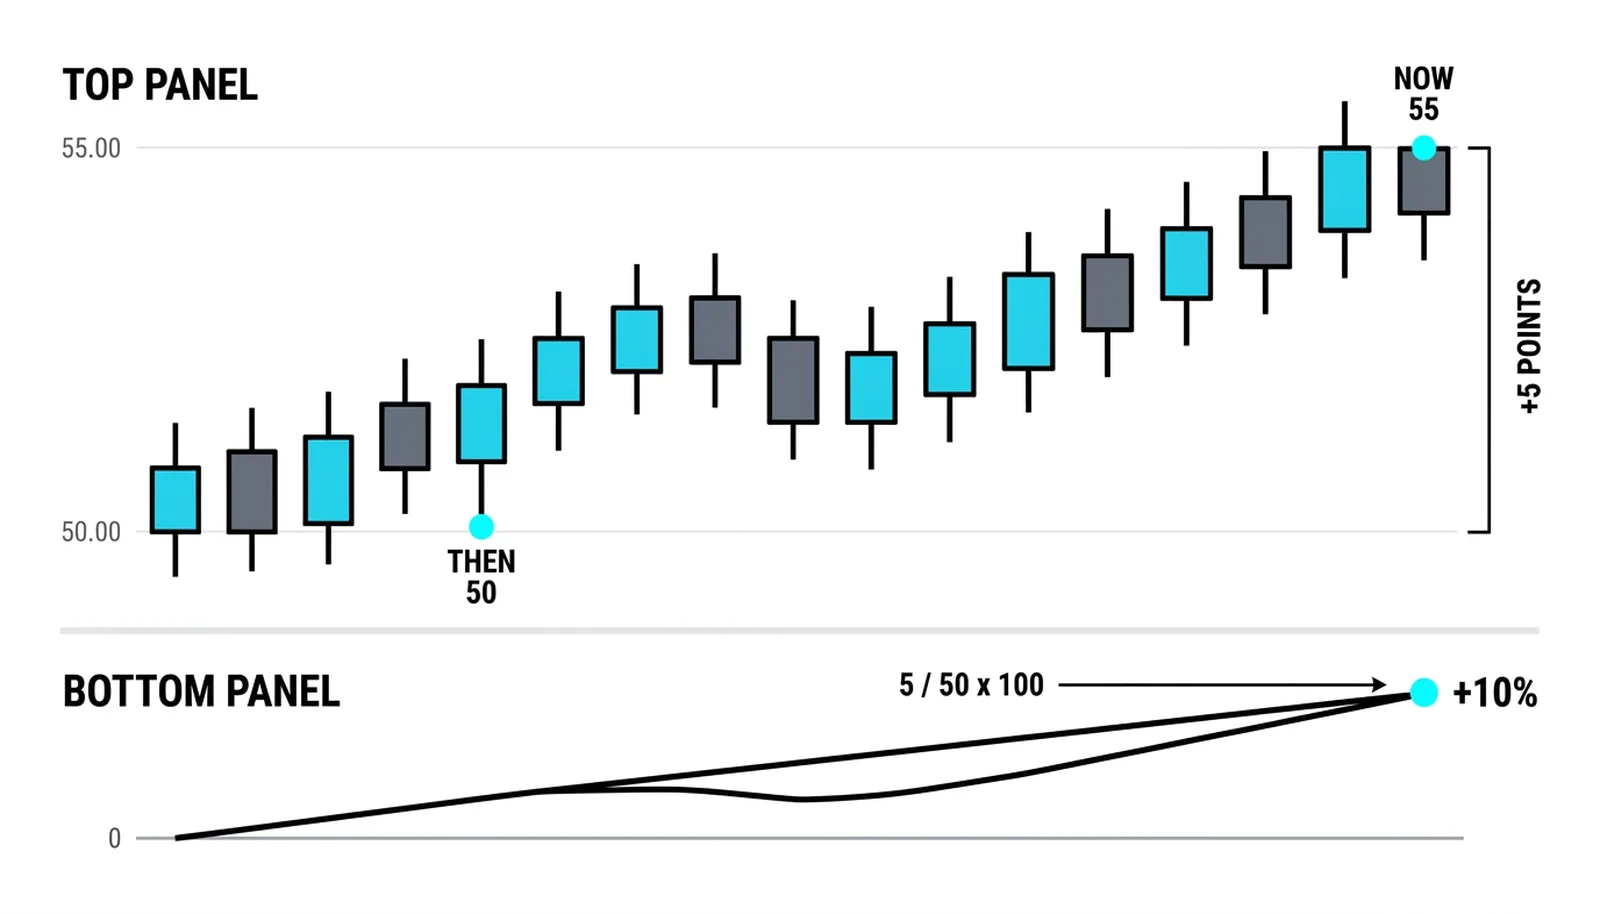
This is why ROC sits in the momentum family from the four categories lesson. It measures speed of price change, nothing else. It just reports that speed in a unit that travels across markets.
Why Percent Beats Points
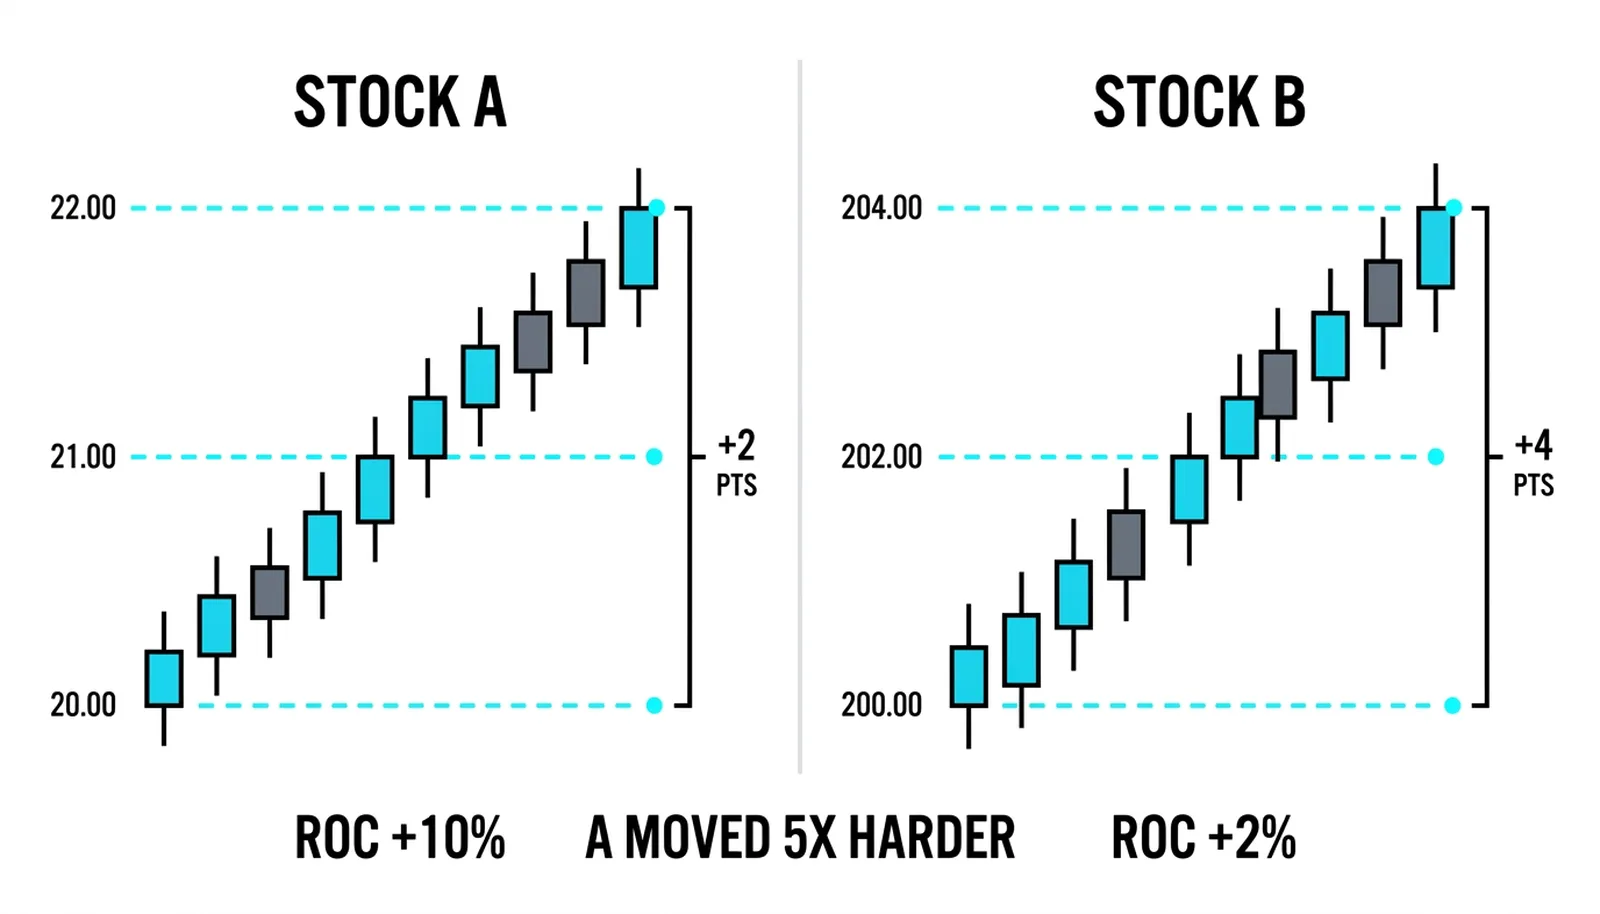
Points lie when prices differ. A plus-2 move on a 20-dollar stock is a 10 percent gain. The same plus-2 move on a 200-dollar stock is a 1 percent gain. Raw momentum ranks them as equal. ROC ranks them correctly, ten to one.
This matters the moment you compare anything. Two stocks in a watchlist, one market across years of price history, a scan for the strongest movers. Raw momentum silently favors high-priced instruments, because big prices produce big point moves by default.
Thresholds stop lying too. A rule like "momentum above 5" means something different on every instrument. A rule like "ROC above 5 percent" means roughly the same thing everywhere, because a percent is a percent.
A 10 percent move in 10 bars is a violent move on almost any market. No raw momentum number could ever make that claim.
The 100-Line Convention
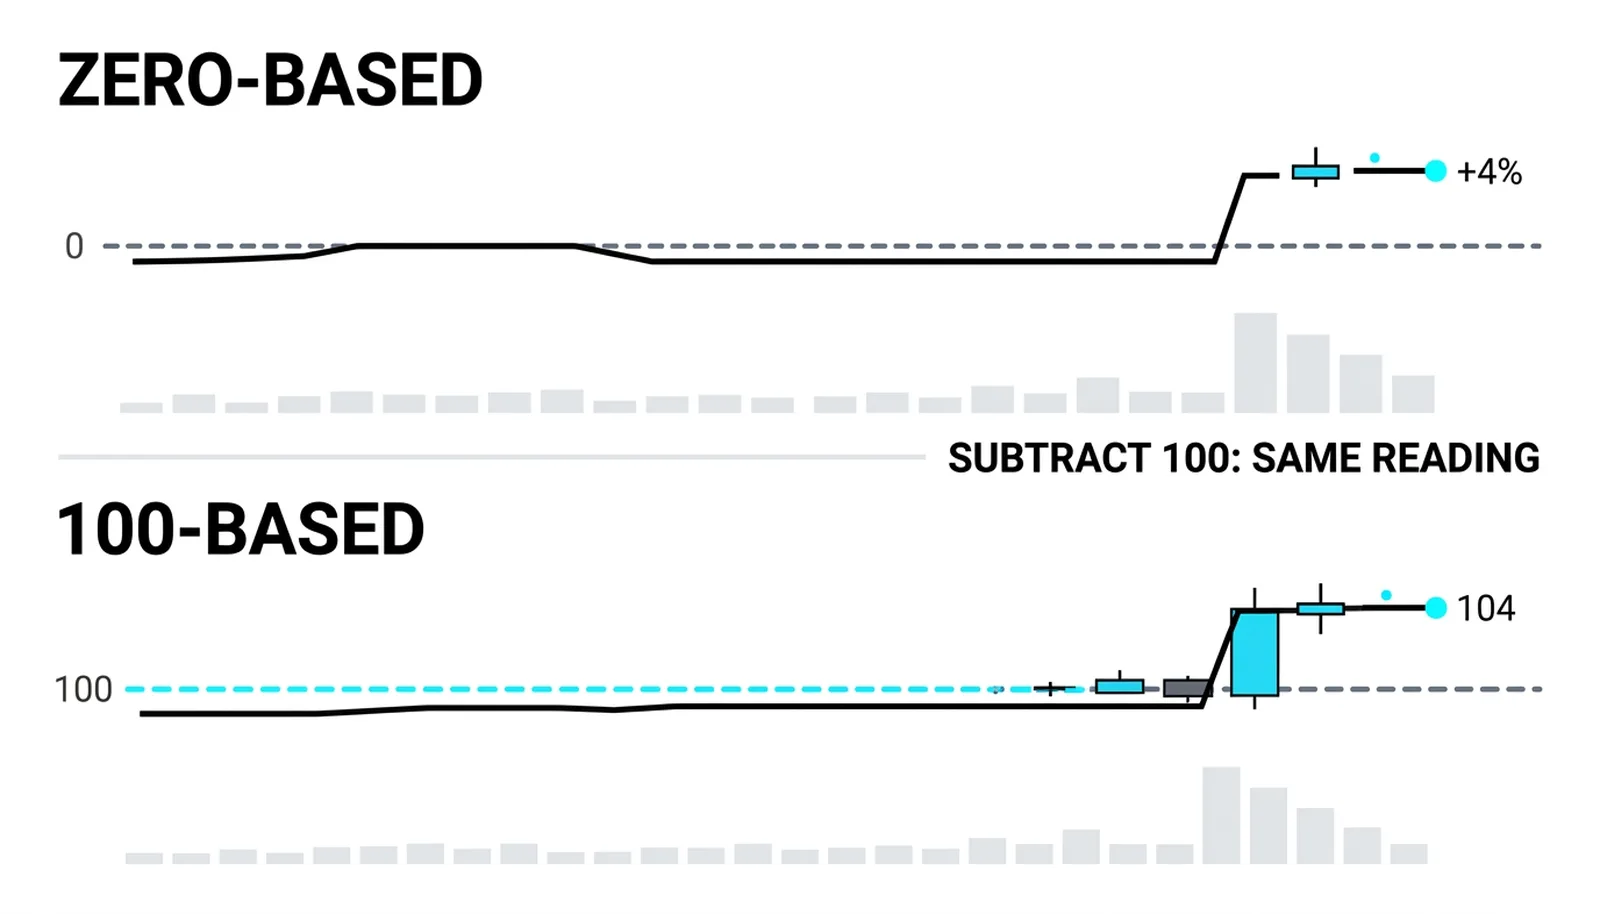
Conventions differ across platforms, and this one trips people up. Most charting packages plot ROC as the percent difference, oscillating around zero. Some plot the close divided by the old close, times 100, which oscillates around 100 instead.
The conversion is trivial. Subtract 100 from the 100-baseline version and you get the standard ROC. A reading of 104 on the ratio version is plus 4 percent on the standard version. A reading of 97 is minus 3 percent.
The classic error is reading a 104 print as enormous on a chart you assumed was zero-based. It looks like a massive spike. It is a modest 4 percent gain. Before you interpret any ROC chart, check the baseline: find where the flat, no-change reading sits. If flat sits at 100, you are looking at the ratio version.
Signals: Same Skeleton, Cleaner Units
Zero-line crosses work exactly as they did for momentum, because ROC crosses zero at the same bar momentum does. Dividing by a positive price and multiplying by 100 never flips a sign. The cross timing is identical.
Divergence transfers directly too. Price making a higher high while ROC makes a lower high is the same warning as the momentum version, with the same limitations and the same need for confirmation.
One honest note on thresholds. Unlike the CCI, which was designed around plus and minus 100, ROC has no universal fixed zones. What counts as extreme depends on each market's own volatility. A quiet index and a wild small-cap need different lines, and you set them by studying that instrument's history, not from a textbook.
Two Stocks, One Honest Comparison
All numbers here are invented and hypothetical, chosen round for clarity. Stock A moves from 20 to 22 over ten bars. Momentum reads plus 2. ROC divides 2 by 20 and multiplies by 100: plus 10 percent.
Stock B moves from 200 to 204 over the same ten bars. Momentum reads plus 4. ROC divides 4 by 200 and multiplies by 100: plus 2 percent.
Raw momentum said B's move was twice the size of A's. The percent version says A moved five times harder than B. If you were ranking candidates by strength, the raw version would have pointed you at the weaker mover.
Now watch A's next ten bars. It climbs from 22 to 23. Momentum reads plus 1. ROC reads plus 4.5 percent. Same stock, still rising, but the pace has more than halved. That deceleration, visible in the falling ROC while price still climbs, is the early-warning reading this family of indicators exists to give you.
| ROC reading | What the move means | Volatility caveat |
|---|---|---|
| Large positive | Strong upside drive over the lookback window | "Large" depends on the market's own history; check what past extremes looked like |
| Small positive | Mild upward drift, modest strength | On a quiet market this may already be near the top of its normal range |
| Near zero | Price roughly unchanged over the window, no momentum either way | Common in ranges; the line can hover here for long stretches |
| Large negative | Strong downside drive over the lookback window | Falling markets often move faster, so negative extremes can exceed positive ones |
Rate of Change, Answered
What does rate of change measure?
ROC measures how fast price is moving, expressed as a percentage of the price N bars ago. It answers the question "how much has price changed, relative to where it started?" rather than "how many points did it move?"
Is ROC the same as the momentum indicator?
Yes, in structure. ROC is the momentum indicator divided by the older close and multiplied by 100. Same numerator, same zero-line timing, same divergences. The only difference is the unit: points versus percent.
Why do some charts show ROC around 100?
Some platforms plot the ratio version: close divided by the old close, times 100. On those charts a flat market sits at 100 instead of zero. Subtract 100 from any reading to convert it to the standard percent version, and always check which baseline your chart uses before interpreting a value.
What period does ROC use?
Common defaults sit around 10 to 14 bars, and many platforms ship with one of those. Shorter periods react faster and whipsaw more; longer periods smooth the line and respond slowly. Whatever you choose, test it against the history of the specific market you trade, because volatility differs across instruments.
ROC closes the momentum block. From here the indicator level moves to tools that blend momentum with volatility and trend, where the percent-based thinking you just built keeps paying off.