What Is Momentum in Price
Momentum is the speed and strength of a price change, not its direction. Two stocks can both rise from 100 to 120, yet one gets there in a straight sprint and the other crawls, stalls, and stumbles. Those are not the same event, and treating them as the same is one of the most common mistakes new traders make.

Think of price like a car. Direction tells you which way the car points. Momentum tells you how hard the engine is pushing. A car pointed uphill with a dying engine is a very different situation from one pointed uphill at full throttle.
Momentum and Direction Are Two Separate Measurements
Direction answers one question: is price going up or down? Momentum answers a different one: how forcefully is it moving that way?
You can have an uptrend with strong momentum, an uptrend with weak momentum, a downtrend with strong momentum, and a downtrend with weak momentum. Four combinations, four very different trading situations.
Most beginners only track the first measurement. They see higher highs and assume everything is fine. But a trend can keep making new highs while the force behind it quietly drains away, and that gap between direction and strength is where a lot of bad entries happen.
Train yourself to ask both questions every time you look at a chart. Where is price going, and how hard is it working to get there?
What Strong Momentum Looks Like
Strong momentum has a recognizable signature on a chart. You do not need any indicator to see it. All of it reads straight off the candles described in reading a basic price chart.
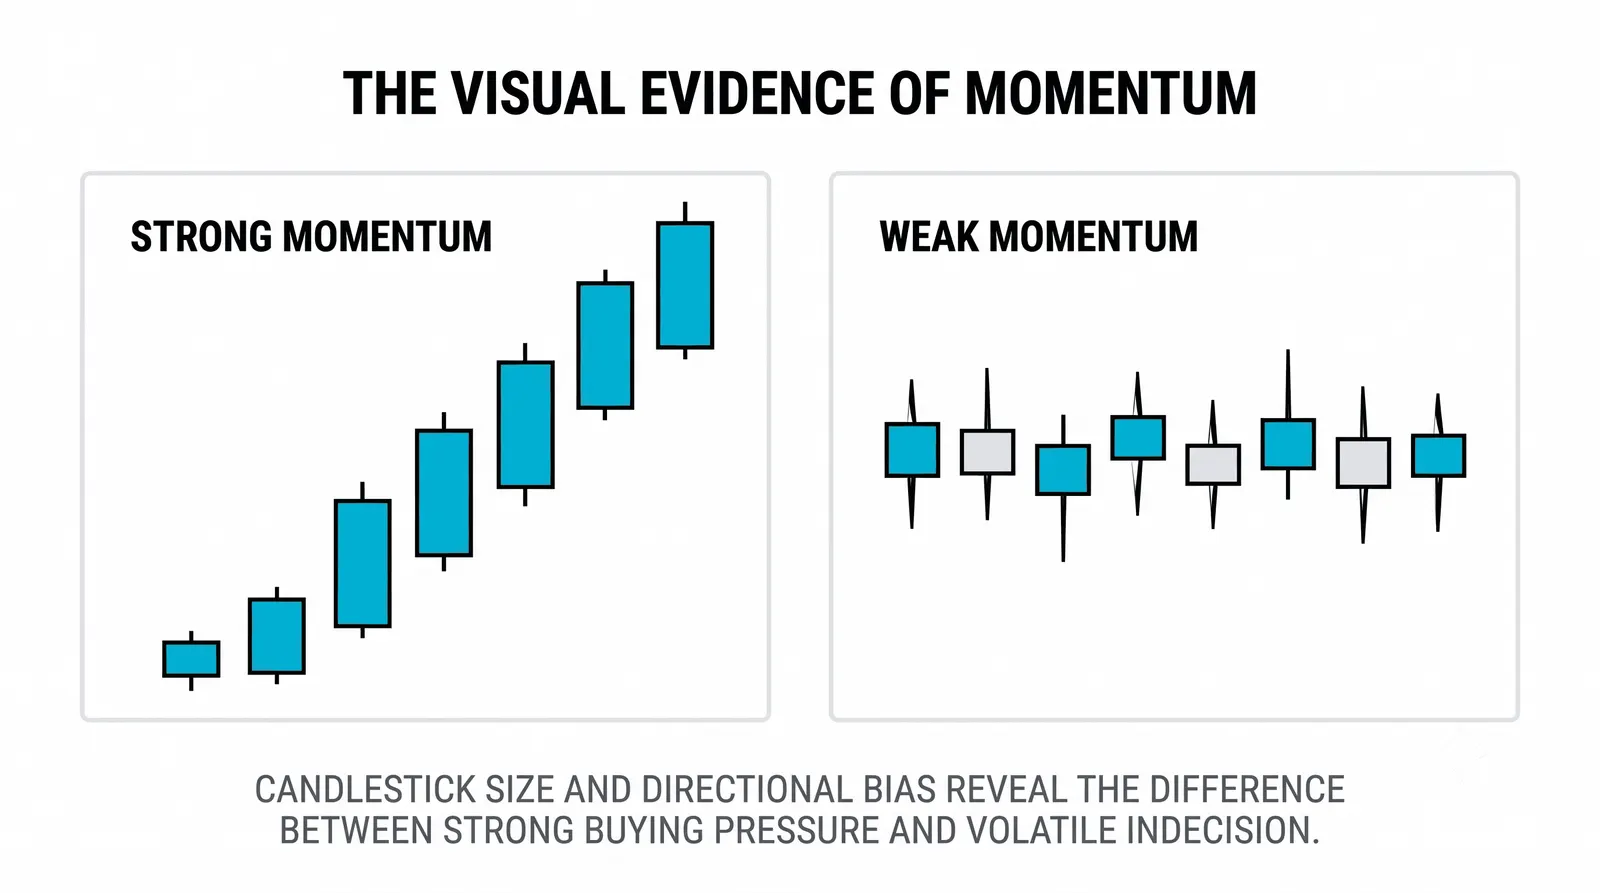
- Wide candles in the trend direction. Buyers (or sellers) commit size and price travels far within each bar.
- Quick follow-through. After a strong candle, the next candle continues instead of hesitating. Gains are not immediately handed back.
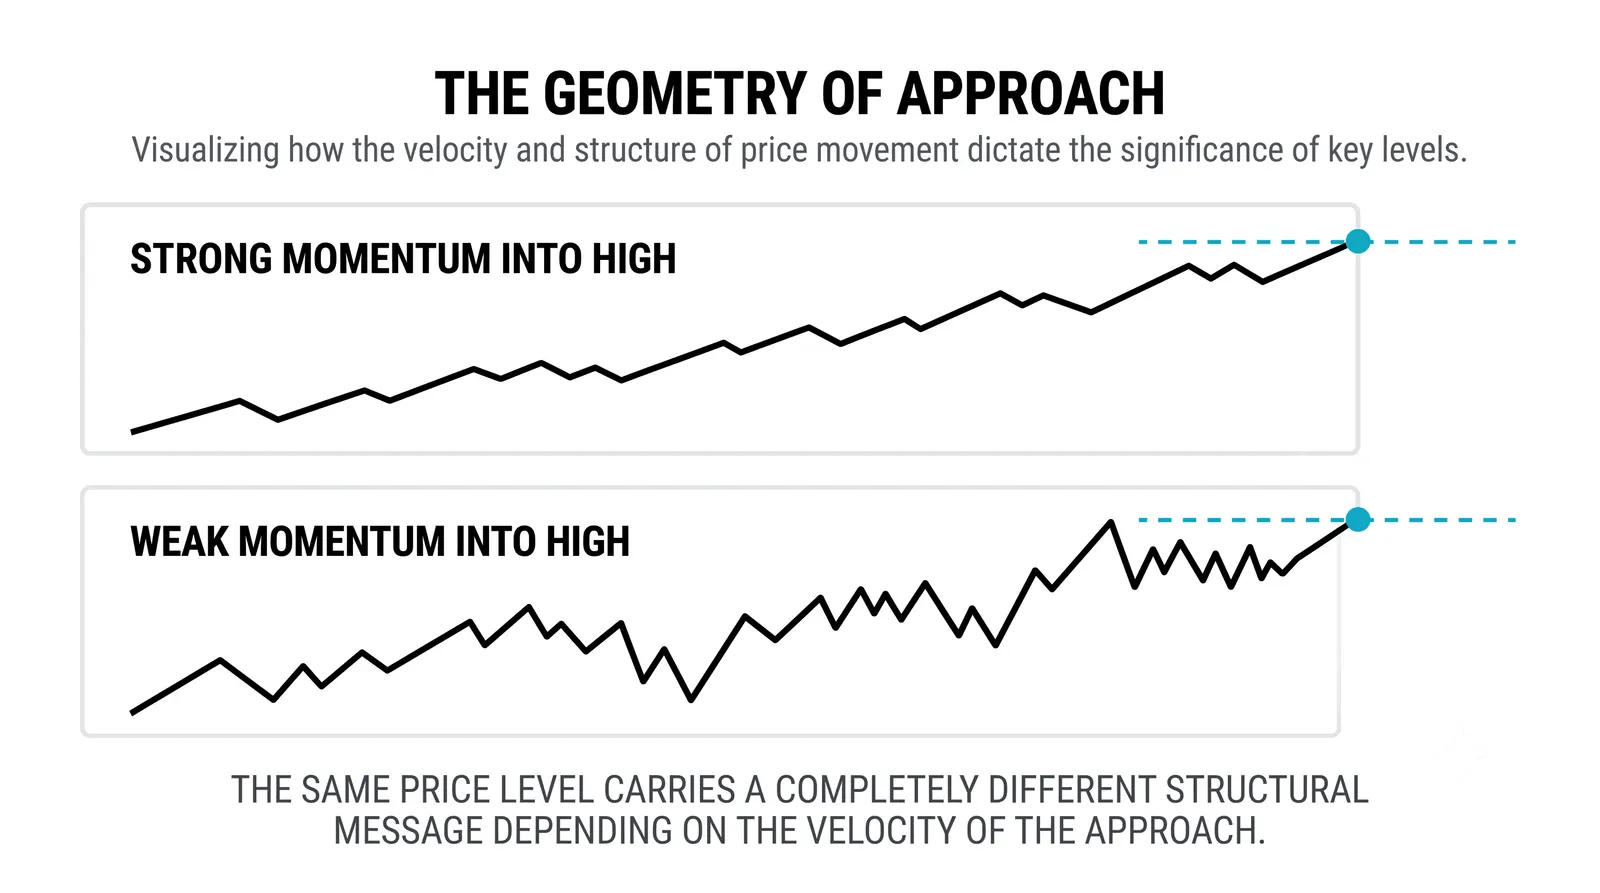
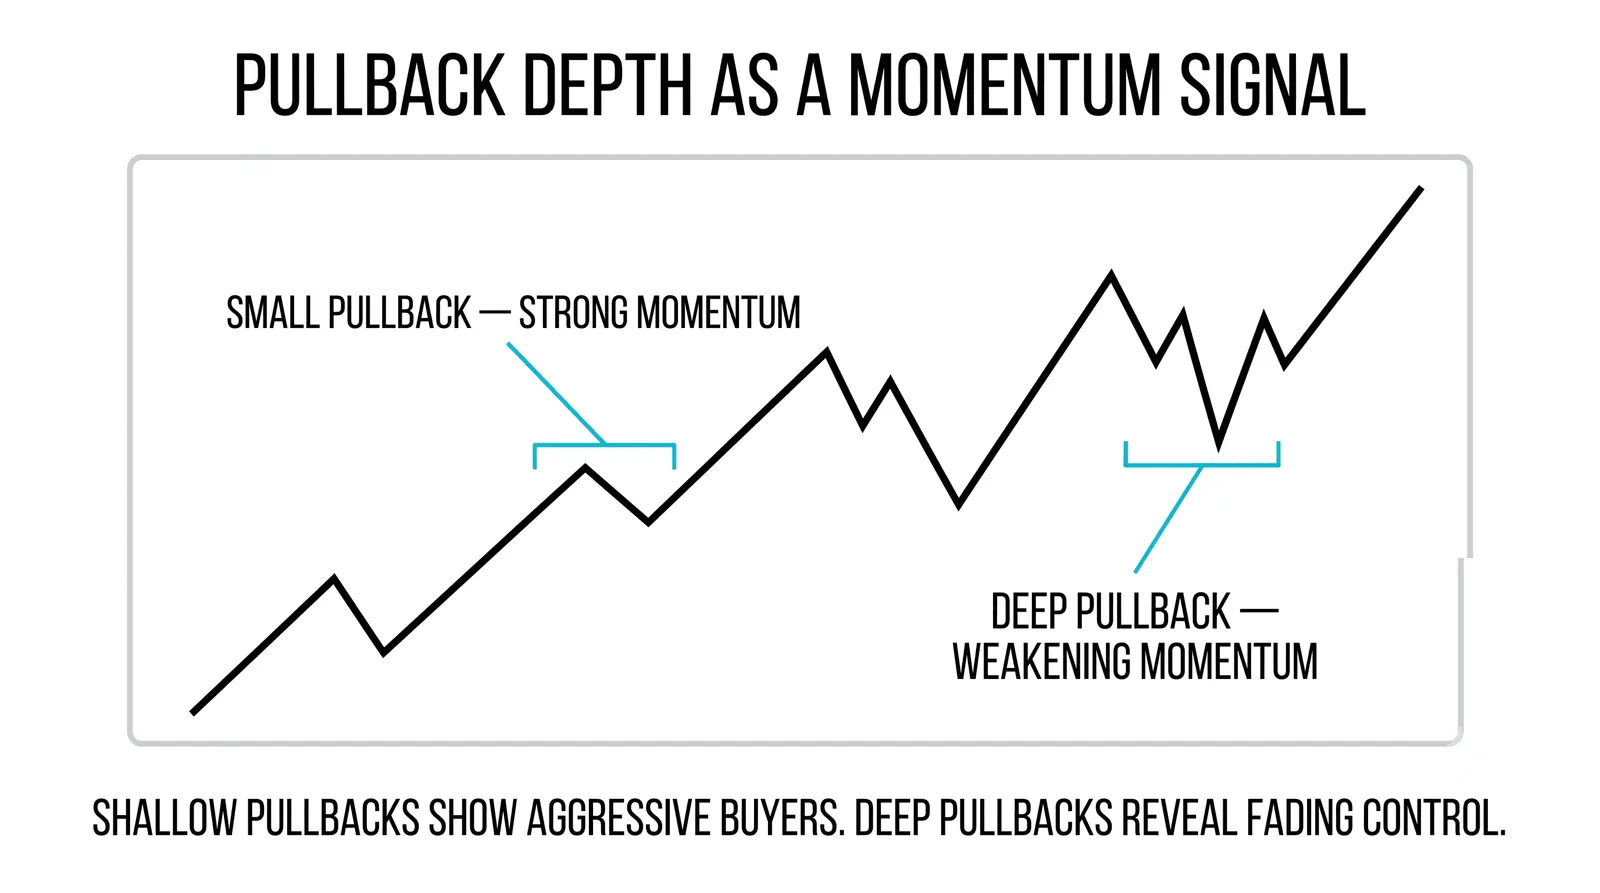
- Shallow pullbacks. Counter-moves are small and short. The other side cannot push price back more than a fraction of the last advance.
When you see all three together, the market is telling you that one side is in clear control and the other side is barely resisting.
What Fading Momentum Looks Like
Fading momentum is subtler. Price often still moves in the trend direction, which is exactly why traders miss it.
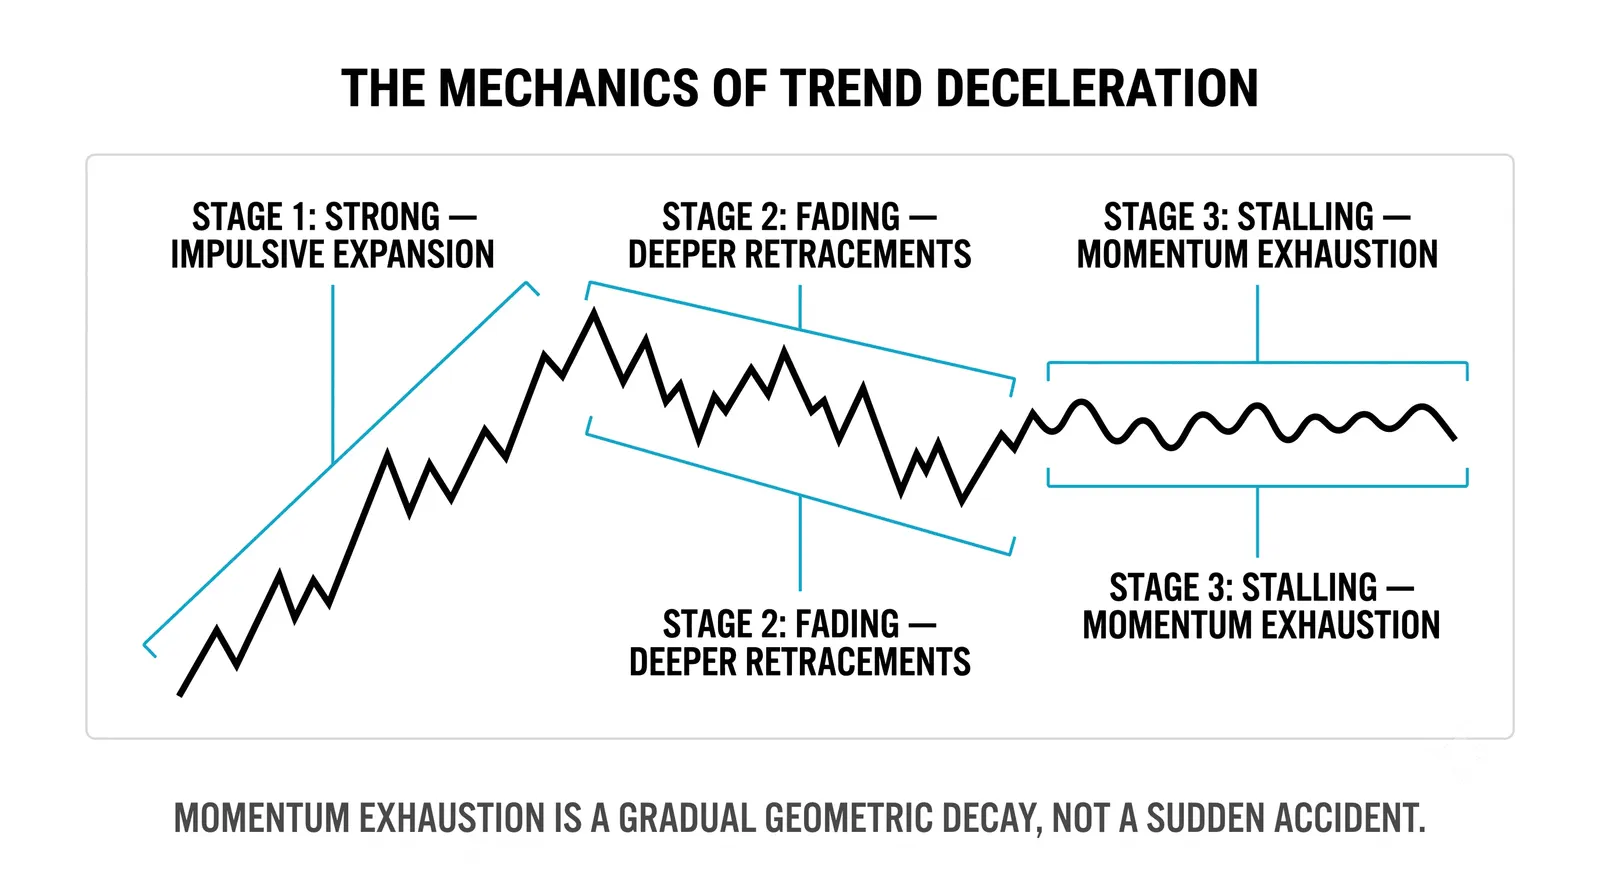
The steps in the trend direction get smaller. A stock that was jumping 5 points at a time now adds 2, then 1. Each new high takes more effort and more time.
Pullbacks get deeper. Instead of giving back a third of the last advance, price gives back half or more. The opposing side is starting to win individual battles even while losing the war.
Follow-through weakens. Strong candles get faded. Breakouts stall within a bar or two instead of running.
None of this means the trend is over. It means the market still leans in one direction but pushes less. That distinction matters, and we will come back to it.
A Worked Example With Numbers
Compare two stocks over four sessions. Both start at 100.
Stock A: 100, 105, 112, 117. The steps are +5, +7, +5. The largest push comes in the middle, and the final step is still healthy. Pullbacks between sessions are small. The engine runs strong the whole way.
Stock B: 100, 110, 112, 113. The steps are +10, +2, +1. One violent burst, then almost nothing: each new high takes more time and delivers less.
Both stocks are uptrends by structure; both end higher than they started. But the paths are not the same event. Stock A shows consistent pressure that does not depend on mood. Stock B shows a move running on one early burst of emotion and coasting after. The endpoints are close. The engines are not.
The point is not that one path is always better. The point is that the path itself carries information the endpoint hides.
Why Fading Momentum Matters
Here is the blunt truth: fading momentum does not predict a reversal by itself.
Trends can grind higher on weak momentum for weeks. Plenty of traders have shorted a "tired" uptrend only to watch it crawl another 20 percent. Weak momentum is not a sell signal.
What it does is raise the bar for continuation. When momentum is strong, the trend can continue on its own inertia. When momentum fades, continuation needs a new reason: fresh news, a new wave of buyers, a breakout that actually holds. Without that reason, the odds of a deeper pullback or a full reversal climb.
Practically, this changes how you behave, not whether you believe in the trend:
- You demand more confirmation before entering in the trend direction.
- You tighten your idea of where the trade is wrong, because shallow-pullback logic no longer applies.
- You take profits more seriously when the trend gives you them, instead of assuming every dip gets bought.
Strong vs Fading Momentum at a Glance
| Feature | Strong Momentum | Fading Momentum |
|---|---|---|
| Candle size (trend direction) | Wide, often expanding | Shrinking steps |
| Pullback depth | Shallow, a third or less of the last move | Deep, half or more |
| Follow-through | Next candle continues quickly | Gains get faded, breakouts stall |
| What it implies | One side in control, continuation needs no new reason | Trend leans but pushes less, continuation needs a fresh catalyst |
Questions About Momentum
Is momentum the same as a trend?
No. Trend is direction, momentum is the strength behind that direction. A trend tells you price is making higher highs; momentum tells you whether those highs are coming easily or with increasing strain. You need both readings before judging any move.
Which indicators measure momentum?
A family of tools called momentum oscillators measures it, and they all work on the same basic idea: comparing recent closes against older closes to see if price is gaining or losing force. RSI, stochastic, and rate of change are the best-known members. The details, settings, and traps of each come later in this course, so for now just learn to read momentum straight off the candles.
Can momentum be negative?
Yes. Momentum measures strength in either direction, so a fast fall has strong downside momentum. A drop from 100 to 80 in three wide candles shows powerful negative momentum, while a slide from 100 to 95 over three weeks of small candles shows weak negative momentum. Everything in this lesson applies to downtrends, just flipped. The close cousin is volatility, which measures the size of the swings themselves.
Does high momentum mean I should buy?
Never by itself. High momentum tells you the move is strong, not that you are early. Buying after a vertical run often means buying right before the shallow pullback that shakes out late entries. What momentum should change is your position sizing and your expectations: strong momentum can justify more confidence in continuation, while fading momentum argues for smaller size, tighter invalidation, or simply waiting.
Next, practice labeling momentum on twenty historical charts: mark each leg as strong or fading using candle size, pullback depth, and follow-through, then check what actually happened afterward. That habit prepares you for the momentum oscillators module, where you will learn to quantify what your eyes are starting to see.