MACD Histogram: Reading Momentum Shifts
The MACD histogram plots the gap between the MACD line and its signal line as bars around zero, and because that gap changes direction before either line crosses the other, the histogram often shows momentum turning before the crossover itself. It is the third component of the MACD indicator, built on the two lines you already know from the previous lesson.

Think back to the two swimmers from the MACD lesson, one fast and one slow, with the gap between them measured stroke by stroke. The histogram is that distance drawn as bars, and it starts shrinking before anyone watching the race can see the faster swimmer stall. The deeper idea of momentum was covered in the level on price behavior; here, momentum is simply the measured version of it, printed as numbers you can read bar by bar.
What the Histogram Actually Plots
The calculation is one subtraction. Take the MACD line, subtract the signal line, and plot the result as a vertical bar sitting above or below a zero line.
When the bar sits above zero, the MACD line is above its signal line. That means the faster average has pulled ahead of the slower one, and momentum is stronger than its recent norm. When the bar sits below zero, the reverse holds.
Both the sign and the size carry information. The sign tells you which side of the signal line the MACD line sits on. The size tells you how far apart the two lines are, which is a direct measure of how hard the gap is stretching.
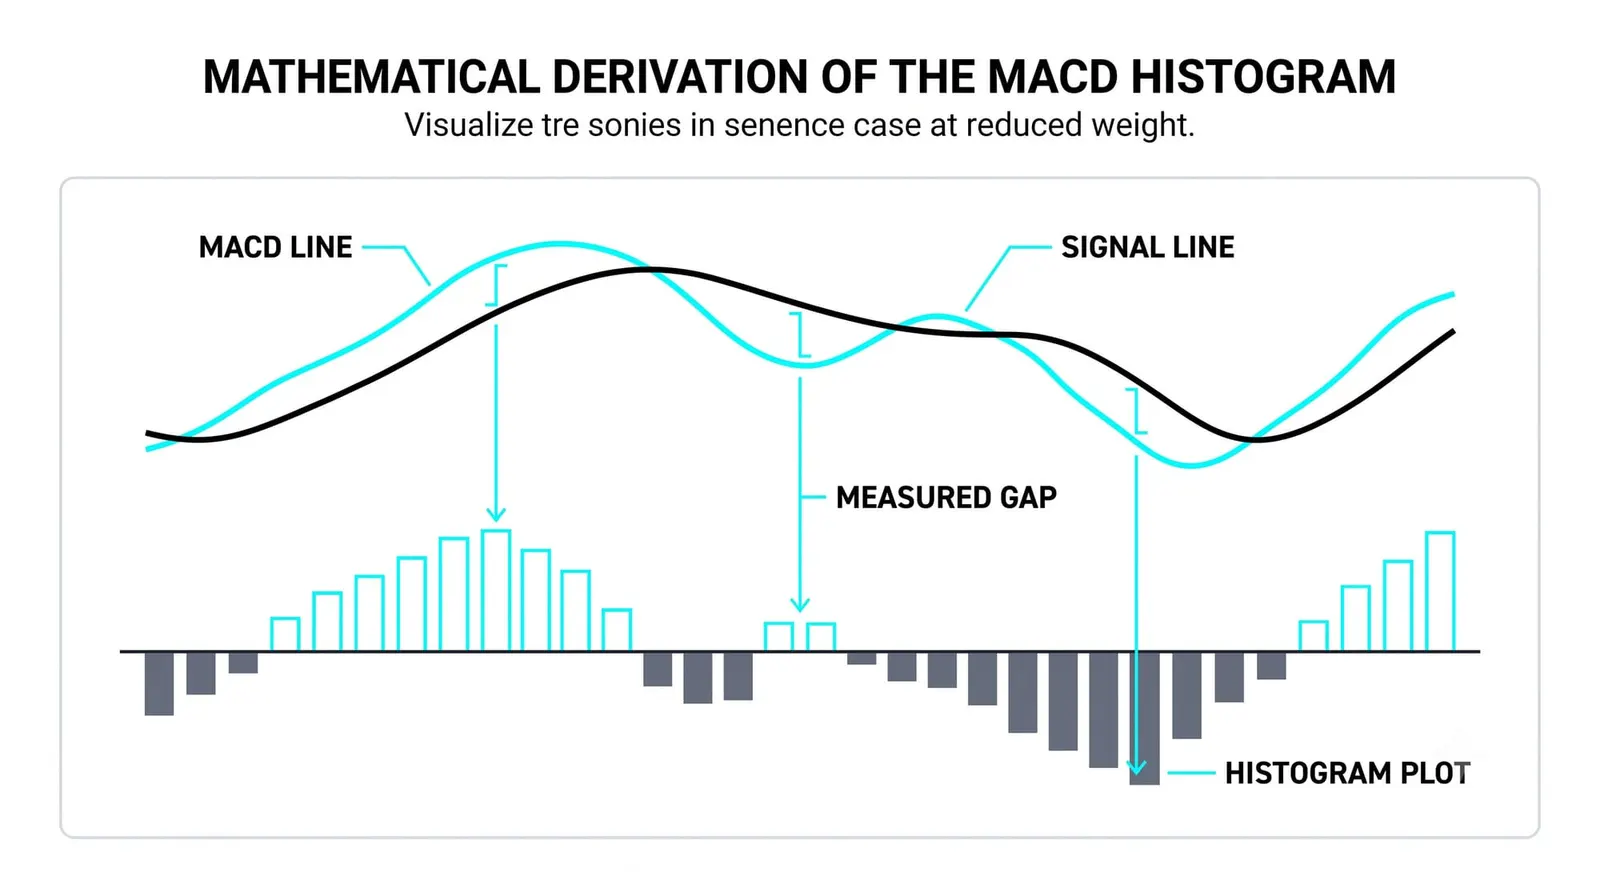
A tall bar and a short bar can both be positive, but they say different things. The tall one says the gap is wide and momentum is running strong relative to its own recent average. The short one says the two lines are nearly touching.
Reading the Bars Growing and Shrinking
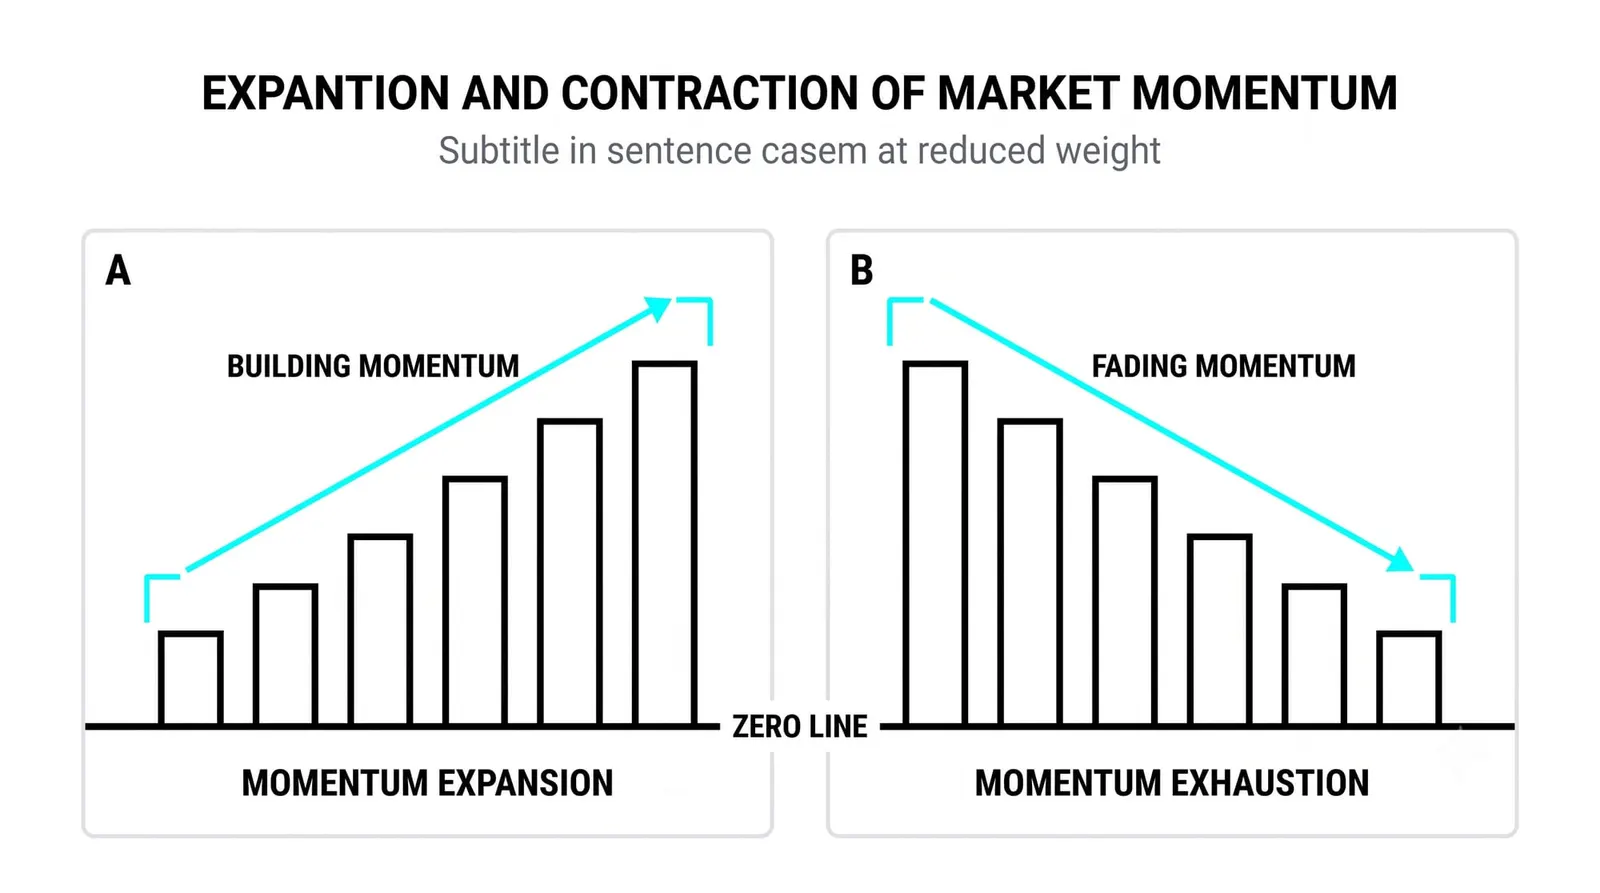
Watch what happens when bars above zero start shrinking. The bars are still positive, so momentum is still technically bullish. But each bar is shorter than the last, which means the two lines are converging. The move is losing steam even while price may still be climbing.
The mirror image works below zero. Shrinking negative bars mean the reading is still bearish, but the fall is easing. The two lines are coming together from underneath, and the selling pressure is fading relative to its recent norm.
The slope of the bars matters more than their height. A bar of 0.4 tells you little alone. A sequence of 0.4, 0.3, 0.2 tells you a great deal, because the direction of the change reveals which way the gap is moving.
Height is a snapshot. Slope is a trajectory. Traders who read only the height of the latest bar miss the story that three bars in a row are telling.
What It Means When Bars Cross the Zero Line
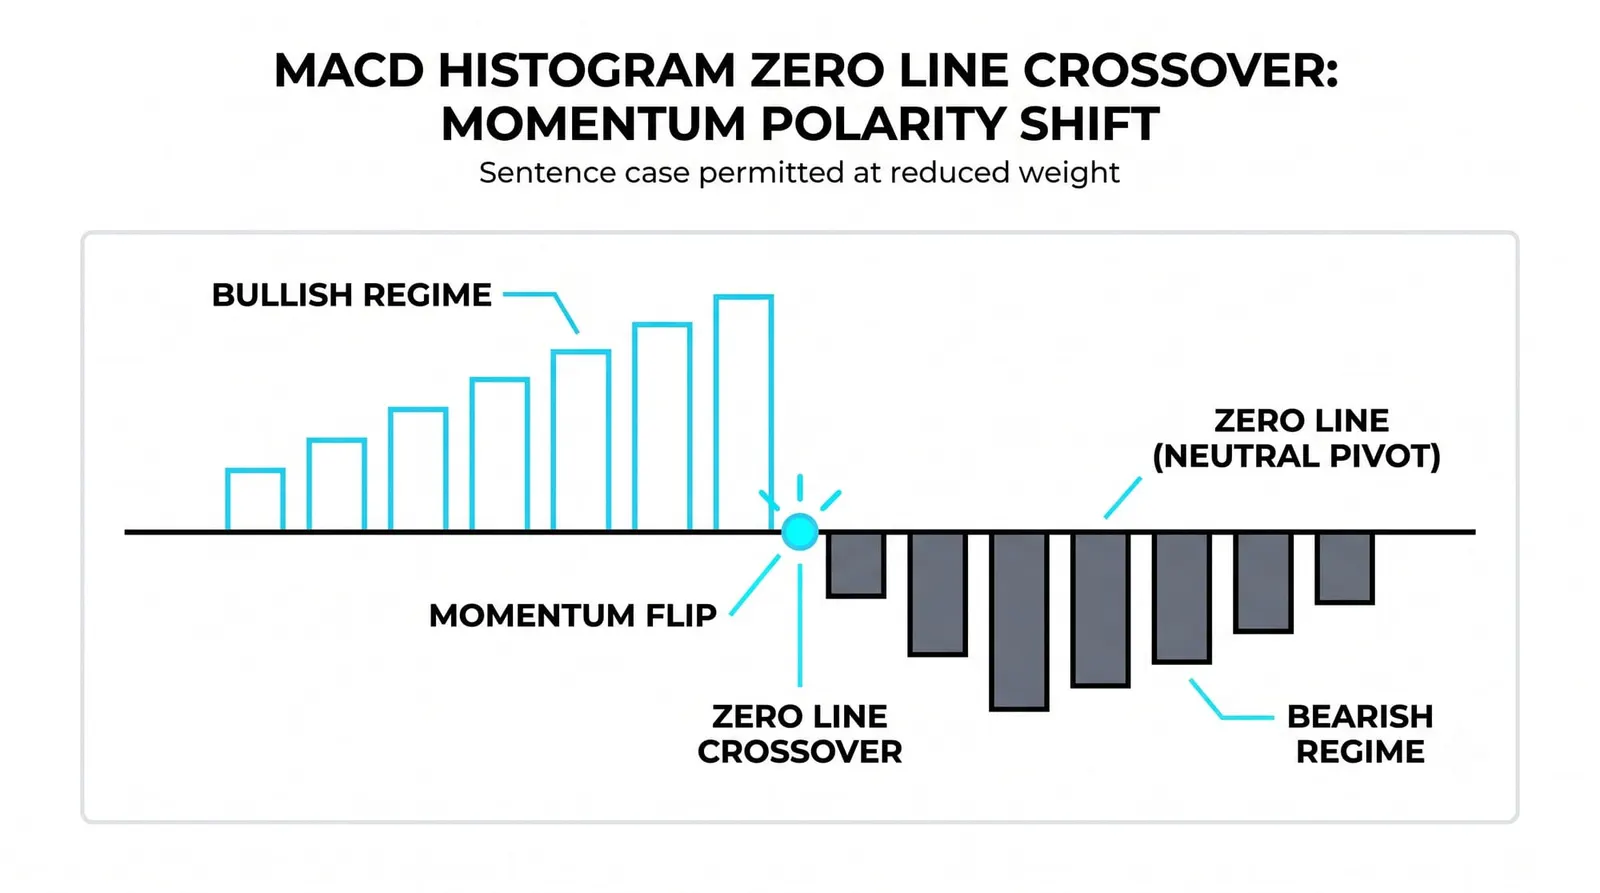
A histogram bar crossing zero is not a separate event. It is the exact moment the MACD line crosses its signal line, because the gap between them has gone to zero and flipped sign. The histogram and the crossover are the same information drawn two ways.
By the time the bar crosses zero, the shift is confirmed. The fast average has fully overtaken or fallen behind the slow one. There is nothing left to anticipate, only to acknowledge.
Earlier reads come from the shrink. Later reads come from the cross. The shrink is the warning, the cross is the confirmation, and the histogram lets you see both on one strip of bars.
Why the Histogram Shows Momentum Shifts Earlier Than the Lines Alone
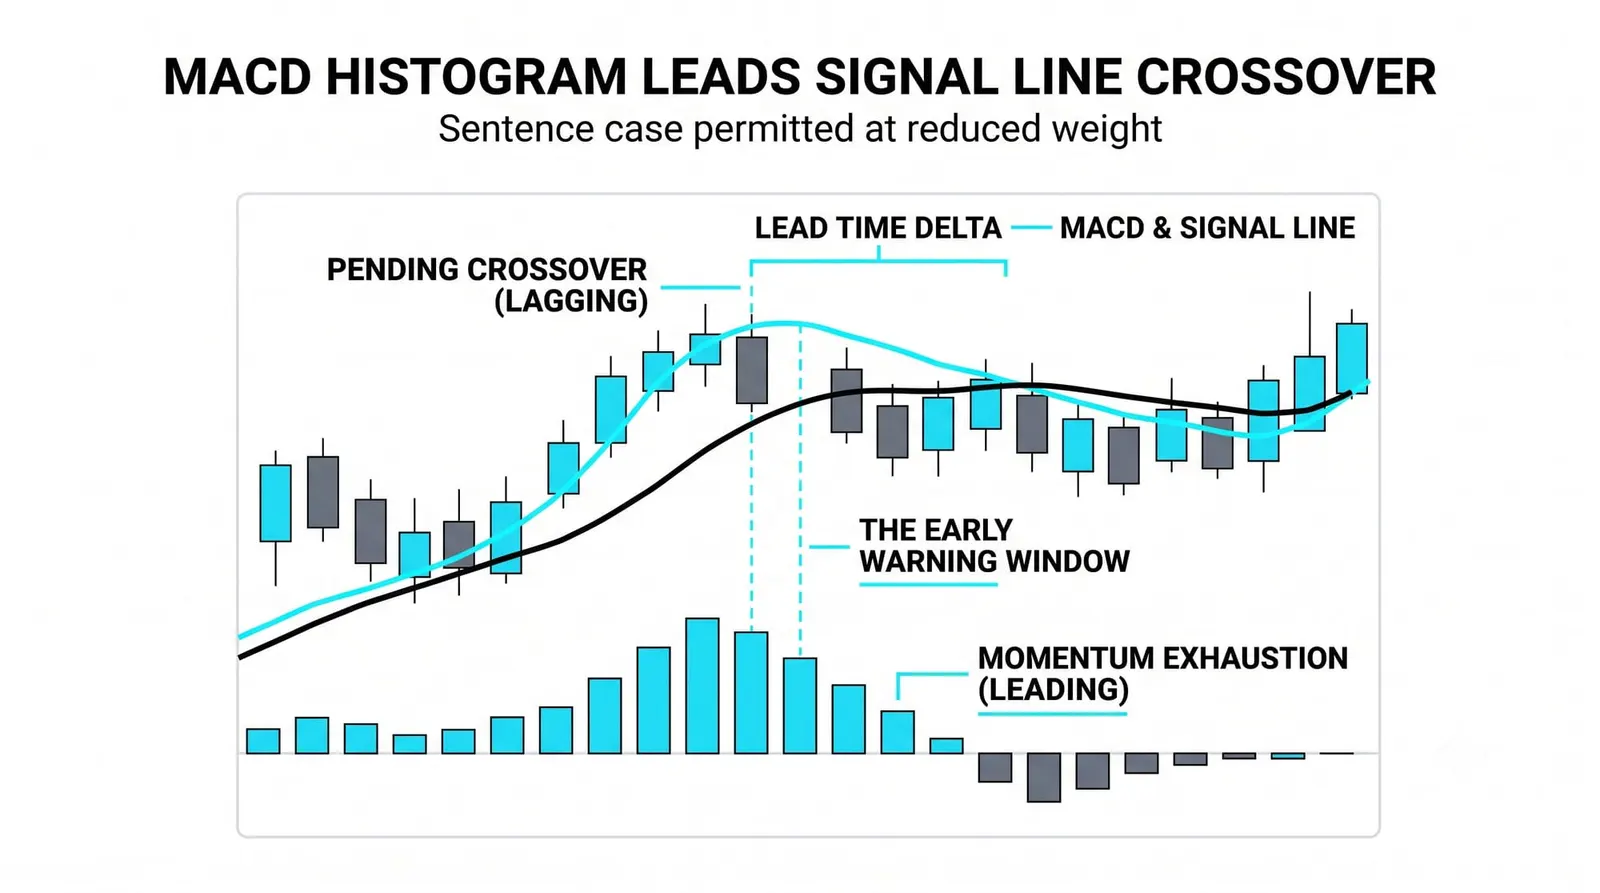
The gap between two changing lines changes direction before the lines themselves cross. That is plain arithmetic. If the MACD line is rising but rising more slowly while the signal line keeps climbing at its steadier pace, the distance between them shrinks immediately, long before the two lines actually meet.
A difference reacts faster than either of its inputs. The histogram is a difference, so it inherits that speed.
The trade-off is real. Earlier reads bring more false ones. Bars can shrink for two sessions and then re-expand as the trend resumes, and a trader who acted on every shrink would exit moves that still had room to run.
A practical filter is the zero line of the MACD itself. If both MACD lines sit above zero, the broader trend regime is up, and a shrinking histogram reads as a pause or a warning rather than a reversal signal. If both lines sit below zero, shrinking negative bars get the same treatment in the other direction. The histogram gives the timing; the regime gives the context.
Four Bars, One Story
Imagine a stock in a weeks-long climb. These numbers are invented round figures for illustration. Over four sessions, its MACD histogram prints 0.7, then 0.5, then 0.3, then minus 0.1, while the price itself keeps inching to new highs each day.
Bar one, at 0.7, is healthy. The gap between the MACD line and its signal line is wide and positive. Momentum is strong relative to its recent norm, and nothing in the reading argues against the climb.
Bar two, at 0.5, is still bullish but fading. Price made a new high, yet the gap narrowed. The fast average is still above the slow one, but it is gaining more slowly. A trader watching only price sees strength; a trader watching the histogram sees the first crack.
Bar three, at 0.3, is still positive and fading faster. Two consecutive shrinks now form a slope, and the slope points down toward zero. The climb continues on the chart, but the measured momentum behind it has more than halved from its peak.
Bar four, at minus 0.1, is the crossover confirmed. The MACD line has slipped below its signal line, the gap has flipped sign, and the histogram prints its first negative bar. Anyone waiting for the official signal gets it here.
Now compare the two traders. The one who watched the shrink saw momentum deteriorating at bar two, three full sessions before the cross, and had time to tighten a stop, trim a position, or simply stop adding. The one who waited for the cross acted on confirmed information but gave back those three days of drift. Neither is wrong. They chose different points on the same trade-off between speed and certainty.
| Bar behavior | What the bars show | The usual read |
|---|---|---|
| Growing above zero | The gap between MACD and signal is widening on the upside | Bullish momentum building |
| Shrinking above zero | Still positive, but the gap is closing | Up move losing steam; warning, not reversal |
| Growing below zero | The gap is widening on the downside | Bearish momentum building |
| Crossing zero | The gap has flipped sign | The MACD crossover itself, confirmed |
The Histogram, Answered
What does a shrinking MACD histogram mean?
It means the gap between the MACD line and its signal line is closing, so momentum is fading relative to its recent norm. Above zero, the climb is losing steam. Below zero, the decline is easing. It is a warning, not a reversal signal on its own.
Is the histogram leading or lagging?
Both, depending on what you compare it to. It leads the MACD crossover because the gap shrinks before the lines cross. It still lags price itself, because it is built from moving averages of past prices. Earlier than the signal, later than the raw data.
What does it mean when the histogram crosses zero?
It means the MACD line has crossed its signal line, since the gap between them has passed through zero. The histogram cross and the line crossover are the same event, so by that point the shift is confirmed rather than anticipated.
Can the histogram be used alone?
It can be read alone, but it works better with context. Pairing the bar behavior with the MACD zero-line regime, and with the support, resistance, and structure you already know, filters out many of the false shrinks that a standalone reading would flag.
With the histogram in hand, the MACD toolkit is complete: two lines, a zero line, and a bar-by-bar measure of the gap. The next step is putting the full indicator to work alongside the price structure you built in the earlier levels, where signals stop being abstract and start meeting real charts.