Mean Reversion to the POC and Value Area
Mean reversion to the profile's levels trades a simple idea: when price leaves the value area and the auction fails to build trade at the new prices, price is rejected and rotates back toward the point of control, the session's fairest price. The POC is where the most volume changed hands. The value area is the band of prices around it where the heavy majority of the day's business happened. Both work as destinations because both are where the crowd proved it participates with real money, not opinions.

This is the core of profile-based reversion trading. Earlier lessons covered how the point of control, the value area, and the profile shapes get built, so this one skips construction and goes straight to trading the return. Think of a food court: a dozen stalls pull people in every direction, but everyone ends up at the same cluster of center tables, and those tables are the POC. Price wanders out to the edges, finds thin business, and drifts back to where the crowd actually sits.
The edge is not the level itself. Plenty of traders draw the value area and fade every touch, and plenty of them get run over. The edge is reading what price does at the level. That reading splits into two outcomes, and everything in this lesson hangs on telling them apart.
Rejection Versus Acceptance
Rejection is the setup you trade. Price pushes above the value area, stalls, fails to attract follow-through, and rotates back inside. The probe bars carry shrinking volume. Nobody wants to do business up there. The balance and imbalance cycle in market profile practice describes this exactly: the market tried imbalance, found no business, and returned to balance. The failed auction is the evidence, and the rotation back inside the value area is the confirmation.
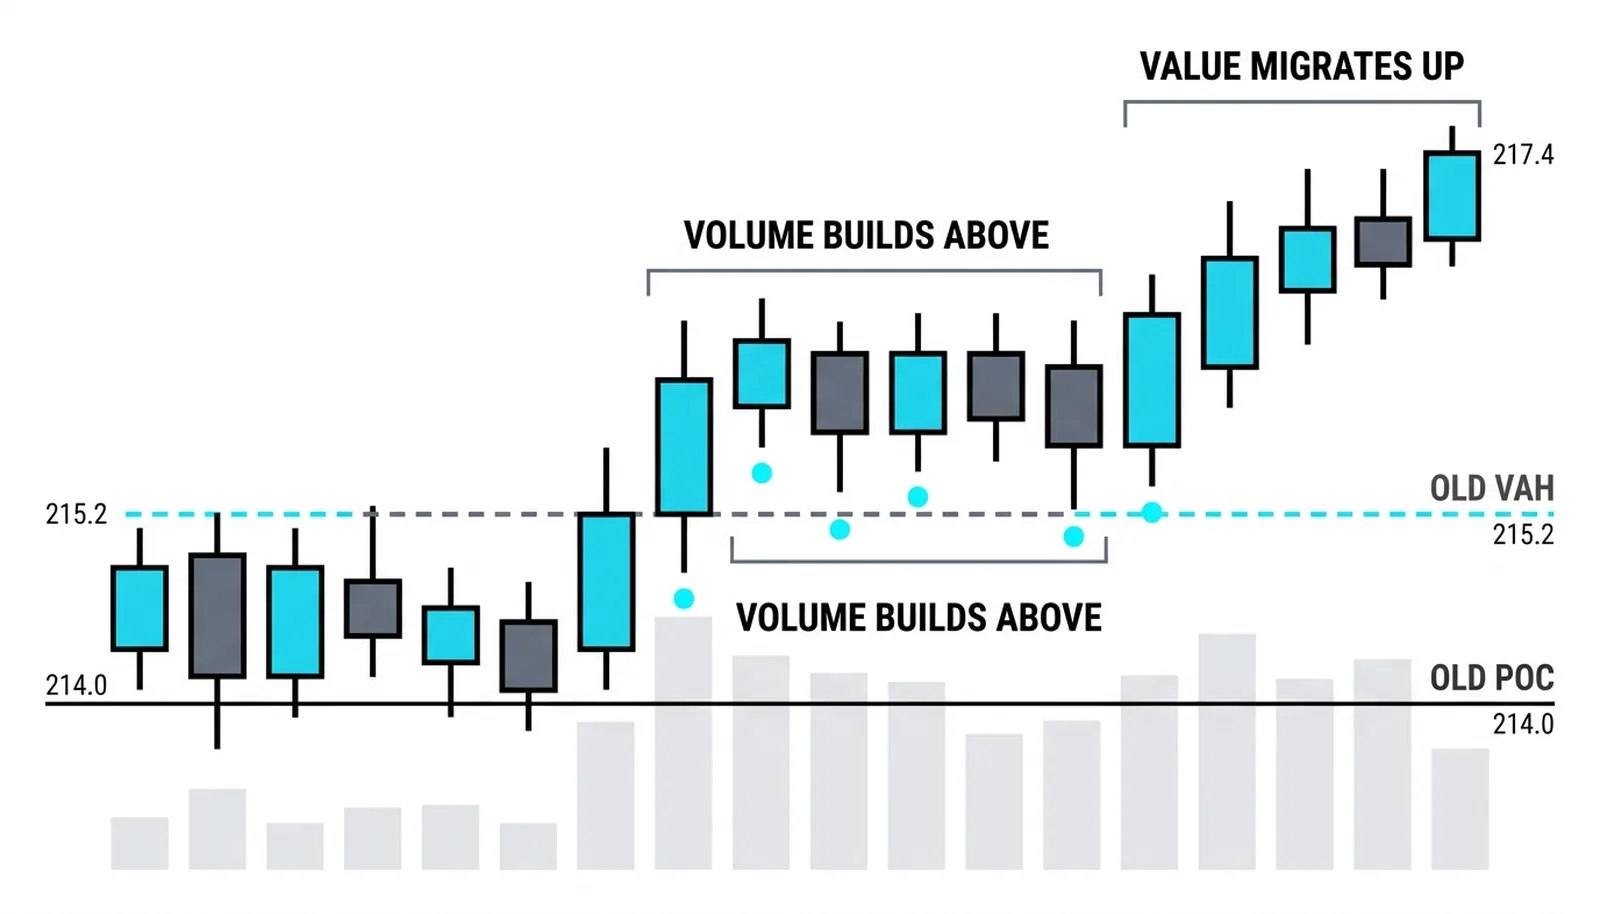
Acceptance is the setup you leave alone. Price moves outside value and trade builds there. Volume accumulates at the new prices, bars hold their gains, and the profile extends rather than stacking back on itself. Range-extension logic in market profile theory is blunt about what this means: something has changed, the market is repositioning, and the old value area is being left behind. Fading acceptance is fading a market that has already told you it wants to go.
The difference is read in whether trade builds at the new prices, not in whether price sits above or below the line. A poke above the value area high means nothing by itself. What matters is the auction's response. Did sellers step in and did buyers vanish, or did buyers keep transacting and pull more volume up to the new level? The first is a fade. The second is a warning to stand aside or flip bias entirely.
Two cautions belong here. First, a touch is not rejection. Price can poke above the value area for one bar and return for no reason worth trading. The evidence is the failed auction: entry stalls, no follow-through, rotation away. Waiting for that evidence costs a few points of entry and saves entire losing trades. Second, the read only works when the profile itself is trustworthy, which the next sections cover.
The Trip Back to Value
A rejection fade follows a recognizable sequence. Learn the stages and the trade stops being a guess at the top.
- The probe. Price pushes above the value area high. Volume on the probe bars is the first clue: strong and expanding trade warns of acceptance, thinning trade hints at a stretch.
- The stall. Price stops making progress. Bars get smaller, closes weaken, and no new buyers appear at the extremes. This is the failed auction forming.
- The re-entry. Price rotates back inside the value area. This is the trigger zone for most fade entries, because the rejection is now printed rather than hoped for.
- The rotation. Price travels down through the value area toward the POC. Volume often picks up as price approaches the high-volume node, because that is where business gets done.
- The destination. The POC. First target for the fade. Some traders scale out there and hold a runner toward the opposite side of the value area, but the POC is the base-case exit because it is where the day's trade concentrates.
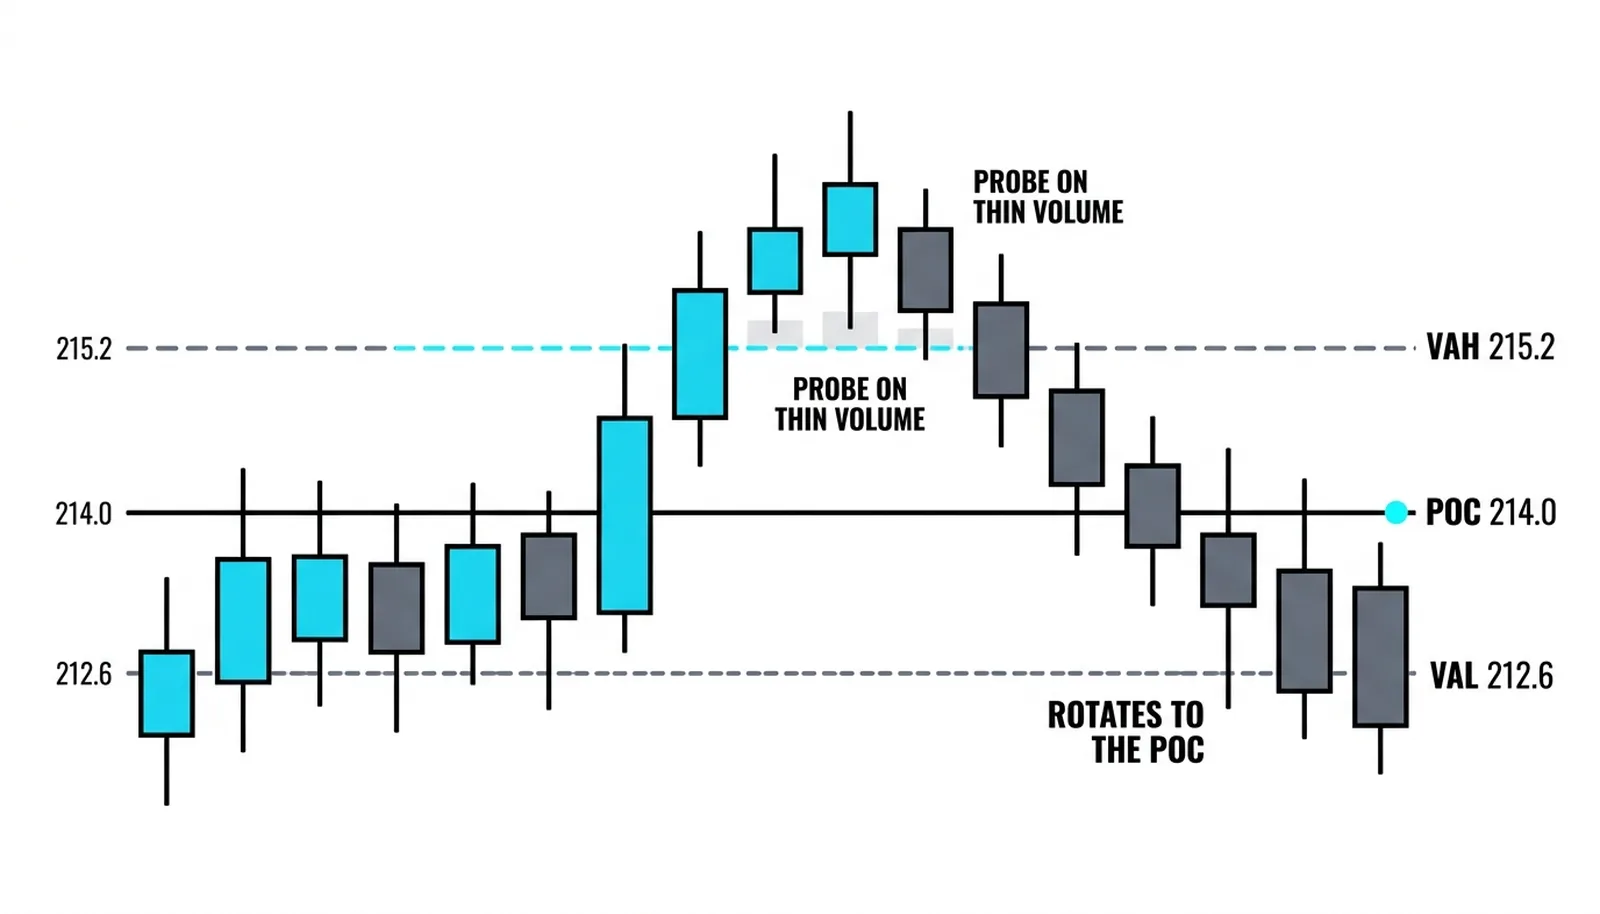
Entry placement splits into two styles. Aggressive entries fade the stall itself, selling the probe's failure at the extreme with a stop just beyond the probe high. Conservative entries wait for the re-entry into the value area, accepting a worse price in exchange for printed confirmation. Both are valid. The conservative version wins less often per point risked but avoids the probes that keep going.
Stops belong beyond the extreme of the probe, not at an arbitrary distance. If the market takes out the probe high after you faded, the rejection thesis is dead and the trade should be too. Targets anchor to the POC first, the value area low second. Risk and reward both come from the profile's own structure, which is the appeal of the method.
When the Profile Is Too Thin
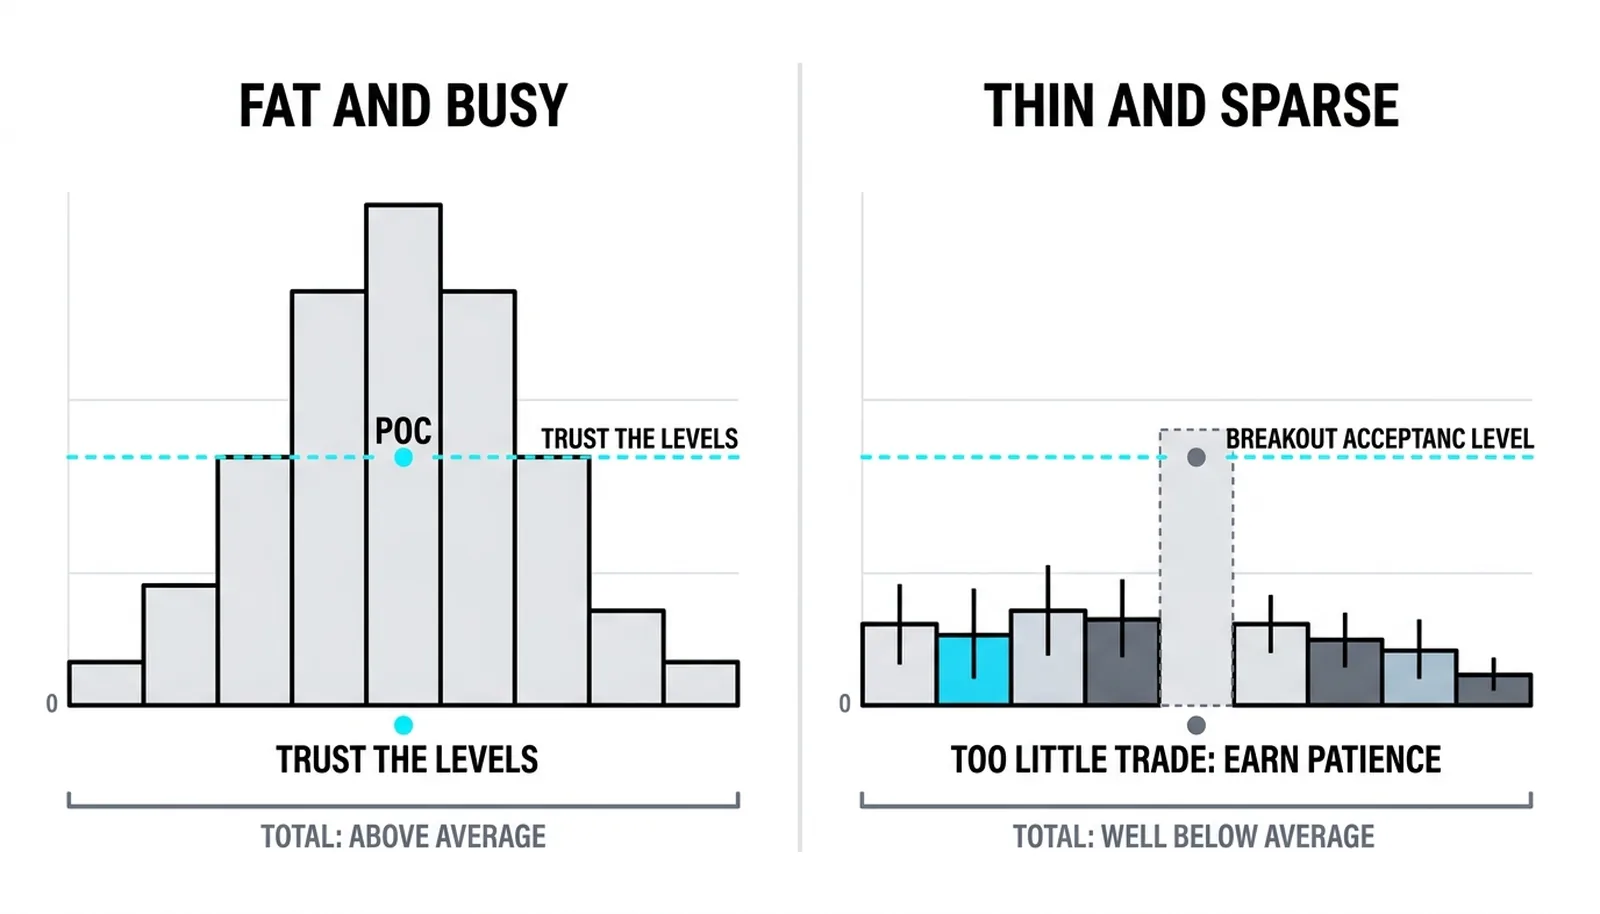
A POC built on a quiet day is a suggestion, not a level. On low-volume sessions and thinly traded stocks, the point of control sits on too little evidence to mean anything. A handful of lots at one price can crown a POC that no crowd actually defended. Review material in market profile practice makes exactly this point: value identification needs volume behind it, and without volume the profile is a sketch rather than a map.
Thin profiles fail in a specific way. Price drifts through the value area and the POC without reacting, because there was never real two-sided trade at those prices to begin with. The fade triggers, the rotation never comes, and the trader is left holding a position against a slow grind. The level looked perfect on the chart and meant nothing in the auction.
Session selection fixes most of this. Prefer sessions with normal or better participation: regular trading hours on liquid instruments, days without holiday-thinned trade, stocks with enough daily volume that the profile's shape reflects a genuine crowd. Check the day's total volume against its recent average before trusting any level the profile draws. A fat, busy profile earns your trust. A sparse one earns your patience.
The Rejection at the Top of Value
Hypothetical numbers, round and invented, to show the full sequence. A daily profile has its POC at 214.00, with a value area running from 212.60 to 215.20. The open pushes above value and reaches 216.40. The probe bars carry thinning volume, each new high attracting less trade than the last. Price stalls, then re-enters the value area at 215.10 mid-morning. That re-entry is the trigger.
The fade entry goes on near 215.00 with a stop above the probe high at 216.60, risking about 1.60. The target is the POC at 214.00, roughly 1.00 of reward, with a secondary target at the value area low near 212.70 for a runner. Price rotates down the profile through the afternoon and prints 214.20 by early afternoon, close enough to the POC to take the bulk of the trade off. The rejection paid because the auction failed first and the entry came after the evidence.
Now the contrast case. The open pushes above value and the morning builds trade up there instead. Volume accumulates at the new prices, bars hold their gains, and the profile one-timeframes higher. No fade is taken, because the evidence says acceptance. By the next session the value area has migrated upward, and yesterday's POC at 214.00 is history. The trader who waited for the read avoided shorting a market that was repricing higher.
| Price Location | Volume Behavior | The Read | The Action |
|---|---|---|---|
| Above the value area, probe bars | Thinning volume, no follow-through | Possible rejection forming | Watch, prepare the fade, no entry yet |
| Re-entry below the VAH at 215.10 | Sellers step in, rotation begins | Failed auction confirmed | Enter the fade, stop above 216.60 |
| Inside value, traveling toward 214.00 | Volume builds near the POC | Rotation to fair price working | Hold toward the POC, manage the trade |
| Above value, trade building at new highs | Volume accumulating, profile extending | Acceptance, market repositioning | No fade, stand aside or flip bias |
Common Questions About Value Fades
What does fading the POC mean?
Fading the POC means trading against a stretched move, expecting price to return to the point of control, the price where the most volume changed hands. You sell strength above the value area or buy weakness below it, targeting the POC as the destination. The trade works because the POC represents proven two-sided business, and prices that failed to attract business tend to fall back toward prices that did.
What if price accepts outside the value area?
If trade builds at the new prices and volume accumulates there, the market is accepting the move, and the fade is off. Acceptance means the old value area is being left behind and the profile will migrate. The correct response is to stand aside or trade with the new direction, never to fade harder. The evidence test, failed auction versus building trade, decides this before entry.
When is a POC fade most reliable?
A POC fade is most reliable on high-volume sessions with a well-formed profile, after a clear probe outside value that stalls on thinning volume and re-enters the value area. Balanced, rotational market conditions help, and a profile with a fat, traded POC gives the target real meaning. Thin sessions, news-driven days, and strong trend days all degrade the setup.
Do POC fades work on any time frame?
Yes, the logic holds on any time frame where the profile is built from real volume, from intraday sessions up to weekly composites. The requirements stay the same: enough participation to make the POC meaningful, a clear rejection at the value area boundary, and a rotation back inside as the trigger. Shorter time frames demand faster execution; longer ones demand wider stops and more patience.
This lesson closes the mean reversion block, and with it Level 9: trusting the data, reading it vertically and horizontally, and now trading the rotation back to value form one connected view of volume. Level 10 opens the advanced layer, where the quantitative side of these same questions takes over.