Liquidity Voids vs Fair Value Gaps
A liquidity void is a stretch of chart where price moved so fast that almost no two-sided trading happened inside it, and a fair value gap is the precise, three-candle version of the same idea. The void gives you a zone. The gap gives you an exact band. Both come from the same event: buyers or sellers hit the market so hard that price skipped levels instead of trading through them.

Think of a void as the empty lot a demolition leaves behind when a building comes down too fast, and markets have a habit of returning to empty lots to build. That habit is why traders mark these areas at all.
One clarification before anything else. A gap between one session's close and the next open is a different animal, created while the market was shut, and it gets its own lesson. Everything below happens while the market is fully open.
What a Liquidity Void Actually Is
Picture a normal stretch of trading. Price moves up a little, pulls back, moves again. Buyers and sellers trade at most prices along the way, so the chart looks dense and overlapping. That is two-sided trade, and it is what healthy price action looks like.
A liquidity void is the opposite. It is a thin, hollow stretch sitting between two areas of that normal two-sided trading. Price entered one side, ripped through the middle with barely any transactions, and came out the other side. The candles inside it are long, they barely overlap, and their wicks are short or missing.
The key detail is timing. A void forms mid-session, while the market is fully open and everyone can participate. Nothing was closed. The market simply moved faster than the other side could respond.
Why mark it? Because price that skipped levels tends to come back to them. The skipped stretch represents business the market never did, and unfinished business has a pull. Traders treat the void as a zone where a future return is plausible, then watch how price behaves if it gets there.
That is a tendency, not a law. Some voids sit untouched for months.
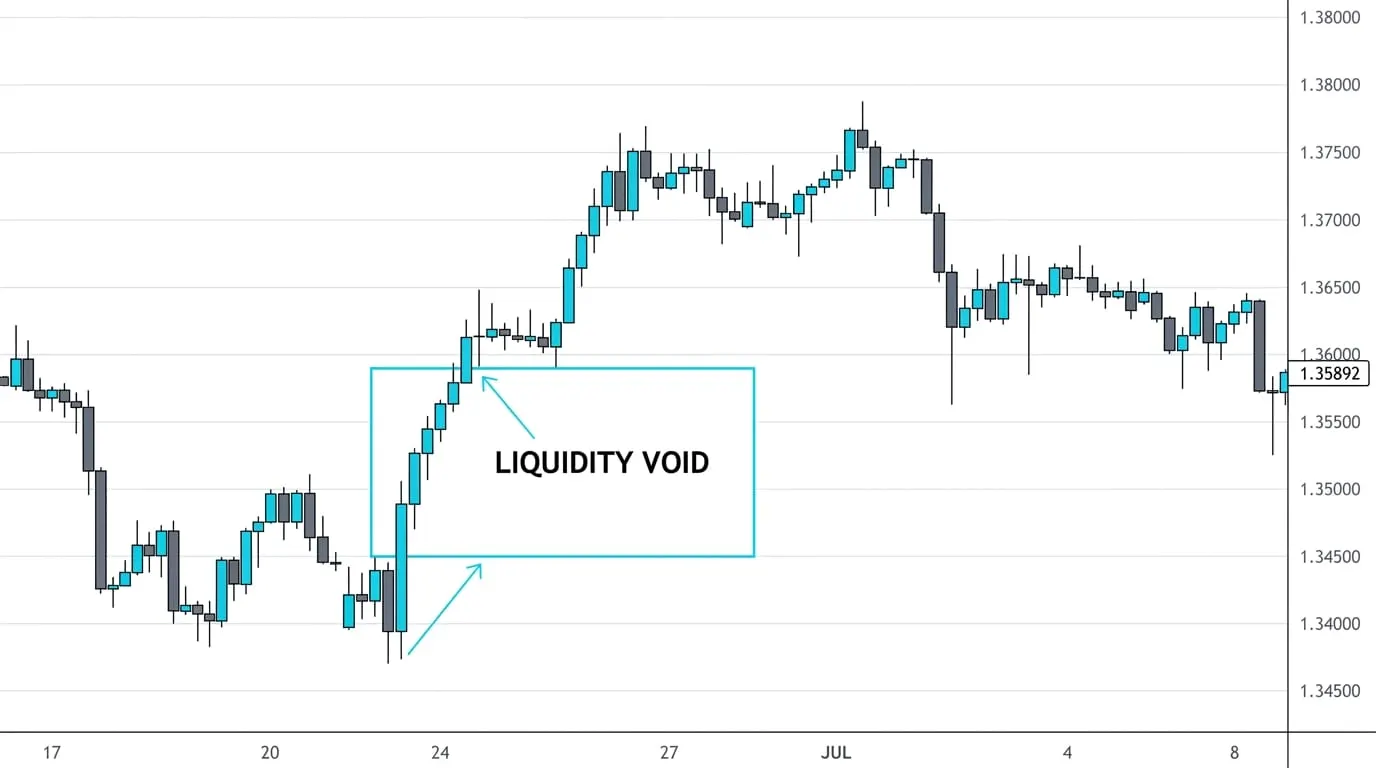
How a Liquidity Void Forms
Every void starts the same way: one side overwhelms the other. Buyers lift every offer in sight, or sellers hit every bid, and the result is an impulse run of momentum candles with no pause between them.
Three triggers account for most of them:
- News landing mid-session. An earnings surprise, a data release, a central bank comment. Repricing happens in seconds, and price jumps across levels that would normally take an hour to cross.
- A large order hitting at once. An institution executes a size the book cannot absorb quietly. Price slides through thin liquidity until the order is filled.
- The market catching up after a quiet stretch. Price compresses, energy builds, and the break out of that compression travels fast because nearby liquidity was already consumed.
Notice what all three share. Speed plus one-sidedness. When you see a run of candles with almost no overlap, you are looking at the signature of that combination.
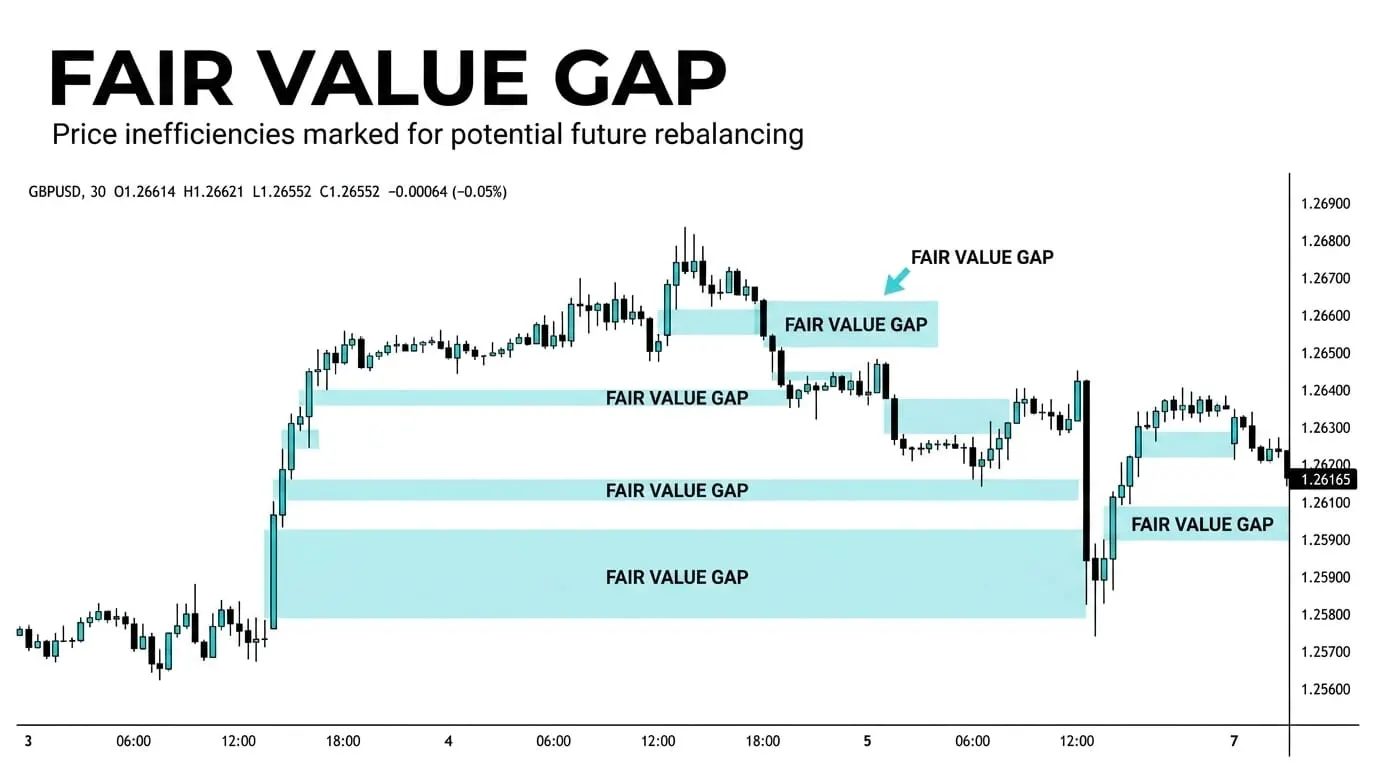
Fair Value Gaps: A Short Introduction
The fair value gap is the precise, rule-based version of the same idea. It takes exactly three candles. The first candle sets a boundary. A strong middle candle drives away from it. The third candle never trades back into the first candle's range.
What is left behind is the untraded band between the first candle's extreme and the third candle's extreme. That band is the imbalance, the fair value gap. It is the one slice of the fast move where you can say with certainty that no two-sided trade occurred, because the candles on either side never overlapped.
Treat this as a first look. A fuller lesson on imbalances, how to grade them, and how traders build plans around them comes later in the program. For now, hold the definition and the shape in your head.
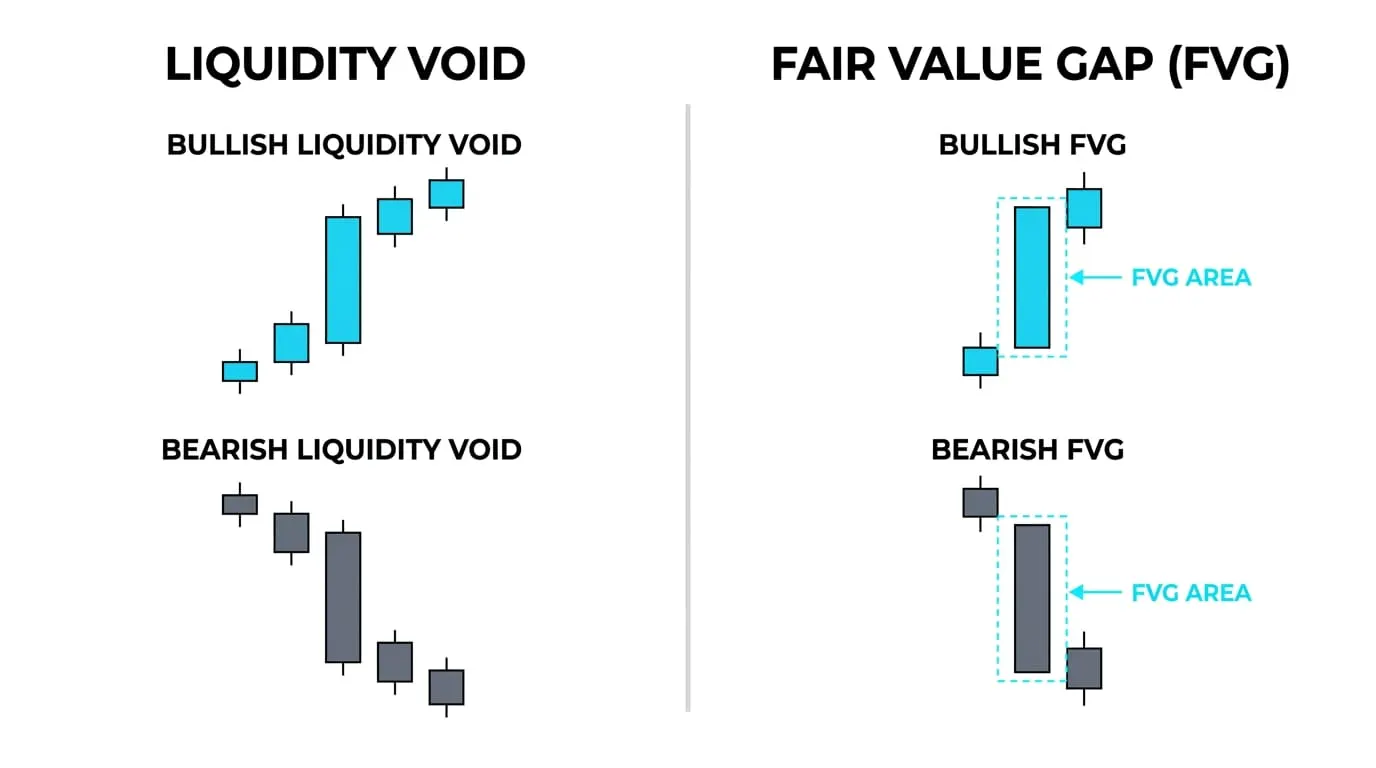
Liquidity Voids Versus Fair Value Gaps: What Actually Separates Them
Start with the relationship. Every fair value gap sits inside a liquidity void, because three non-overlapping candles are by definition a fast, one-sided move. Most voids, though, are too wide and loosely shaped to fit the three-candle rule. A void can sprawl across twenty candles with a few small pauses inside it. No single three-candle window captures that.
So the practical difference is resolution. The gap marks precisely. You can draw its top and bottom to the tick, which makes it usable as an entry zone with a defined invalidation. The void reads as context. It tells you a large stretch of chart was skipped, which shapes your expectations, but its edges are soft and arguing over the exact boundary misses the point.
Same underlying idea, two resolutions. Use the void to understand the terrain. Use the gap to plan the trade.
The Impulse and the Return
Here is a hypothetical with round numbers. A stock breaks out from 100 and runs to 108 in six strong candles. Inside that run, the stretch from 102.50 to 104.50 is thin: long bodies, almost no overlap, barely any two-sided trade. That stretch is your liquidity void.
Inside the void sits a cleaner structure. One three-candle sequence leaves an untraded band from 103.20 to 104.10. That is your fair value gap, nested inside the wider void.
Three weeks later, price drifts back down from 108. It enters the void and keeps falling, which is normal, because the void is context rather than a line. Then it reaches 103.20 to 104.10 and the character changes. Candles shrink. Downward progress slows. Price decelerates into the band and holds.
A hypothetical plan treats the gap as the zone. Entry somewhere inside 103.20 to 104.10 after price shows it is responding. A stop below 102.30, which sits under the entire void, so the trade is only wrong if the whole skipped region fails. A first target back at the 108 high, the origin of the return.
Notice the logic of zone versus band. The void told you where a return was plausible. The gap told you where, inside that region, to actually act. The stop placement respects the wider structure while the entry respects the precise one.
Now the honest part. Sometimes price blows straight through the gap, the void, and your stop level without pausing. In those cases the original move was momentum rather than a temporary imbalance, and there was never unfinished business to come back to. The market told you before your stop did, if you were watching the speed of the return instead of hoping.
Three Fast Moves, Side by Side
| Type | Definition | Precision | Best Use |
|---|---|---|---|
| Opening gap | Space between one session's close and the next open | Exact, set by the two prints | Separate lesson; session-transition analysis |
| Liquidity void | Thin, hollow stretch between two areas of two-sided trade, formed mid-session | Soft edges, a zone | Context: where a return is plausible |
| Fair value gap | Untraded band across a strict three-candle sequence | Exact band, drawn to the tick | Entry zone with defined invalidation |
| What all three share | Price skipped levels | Varies by type | Marking unfinished business on the chart |
Liquidity Voids and Fair Value Gaps, Answered
Is every fair value gap inside a liquidity void?
Yes, by construction. Three candles that never overlap are a fast one-sided move, and a fast one-sided move is what a void is. The gap is always the precise core inside the looser zone. The reverse fails, because most voids are too wide and messy to satisfy the three-candle rule.
Do voids always get filled?
No. Many do, eventually, because skipped levels attract return visits. Some take months. Some never fill at all, especially when the move that created them started a genuine repricing rather than a temporary shock. Treat a void as a place to pay attention, never as a promise.
Which timeframe shows voids best?
The timeframe where the impulse actually happened. A news-driven void on a five-minute chart may be invisible on the daily, while a daily void from an earnings run contains dozens of small lower-timeframe voids inside it. Match the timeframe to the event you are studying, and check one timeframe up for context.
How do I mark a void on my chart?
Find the last area of normal overlapping trade before the fast move and the first area of normal trade after it. Draw a rectangle across the thin stretch between them. Then look inside for any strict three-candle gap and mark that band separately. Two boxes, two jobs: the wide one for context, the narrow one for planning.
Once you can see voids and gaps on your own charts, the next step is learning how imbalances get graded and traded with structure around them. That fuller lesson is coming, and it builds directly on what you marked here.