Indicator Confluence Without Chart Clutter
Confluence is several independent readings pointing at the same conclusion at the same time, and that is its whole definition. It raises confidence because different tools fail in different ways, so when they agree, the odds that all of them are wrong at once drop sharply. The catch is that the tools must be genuinely independent, and few.

Think of security cameras covering the same doorway from two different angles: one camera can misread a moment, but two honest angles that agree are harder to argue with. Agreement is evidence only when the witnesses did not copy each other.
What Confluence Actually Means
Confluence means independent evidence converging on one conclusion at one price zone. A moving average says the trend is up. A momentum gauge says selling pressure is fading. A prior level says buyers defended this price before. Three separate claims, one shared message.
The independence condition is not negotiable. A 20-period average and a 50-period average are cousins, not witnesses. They both read the same closes, so they will usually agree no matter what the market is doing.
The same trap hides inside a single indicator. A moving average's slope and its position relative to price look like two signals. They are one reading counted twice.
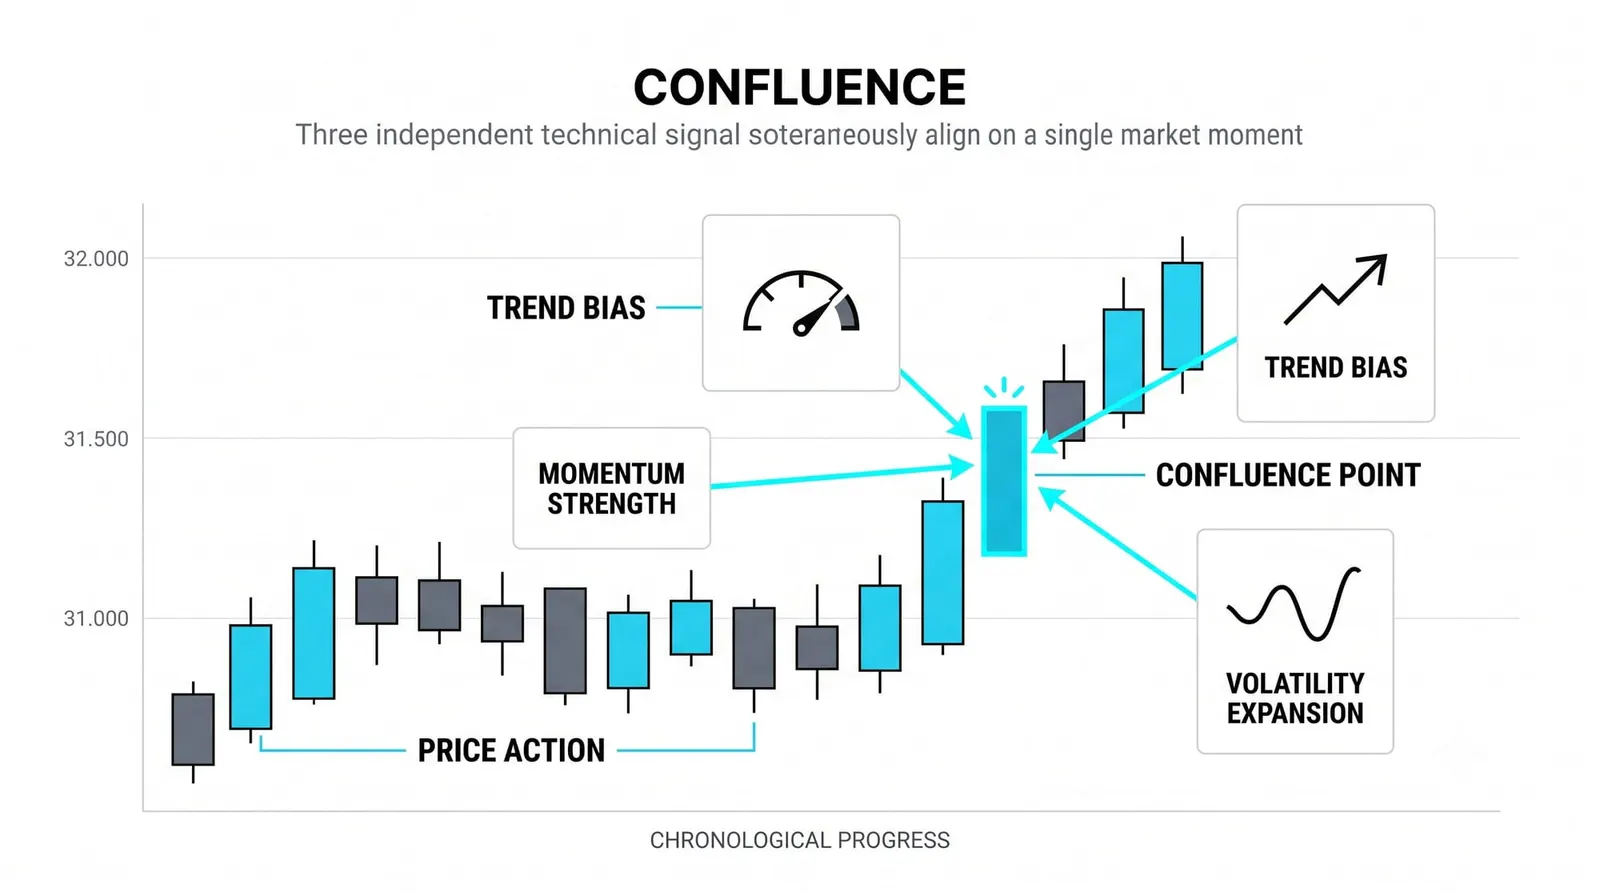
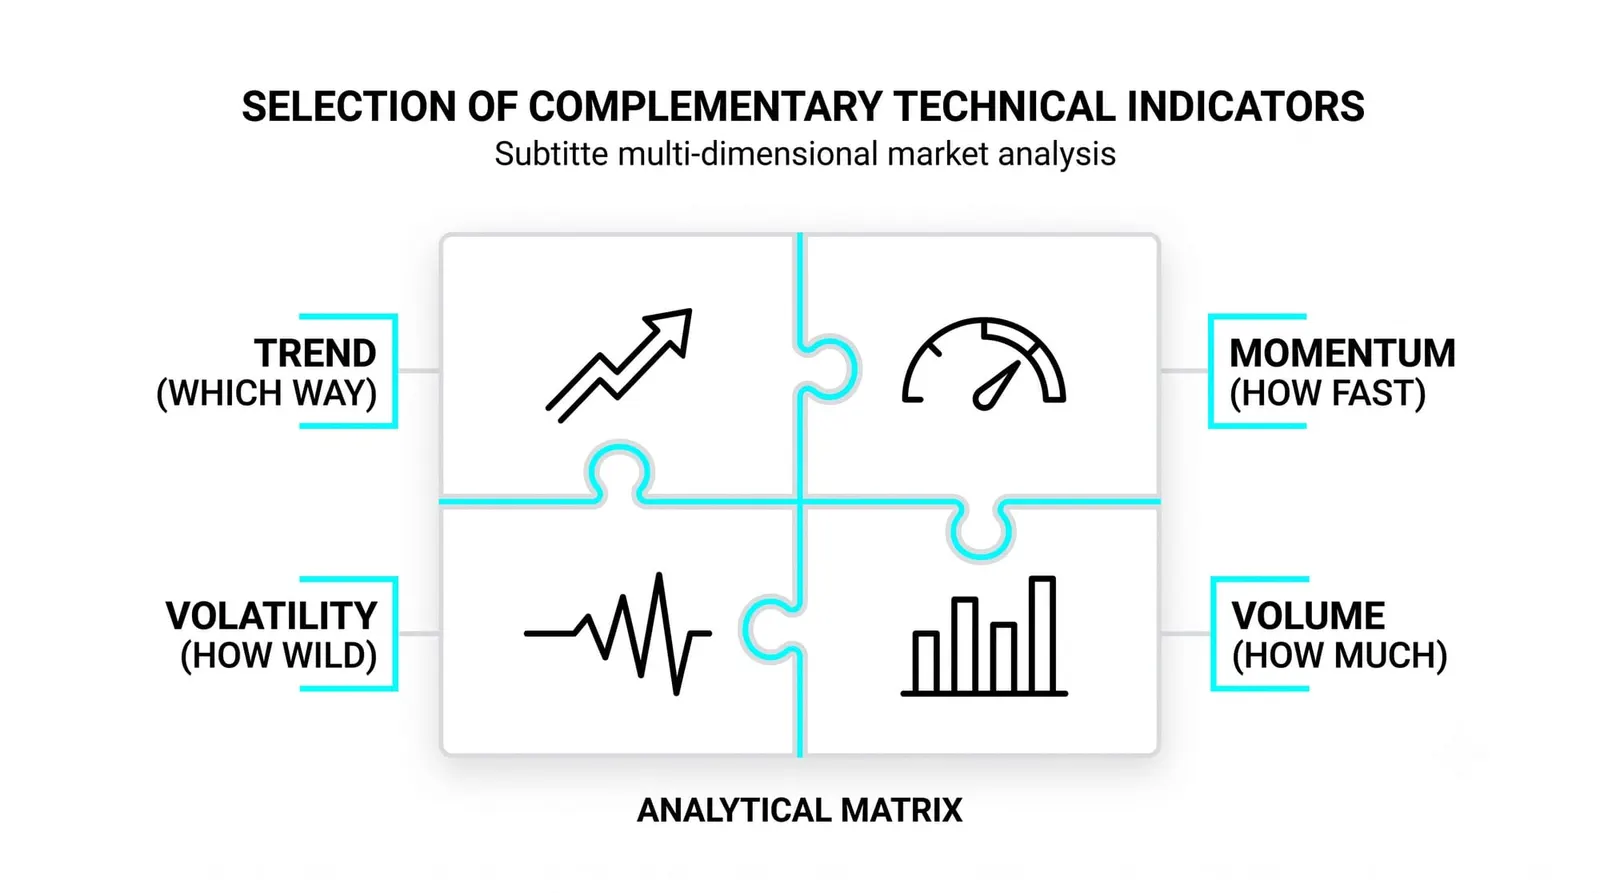
Earlier in this level you met the four categories of indicators. That lesson is the menu of families, and genuine confluence crosses families. Two tools from the trend family cannot confirm each other, no matter how different their names sound.
The previous lesson said indicators live inside rules. Confluence is how several tools serve one rule: the rule defines the trade, and each tool casts a vote on whether the conditions are met.
Why Stacking Similar Indicators Doesn't Add Confirmation
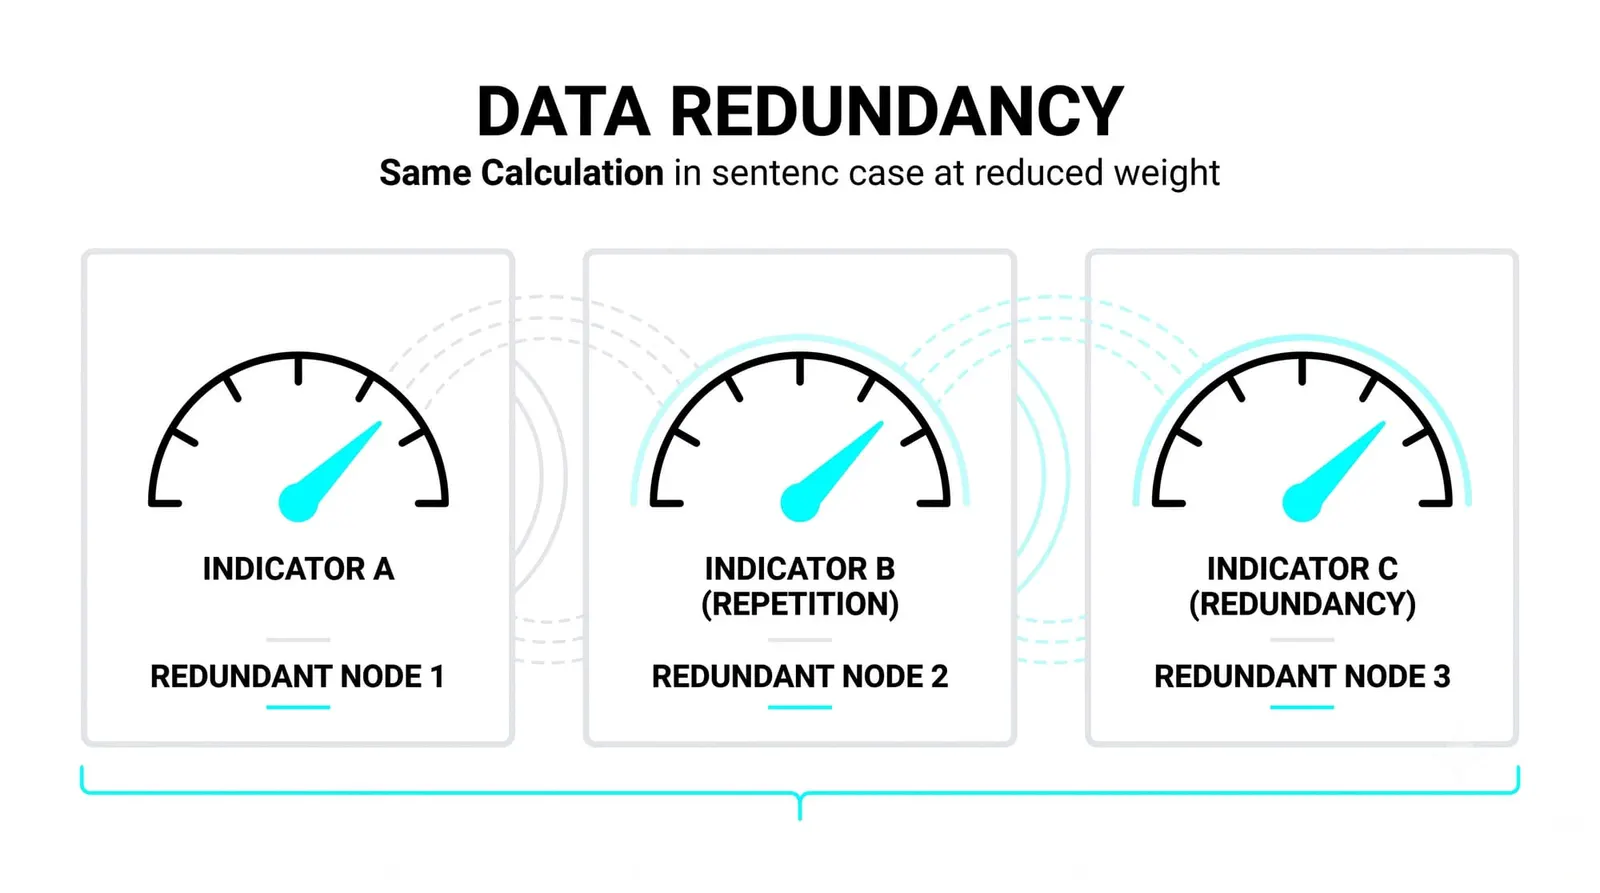
Five windows on the same closes is one opinion in five colors. If you plot three trend-following averages and two momentum oscillators built from the same price data, you have not gathered five opinions. You have asked the same question five times.
Cousin tools agree because they must, not because the market spoke. Their math overlaps so heavily that disagreement between them would be a rounding error, not a signal.
The overload trap follows naturally. A trader adds indicator after indicator, feels more informed with each one, and ends up with a chart too crowded to read and a decision process too slow to act on. When the tools conflict, the trader freezes. When they agree, the trader mistakes redundancy for proof.
More lines on a chart is not more information. It is the same information in different clothes.
How to Pick Tools That Actually Complement Each Other
Build your stack the way you would build a small crew: one read per family, each covering another's weakness. A practical starting set has three members.
- A trend filter. A moving average or a similar tool that answers one question: which direction am I allowed to trade? It fails in sideways chop, which is why it needs partners.
- A momentum read. A histogram or oscillator that answers: is pressure building or fading right now? It fails in strong trends by calling tops too early, which is why the trend filter overrules it on direction.
- A level. A prior high, low, or supply and demand zone that answers: where does this trade make sense on the map? Levels fail when price slices through them, which is why momentum confirms the defense.
Each tool covers a blind spot the others have. The trend tool ignores timing. The momentum tool ignores direction. The level ignores both but anchors location. Together they form a complete question: right direction, right pressure, right place.
Three honest votes beat eight cousin votes. Keep the stack small enough that you can state each tool's job in one sentence. If you cannot explain what a tool adds that the others lack, delete it.
What Confluence Looks Like on a Real Chart
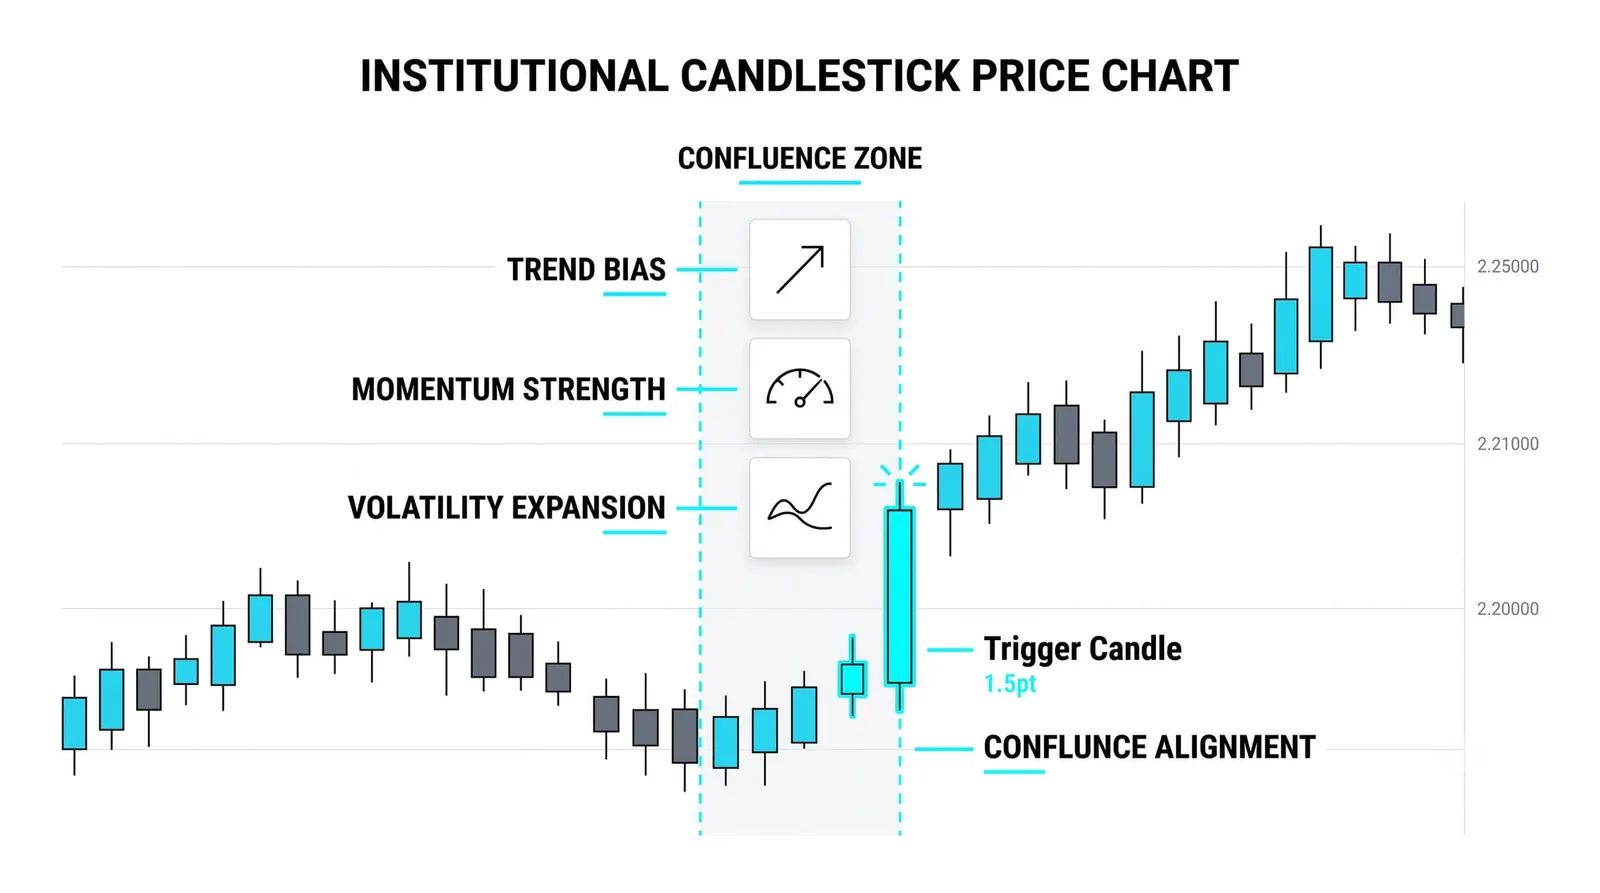
Assemble the stack from what this level has covered: a moving average for trend, the MACD histogram for momentum, and a prior level for location. Now read the chart as a vote count.
Two votes means watch. The average holds and the level lines up, but momentum still fades? You wait. The setup is forming, not formed.
Three votes means act, according to whatever rule you wrote beforehand. The point of counting votes is that the decision was made in advance, not improvised in the moment.
Disagreement is also information. When the trend tool says up and momentum says fading hard, the market is telling you the picture is mixed. A mixed picture is a reason to stand aside, and standing aside is a position too.
Three Votes, One Price
A hypothetical stock pulls back to 52 after a strong run. Every number here is invented and round, purely for illustration.
Vote one: the rising 50-period moving average sits at 51.8. Price dips to 52, touches the zone just above the average, and holds. Trend says the pullback is happening at support, not through it.
Vote two: the MACD histogram, which had been shrinking as price fell, stops shrinking. The next bar re-expands. Momentum says the selling pressure is spent.
Vote three: 52 is the level of the old breakout, the price where the stock cleared resistance weeks earlier. Location says buyers have defended this exact ground before.
By midday, two votes are in: the level and the average. The trader watches. When the histogram turns, the third vote arrives, and the rule says act. The bounce follows.
Now the counter-case. A week later, price returns to 52 again. The level is still there, so one vote. But the histogram keeps shrinking, bar after bar, and the moving average has flattened and started to roll over. One vote alone. The trader waits for confirmation that never comes, and the bounce fails. Price falls through 52, and the trader who demanded three votes was flat for the whole drop. The same price, the same level, a completely different answer, because confluence measures agreement, not location.
| Agreement | What It Suggests | Failure Mode |
|---|---|---|
| Trend plus momentum | Direction and pressure align, location unknown | Entry mid-move, far from any level, poor risk placement |
| Trend plus a level | Right direction at a meaningful price | Level breaks because momentum never confirmed the defense |
| Momentum plus a level | Pressure turning at a known price | A countertrend bounce that dies against the larger trend |
| All three agreeing | Direction, pressure, and location align | Still fails sometimes; confluence shifts odds, never certainties |
Indicator Confluence, Answered
What does confluence mean in trading?
Confluence means several independent tools pointing at the same conclusion at the same time and price. The word stresses independence: the readings must come from different kinds of math or different kinds of information, or the agreement is an echo, not evidence.
How many indicators make real confluence?
Two or three independent tools are enough for real confluence. One tool per family, each with a distinct job, covers trend, momentum, and location. Past three, you are almost always adding cousins, and cousins add clutter rather than confidence.
Do confluencing tools have to come from different families?
Yes, crossing families is the entire test. Two trend indicators will agree automatically because they read the same data the same way. A trend tool paired with a momentum tool and a level can disagree, which is exactly what makes their agreement meaningful.
Does more agreement guarantee the trade works?
No agreement guarantees anything. Confluence improves the odds that your read of the market is correct, but every setup in the table above still fails some of the time. What confluence really buys you is a clear reason for the trade and a clear point where the reason is wrong.
You now have the full indicator layer: what the tools compute, how to read them, and how to combine a small set without drowning the chart. The next step is where every rule, level, and vote gets tested: building a complete trading plan and journaling what it actually does.