Simple Moving Average: SMA
The simple moving average is the mean of the last N closing prices, recalculated as each new close arrives. It is the most basic smoothing tool on the chart, and the foundation most other indicators are built on. When price jumps around from bar to bar, the SMA cuts through that noise and leaves you with one calm line that shows the general drift.

Think of the SMA as a rolling wagon that moves forward one day at a time, always averaging the last twenty closes it carries. Each new close climbs aboard, the oldest one drops off the back, and the average shifts a little. The wagon never sprints. It ambles, and that ambling is the point.
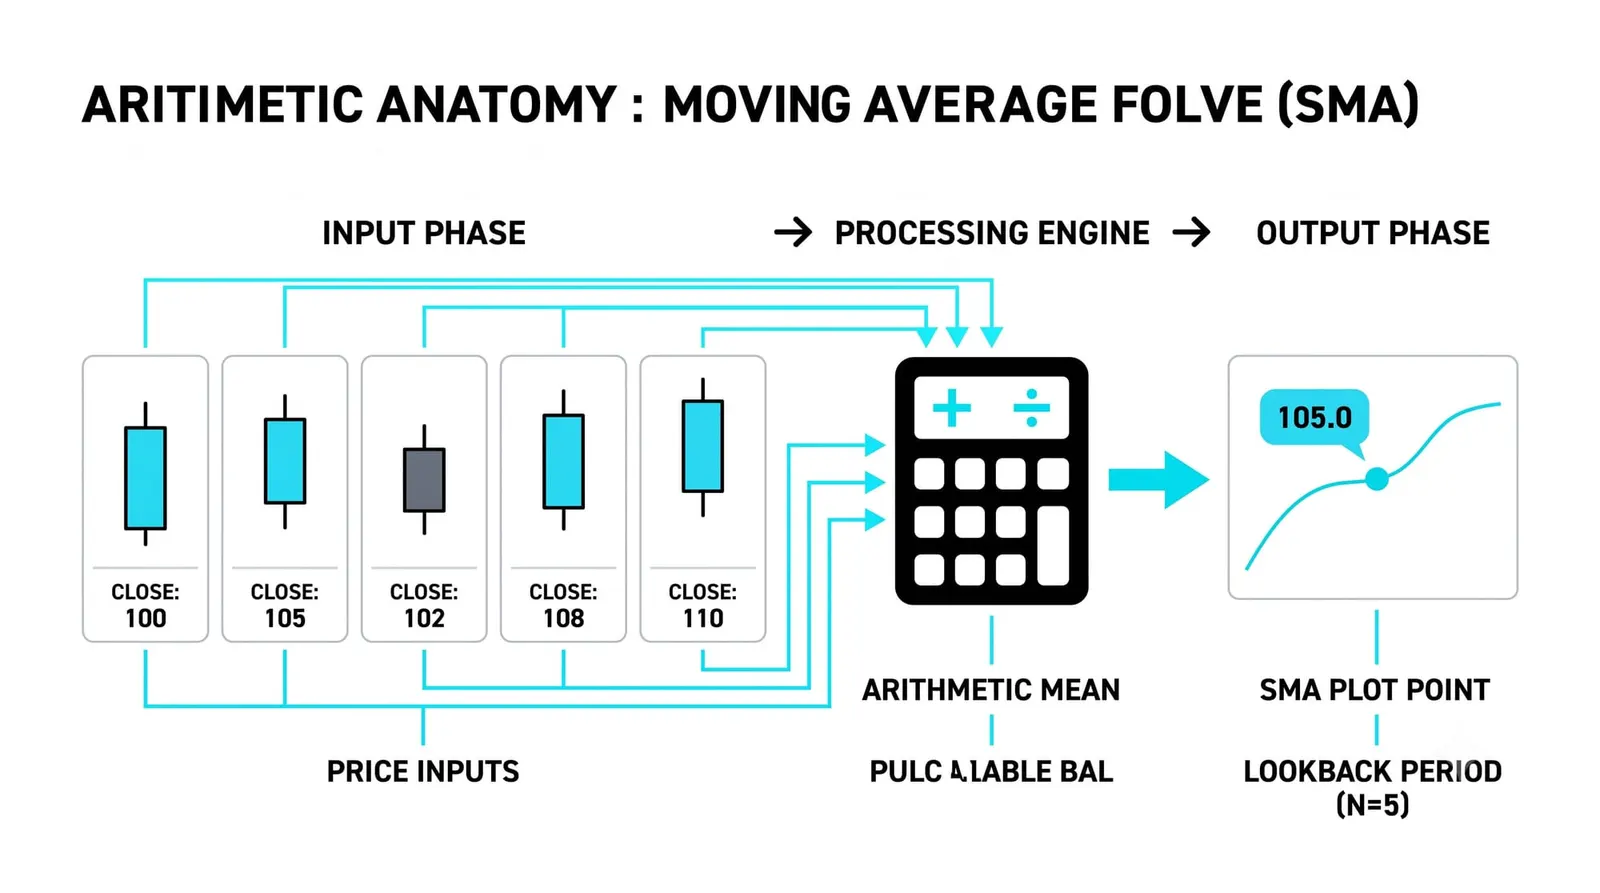
The previous lesson covered what indicators are in general: calculations derived from price, plotted to make certain features easier to see. The SMA is the first member of that family we take apart. Its cousin, the exponential moving average, weights recent prices more heavily and gets its own lesson next.
How the SMA Is Calculated
The formula is one line of arithmetic. Add the last N closing prices together, then divide by N. A 20-period SMA on a daily chart adds the last twenty daily closes and divides by twenty.
Take five closes as a micro-example: 10, 11, 12, 13, 14. The sum is 60. Divide by 5 and the SMA5 reads 12. That single number is the average price accepted over those five sessions.
The "moving" part comes from what happens next. When a new close prints, you drop the oldest close from the set and add the new one. The window slides forward by exactly one bar. Nothing else changes.
This is why the line updates even when price goes nowhere. If the new close matches the one that dropped off, the average holds flat. If the new close is higher than the departing one, the average ticks up. The SMA reacts to the difference between what enters and what leaves, not to the absolute level of price.
Every bar carries equal weight. The close from twenty days ago counts exactly as much as yesterday's close for as long as it stays inside the window. Then, on the day it falls out, its influence goes to zero all at once. Keep that mechanic in mind, because it explains several quirks you will see later.
What the Line Actually Shows
Read the SMA as the smoothed direction of the last N bars. It answers one question: on average, where has price been accepted recently, and which way is that acceptance drifting?
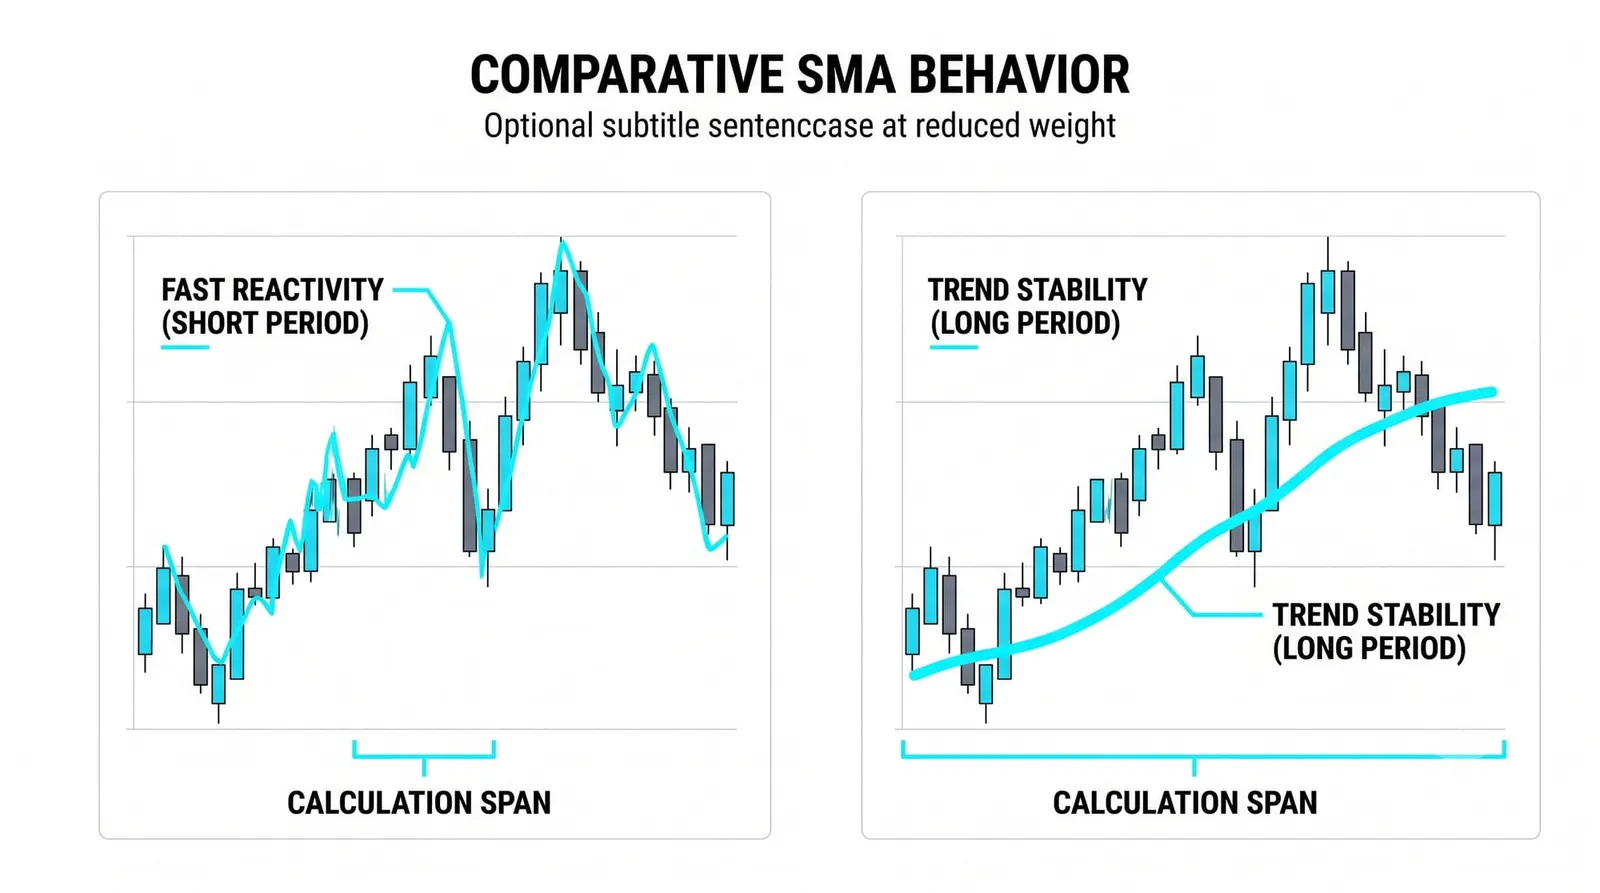
The period setting controls the character of the line. A short period, say 10, hugs price closely. It turns quickly, follows every swing, and still filters out only the smallest wiggles. A long period, say 200, flattens into a slow arc that barely notices a single wild session.
The tradeoff is plain. Smoothness and responsiveness pull against each other. A shorter line responds faster but whips more. A longer line stays calm but turns late. You pick which error you prefer to live with, because you cannot remove both.
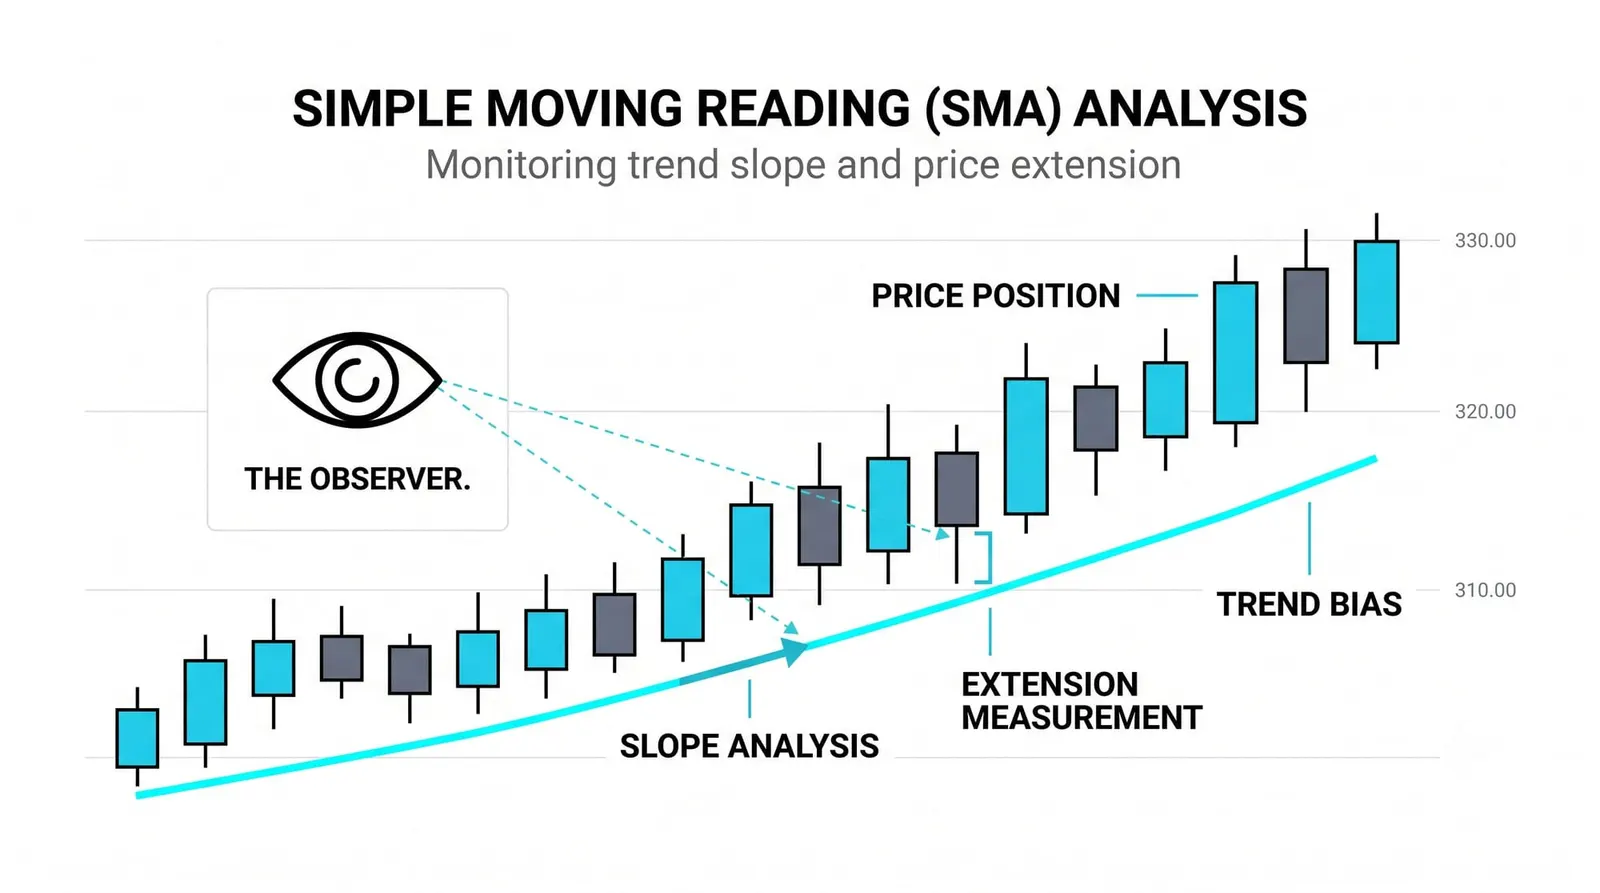
One useful habit: stop reading the line's level and start reading its slope. A rising SMA means recent closes are, on average, higher than the closes they replaced. A flat SMA means the market has gone sideways over that window. The slope is the information. The position is mostly context.
How Traders Use It
The most common use is a trend filter. Price above a rising SMA suggests buyers control the recent average, so many traders only look for longs. Price below a falling SMA flips the bias to shorts or to standing aside. The rule is crude, and crude is sometimes fine.
In a trending market, the SMA often acts as dynamic support or resistance. Price pulls back to the line, finds buyers or sellers there, and continues. Traders watch for reactions at the line rather than treating it as a wall. It marks a zone where the average participant's cost basis roughly sits.
Slope does heavy lifting here too. A flat SMA is a poor reference for bounces because the market has no directional commitment. A steeply sloped SMA tells you the average has been moving with conviction, which is when reactions at the line tend to mean something.
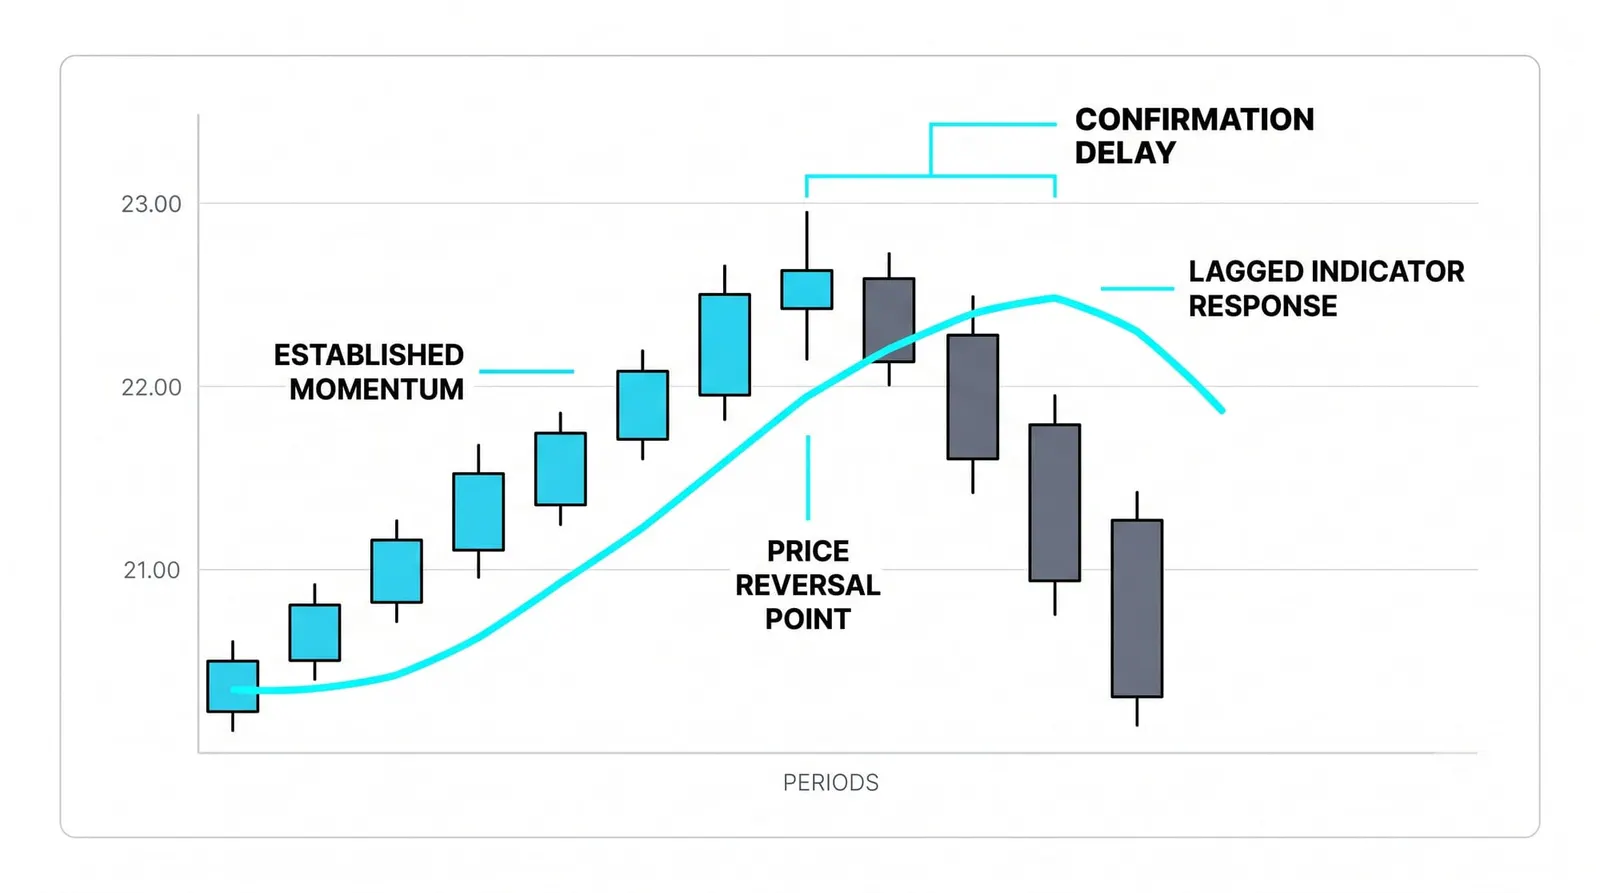
Crossovers are the use you will see everywhere, and they deserve skepticism. When a fast SMA crosses above a slow SMA, it confirms that recent prices have risen relative to older prices. By the time the cross prints, the move that caused it is already well underway. The signal is real but late. What that lag costs you is the early part of every trend, plus a string of false crosses whenever the market chops sideways.
The Weaknesses: Lag and Chop
The SMA is always behind, by construction. It averages the past, so it can only describe the past. A 50-period line reflects the last fifty closes, and nothing about the formula lets it anticipate the next one.
Sideways markets expose this worst. When price oscillates around a flat average, it crosses the line constantly. Each cross looks like a signal and most of them fail within a few bars. Traders call this getting chopped up, and range-bound conditions produce it relentlessly.
No period setting fixes this. Lengthen the period and you get fewer signals, each one later. Shorten it and you get earlier signals, most of them noise. You reshape the problem with every adjustment. You never delete it.
Equal weighting adds one more quirk. A single dramatic close from twenty days ago still sits inside a 20-period SMA, pulling the line around, until the day it exits the window. On that exit day the SMA can jump even if the new close is unremarkable. The line moved because history left the sample, not because the market did anything. Traders who know the mechanic are not fooled by it. Traders who do not sometimes read meaning into a shift that was pure arithmetic.
Five Closes, One Line
Here is a hypothetical illustration with invented round numbers. Suppose a stock closes five straight sessions at 10, 11, 12, 13, and 14. The SMA5 is the sum, 60, divided by 5. The line reads 12.
Now the next session closes at 20, a huge single-day jump. The SMA5 drops the oldest close, 10, and takes in the 20. The new sum is 11 + 12 + 13 + 14 + 20 = 70. Divide by 5 and the line reads 14.
Price leapt from 14 to 20, roughly a 43 percent gain in one day. The SMA moved from 12 to 14, a rise of about 17 percent. The line absorbed the shock and translated it into a step, not a leap.
This is the smoothness working as designed. One extraordinary close counts as one-fifth of the average, so the line rises gradually and waits for confirmation from the next few sessions. If price holds near 20, the SMA climbs toward it over the coming days. If price collapses back to 13, the SMA barely noticed the spike, and that restraint saved you from chasing it.
The cost is visible in the same numbers. Anyone waiting for the SMA to "confirm" the move to 20 watched most of it happen first. Smoothness gives you steadiness and filters out one-day drama. Smoothness takes its payment in delay. Every moving average decision you make later is a version of this trade.
The Four Common Settings
| SMA Period | What It Smooths | How Traders Typically Use It |
|---|---|---|
| 20-period | Roughly one month of daily closes; short-term swings | Short-term trend bias; pullback reference in fast trends |
| 50-period | About one quarter of daily closes; intermediate swings | Intermediate trend filter; watched on index charts |
| 100-period | About half a year of daily closes; broader cycles | Medium-term bias; secondary support and resistance zone |
| 200-period | About a full year of daily closes; long-term direction | Long-term trend definition; bull-versus-bear dividing line |
None of these periods is magic. They became standard because traders kept using them, and they keep working as reference points partly because so many eyes watch the same lines. Treat them as conventions, not laws.
The SMA, Answered
What is the best SMA period?
There is no best period, only a period suited to a purpose. Short periods track fast trends and whip often; long periods define slow trends and turn late. Match the period to the timeframe of the moves you actually intend to hold, and test it on historical charts before trusting it.
Why does price react to moving averages?
Partly because enough traders watch the same lines and place orders near them, which creates real buying and selling at those levels. Partly because the average approximates the recent cost basis of the crowd, so revisits of that level attract decisions. The reaction is a tendency, never a guarantee, and it fades badly in choppy markets.
Is the SMA better than the EMA?
Neither is better in absolute terms; they weight data differently. The SMA treats all closes in the window equally, which makes it steadier and slower. The EMA weights recent closes more heavily, which makes it quicker and twitchier. The next lesson breaks the EMA down fully so you can compare them on mechanics rather than reputation.
Can you trade using only an SMA?
You can build a complete rule set around one, and some traders do, but the line carries real limits. It lags by design, it fails in sideways markets, and it says nothing about momentum, volatility, or value. Most practitioners use it as one filter inside a larger process built on the price action and structure skills from earlier levels.
Next up, the exponential moving average: same idea, different weighting, and a clear look at what that extra responsiveness costs and buys.