Hull Moving Average: Reducing Lag
The Hull moving average is a moving average built with one aim: reducing lag. It turns near price turns while staying smooth, and it does this by subtracting a slow average from a fast one and then smoothing the difference. It is a clever trick. Where the SMA waits for the corner to end before turning, the HMA rides like a motorcyclist leaning in early, correcting before the corner is done.

You already know the problem it attacks. Every average you have studied so far, from the SMA to the WMA, pays for smoothness with delay, and pays for speed with noise. The Hull moving average does not escape that tradeoff, but it pushes the boundary further than a simple weighting change can.
The Problem the HMA Was Built to Solve
Every moving average lags. By definition it is built from past prices, so it can only describe where price has been, and the longer the window, the older the information inside it.
The obvious fix is to shorten the period. A 10-period average reacts faster than a 50-period average. But shortening buys speed and loses smoothness, and the short line starts flinching at every minor pullback and every random jiggle in the data.
So you have two dials and they are welded together. Turn one toward smooth and lag rises. Turn the other toward fast and noise rises. The SMA, EMA, and WMA lessons each showed a different way to sit on that dial: equal weights, exponential decay, linear decay. None of them breaks the weld.
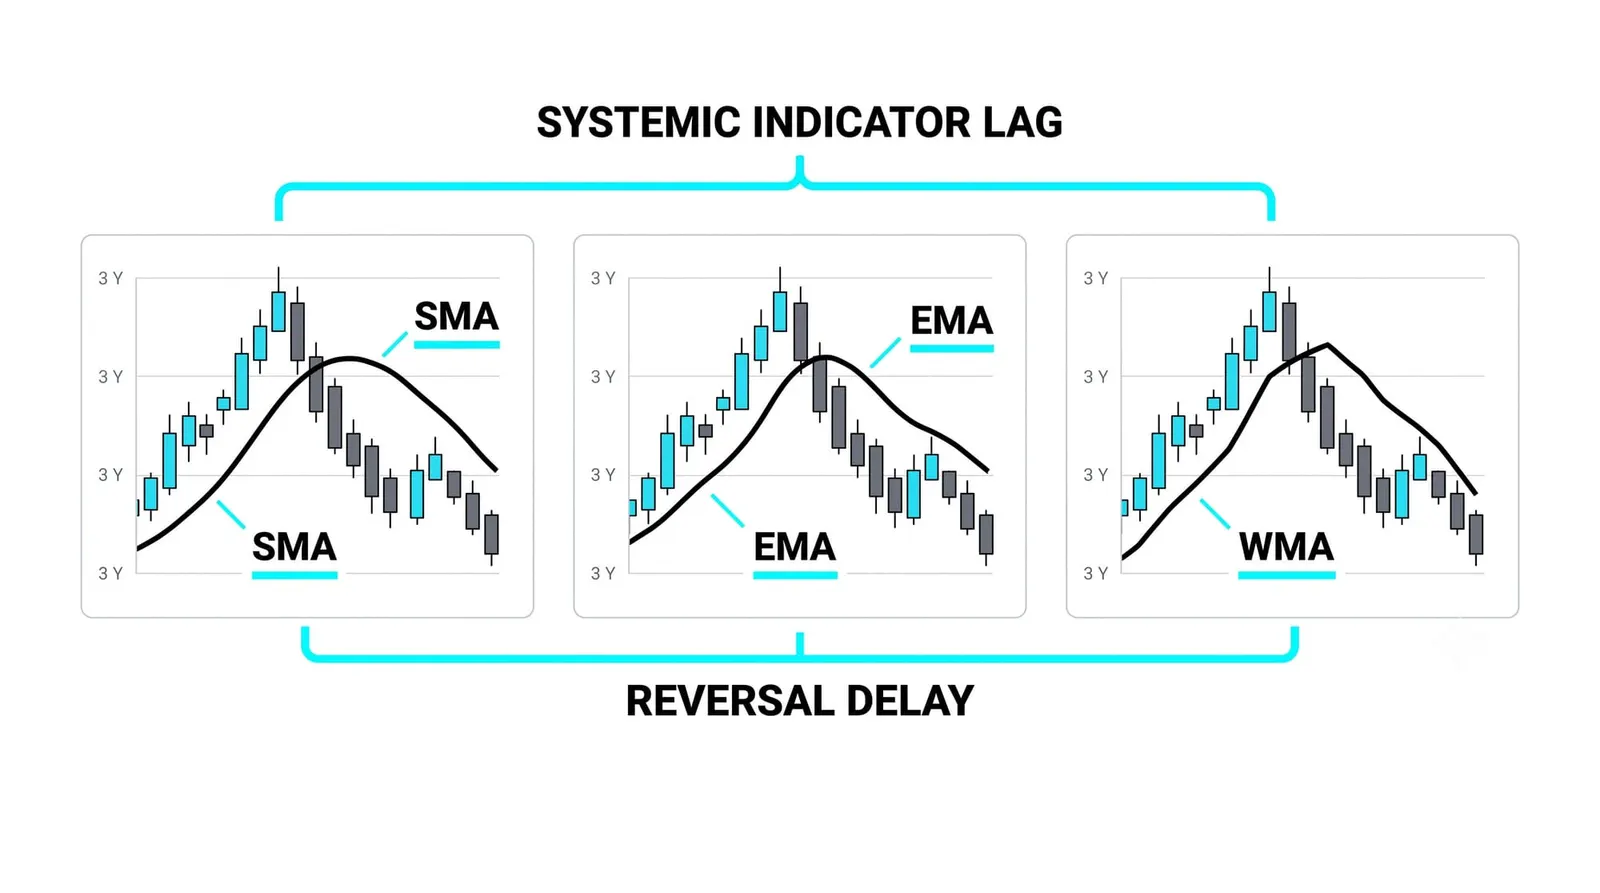
The HMA came from asking a better question of that tradeoff. Instead of re-weighting the same old prices, what if you could cancel the lag arithmetically before smoothing the result? The HMA is his answer, and it attacks the tradeoff head-on rather than picking a seat on it.
How the HMA Reacts Faster Without Just Shortening the Period
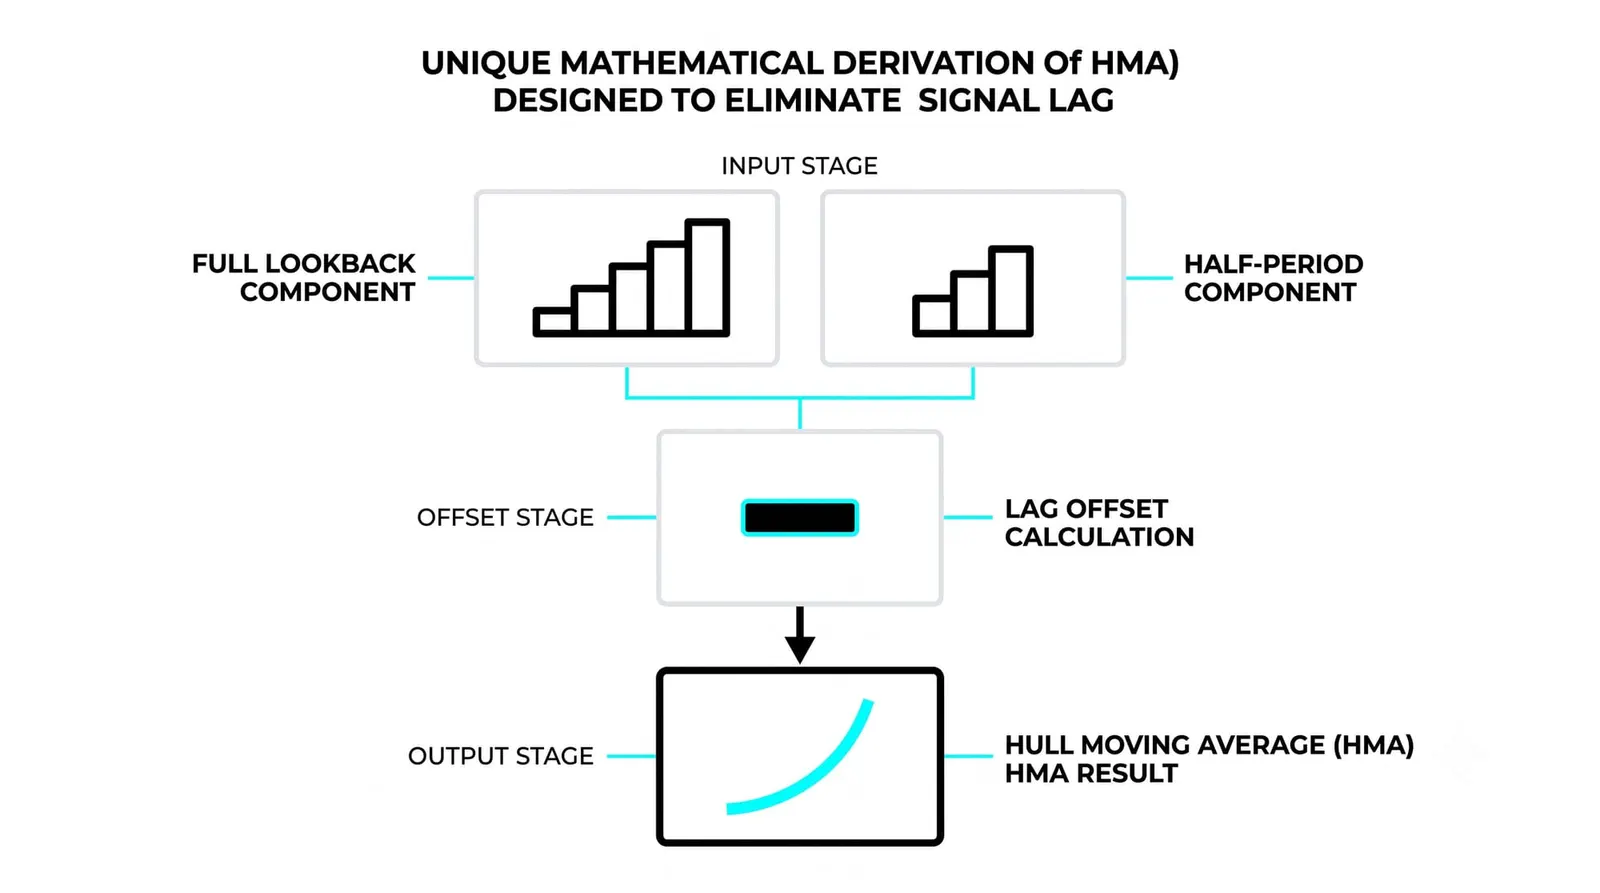
The recipe has three steps, and each one is simple on its own. Take a fast weighted moving average at half your chosen period. Take a slow WMA at the full period. Double the fast one, subtract the slow one, then smooth that difference with a WMA of a much shorter length, roughly the square root of the period.
The subtraction is where the magic lives. The fast WMA and the slow WMA both lag, but they lag by different amounts. When you double the fast one and subtract the slow one, the shared lag largely cancels out, and what remains is a raw line that sits much closer to current price than either input did.
That raw line is jumpy, because canceling lag also cancels some stability. So the final step smooths it with a short WMA, which re-adds calm at a small cost in delay. Because the smoothing window is short, the re-added lag is minor compared to what the subtraction removed.
The net effect: a line that turns almost as quickly as a very short average but reads almost as clean as a much longer one. No single weighting scheme on raw prices can do that. The HMA gets there by combining two averages against each other.
One honest caveat: the construction is more complex, and complexity hides behavior. You should understand the three steps before you trust the line, because a tool you cannot explain will be the first one you abandon at the wrong moment.
What the HMA Is Good At, and Where It Falls Short
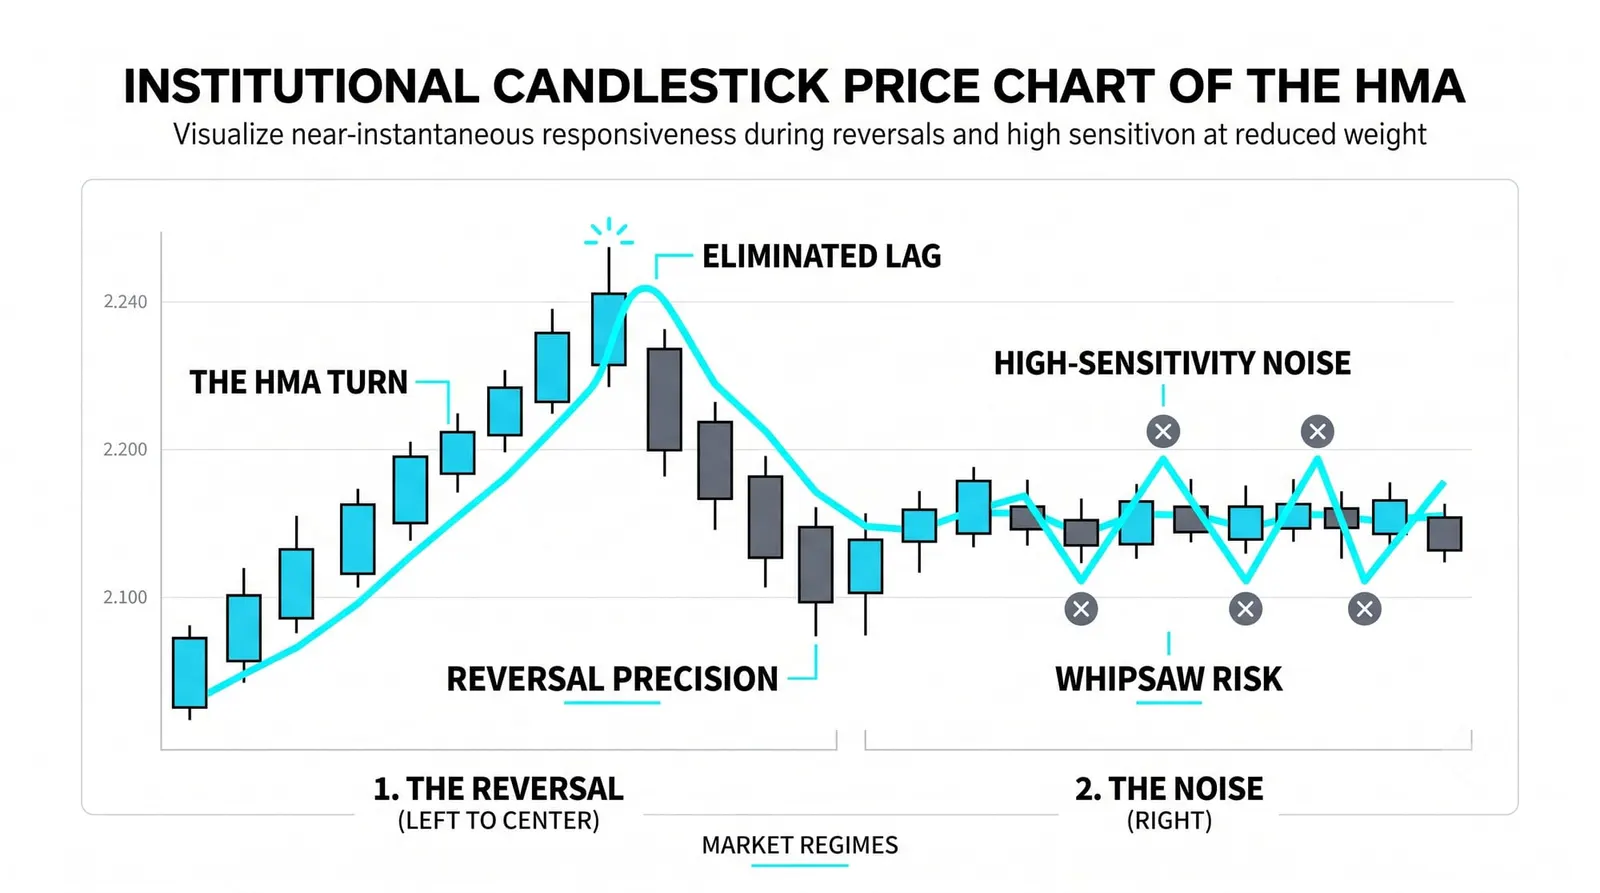
The HMA shines in trending markets. When price makes a genuine turn and runs, the HMA hooks around early and stays smooth through the pullbacks, giving you a clean read on direction with less delay than any of the averages you have studied so far.
Its slope is also unusually informative. Because lag is suppressed, the direction of the line itself tracks the direction of the move closely, and some traders use the slope change alone as a signal.
Now the costs. The same eagerness that turns the HMA early also makes it overshoot on spikes. A single violent bar can yank the line past where price settles, so the HMA can scream "turn" at what turns out to be a one-bar shock.
In a range, it whipsaws. A sideways market produces constant small turns, and an eager line turns with every one of them. The HMA gives you more signals in a chop zone, and most of them are false.
That combination explains why the HMA is rarely a default line despite the elegant math. Most charting platforms ship the SMA and EMA as standards, most published research uses them, and most traders reach for what everyone else reads. The HMA is a specialist's tool: excellent in its conditions, punishing outside them.
Where the HMA Fits Among the Moving Averages So Far
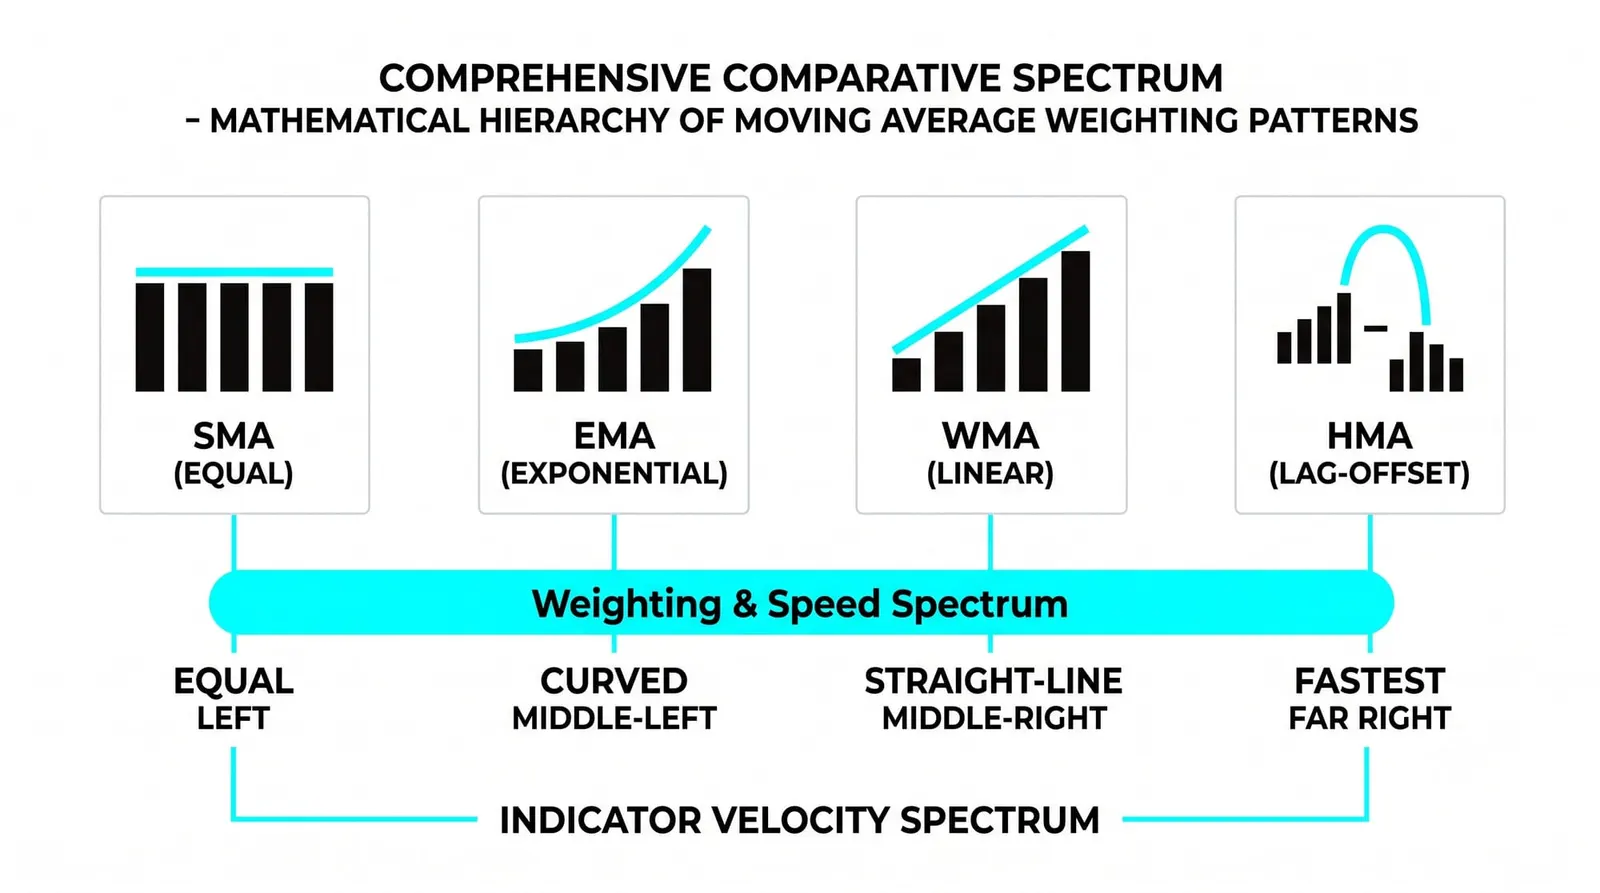
Line the family up by temperament. The SMA is the slowest and the smoothest: equal weights, long memory, late to everything, calm about everything. The WMA sits in the middle: linear weights favor recent bars, so it turns sooner and jitters a bit more.
The EMA is fast with a long memory. Its exponential decay front-loads recent prices but never fully forgets old ones, which makes it responsive yet stable enough to anchor tools like MACD, the two-EMA construction you will study in the next lesson. The HMA is the fastest to turn and the most eager of the four.
Choosing among them is choosing by job. If you want a slow institutional reference line that ignores noise, the SMA's bluntness is a feature. If you want a dynamic level for pullback entries in a trend, the EMA's balance works well. If you want early warning on direction changes and accept false alarms as the price, the HMA earns its place.
Choosing is also choosing by regime. Trending conditions reward fast lines. Ranging conditions punish them. A trader who runs an HMA through a choppy market and blames the indicator has misread the assignment: the tool is fine, the deployment was wrong.
None of the four is the best average. Each is a different compromise, and the HMA is simply the most aggressive compromise available in the family.
One Spike, Four Lines
Here is a hypothetical illustration with invented round numbers. Suppose five consecutive closes print 10, 10, 10, 10, and then a shock bar closes at 16. Nothing else changes. Watch what each 5-period line does the day after the spike.
The SMA5 averages the five closes equally: (10 + 10 + 10 + 10 + 16) / 5 = 11.2. Price closed at 16 and the line sits at 11.2. It barely noticed.
The WMA5 applies linear weights of 1 through 5, heaviest on the newest close: (10×1 + 10×2 + 10×3 + 10×4 + 16×5) / 15 = 180 / 15 = 12.0. Slightly better, still far below price.
The EMA5 uses a multiplier of 2/(5+1), or one-third. Starting from a flat value of 10, the new EMA is 10 + (1/3)(16 − 10) = 12.0. Same landing spot as the WMA. Different weightings can converge on one spike, because a single new bar dominates any short window no matter how you slice the weights.
The HMA turns soonest of the four by construction. Its fast-versus-slow subtraction cancels most of the lag before the final smoothing, so its line jumps furthest toward 16 on the spike day. Exact values depend on the period chosen, but the ordering is structural: HMA first, then EMA and WMA, then SMA trailing.
Now read what each line said the day after the spike, and what failure each choice buys:
- SMA at 11.2: says nothing happened. If the spike was a genuine breakout, you are blind to it. If it was a fake-out, you were right to ignore it.
- WMA and EMA at 12.0: say something happened, hedged. You get partial information and partial protection either way.
- HMA, furthest along: says the market turned. If the spike extends into a trend, you are positioned earliest of all. If price snaps back to 10 tomorrow, the HMA's overshoot is the worst of the four and it must now unwind.
Same five closes, four different stories. The line you choose decides which error you are signing up for before the market decides which error you would have preferred.
| Average | How It Weights Price | Lag Temperament |
|---|---|---|
| SMA | Equal weights across the whole window | Slowest to turn, smoothest, most dismissive of single bars |
| WMA | Linear weights, newest bar heaviest | Middle ground, turns sooner with modest added noise |
| EMA | Exponential decay, old data fades but never vanishes | Fast with a long memory, balanced for trend work |
| HMA | Fast WMA doubled minus slow WMA, then short-WMA smoothed | Fastest to turn, most eager, prone to overshoot on spikes |
The HMA, Answered
Is the Hull moving average better than the EMA?
No, it is faster than the EMA, which is a different claim. In trending conditions the HMA's early turns are an advantage; in ranging conditions that same eagerness produces more false signals than the EMA generates. Better depends entirely on the job and the regime, not on the math alone.
What period is standard for the HMA?
There is no single standard, but 16 and 21 are common starting points because the HMA's original formula used roughly that range, and some traders use 55 for slower reads. Whatever period you pick, the construction halves it for the fast WMA and takes its square root for the final smoothing, so the internals adjust automatically.
Why does the HMA overshoot?
Because the lag-canceling subtraction amplifies whatever the newest bar did. When a spike hits, the fast WMA jumps far more than the slow one, the doubled difference exaggerates the move, and the short final smoothing is too brief to fully tame it. The mechanism that removes lag is the same mechanism that overreacts to shocks.
Should beginners use the HMA?
Beginners should understand it before they use it, and should probably log screen time with the SMA and EMA first. The HMA rewards traders who can already tell a trend from a range, because deploying an eager line in the wrong regime is the classic way to lose confidence in a sound tool. Learn the calm lines, then add the eager one.