Moving Average Crossovers: Golden Cross
Moving average crossovers happen when one average crosses above or below another on the chart. The two famous versions, the golden cross and the death cross, use the 50-day and 200-day averages to flag long trend changes. The catch is the price of that signal: by the time the lines cross, the move they confirm has usually been running for weeks or months.

You already know how the moving average family is built. The previous lessons covered the SMA, the EMA and the WMA, and how each one averages price differently. This lesson is about what happens when you put two of them on the same chart and watch where they meet. Think of two watches that drift at different rates: only after one has run ahead for weeks does it visibly swap places with the other, and a crossover is that swap, written on the chart. The standard periods themselves, the 20, 50, 100 and 200, get their own lesson next. Here, the focus is on the crossing event and what it tells you.
What a Moving Average Crossover Actually Is
Plot two averages on one chart: a fast one with a short period, and a slow one with a long period. The fast average hugs price closely because it only remembers a few candles. The slow average moves in wide, lazy arcs because it remembers many.
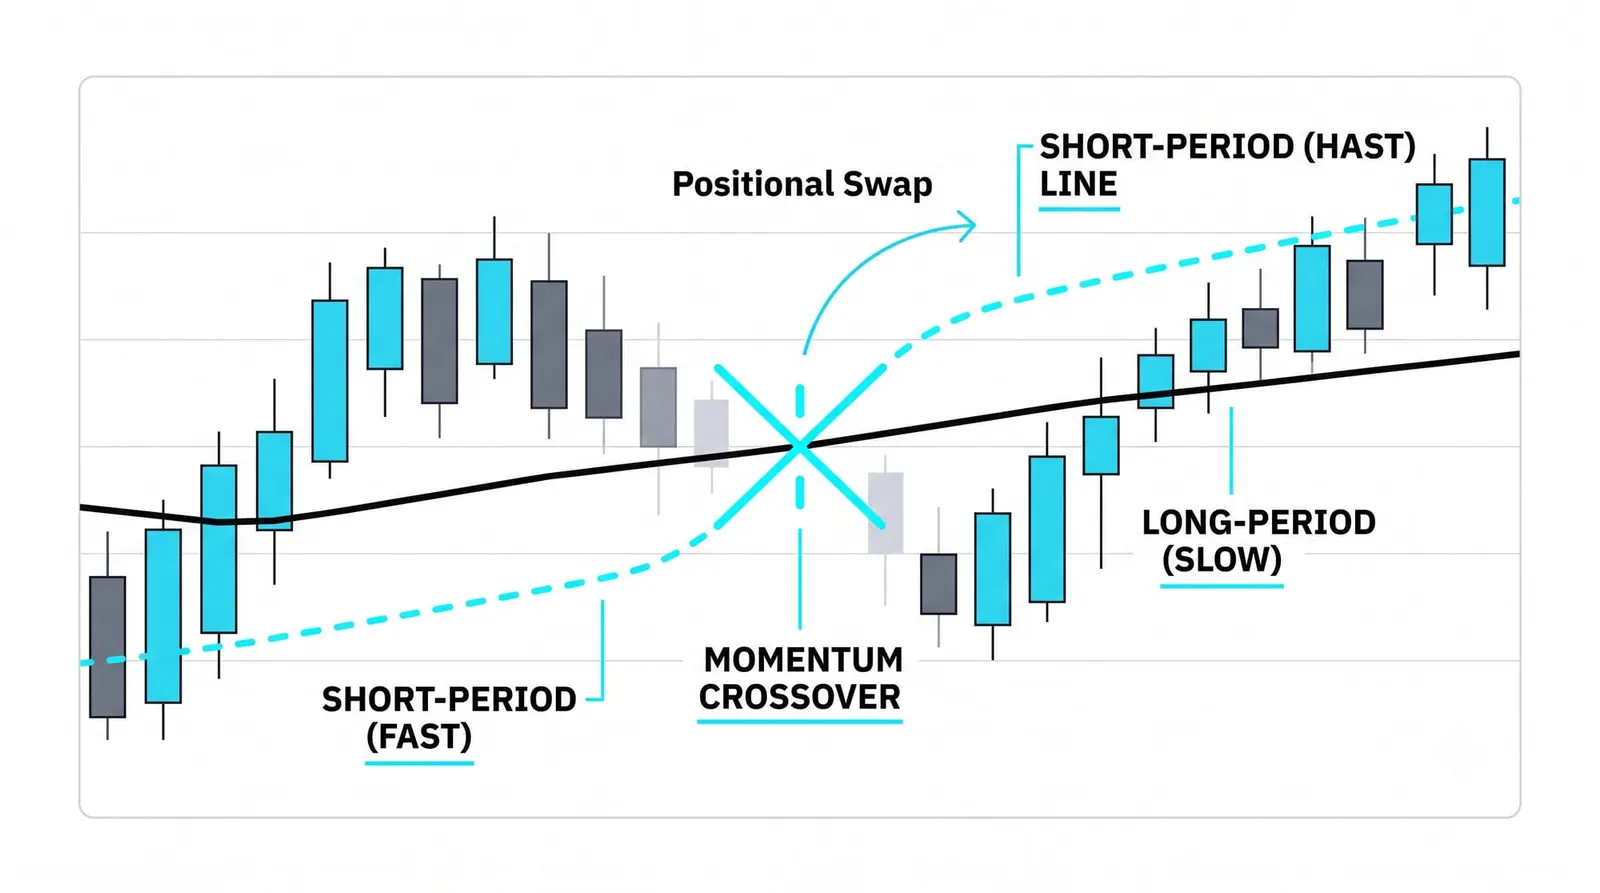
When price trends up long enough, the fast average climbs above the slow one. When price falls long enough, the fast average sinks below it. The crossover is the moment they trade places.
The direction rules are simple. A cross of the fast average above the slow average is bullish: recent prices have risen enough to outrun the longer history. A cross of the fast average below the slow one is bearish: recent prices have fallen enough to drag under it.
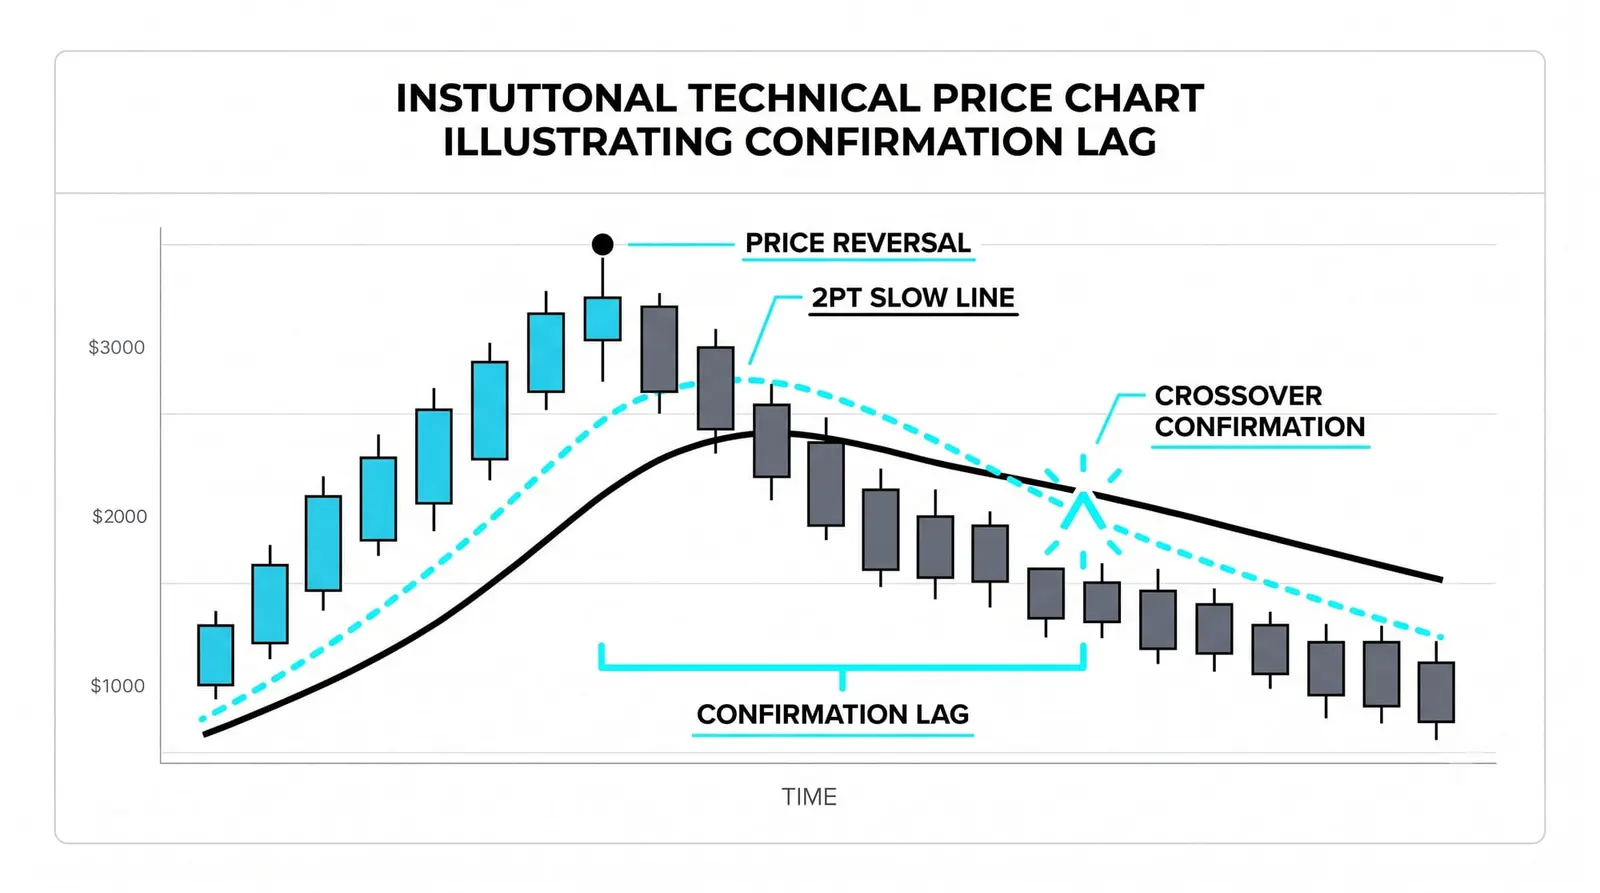
Notice what has to happen before the cross fires. The gap between the fast and slow averages has to build first, candle by candle, as the new trend pulls the fast line away from the slow one. The cross is the last step of that process, not the first. By the time the two lines touch, the trend they announce has usually been visible in price for a while.
That is not a flaw in the tool. It is what the tool is. A crossover does not predict a trend. It certifies that one has already run long enough to bend the slower average.
The Golden Cross: What It Signals
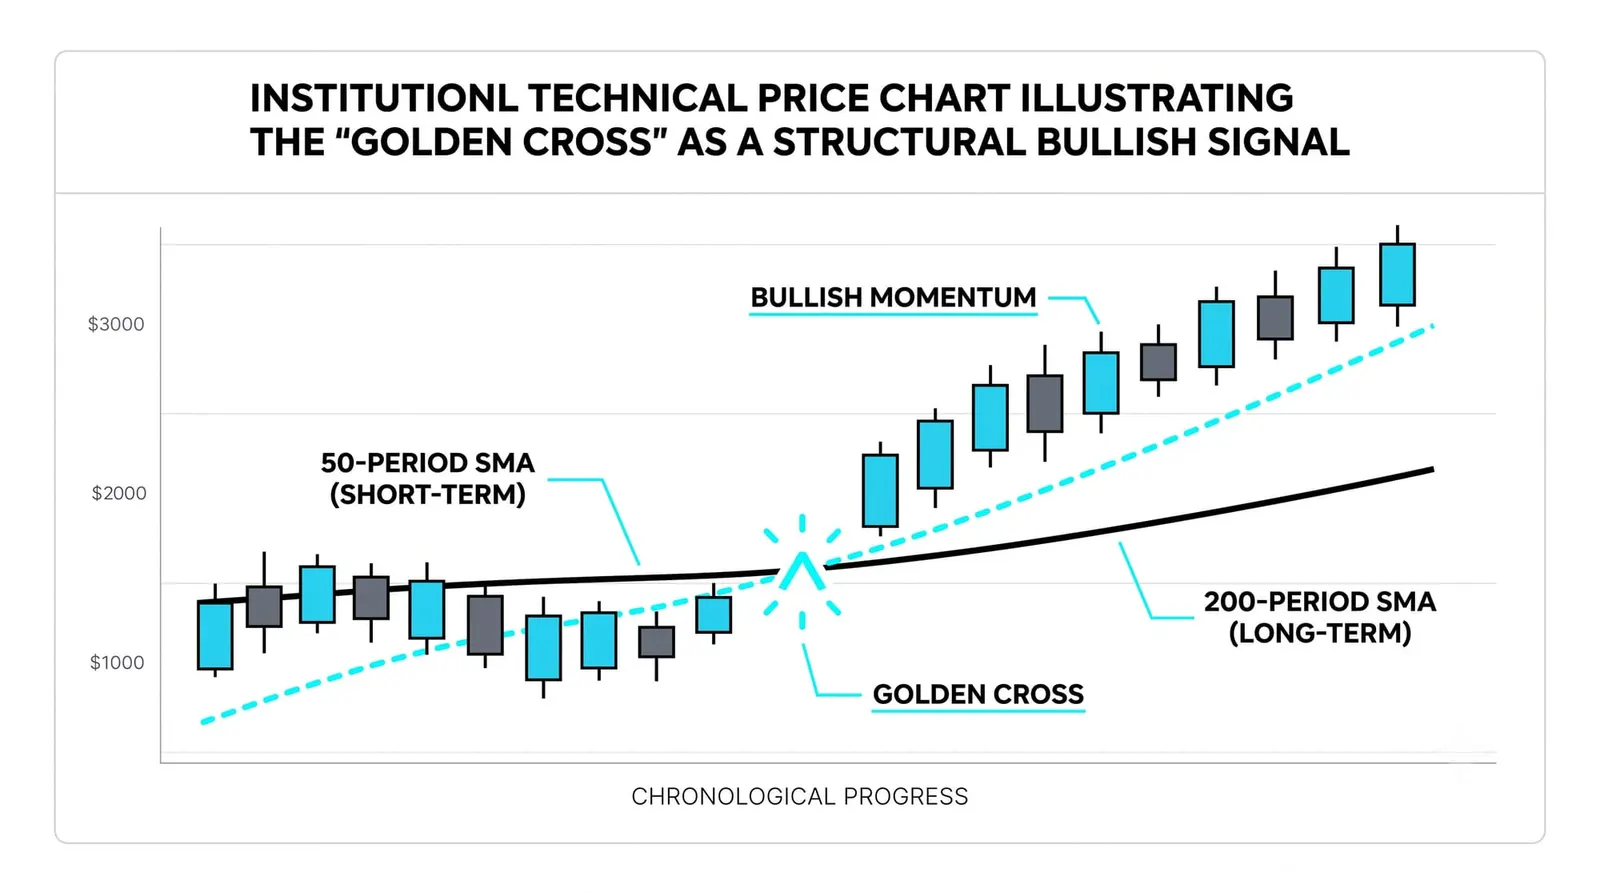
The golden cross is the bullish version of the classic pair. It fires when the 50-day average crosses above the 200-day average.
Read that mechanically. The 50-day holds roughly one quarter of trading. The 200-day holds close to a full year. For the quarterly average to climb above the yearly average, the last few months of prices must sit well above the average of the last year. The market has spent months going up.
So the golden cross confirms a long uptrend. Some traders treat it as an entry signal and buy when it prints. Others treat it as a regime filter: once the 50 sits above the 200, they only look for long setups until the lines cross back.
There is a second layer to this signal, and it is social. The golden cross is one of the most widely watched events in all of charting. Financial media covers it. Fund managers reference it. When a broad index prints one, a large pool of traders sees the same thing on the same day and some of them act on it.
That shared attention can give the signal a self-reinforcing quality in the short run. Buyers arrive partly because other buyers are expected to arrive. Do not confuse that with magic. The cross still only reports what price already did. The crowd just amplifies the announcement.
The Death Cross: What It Signals
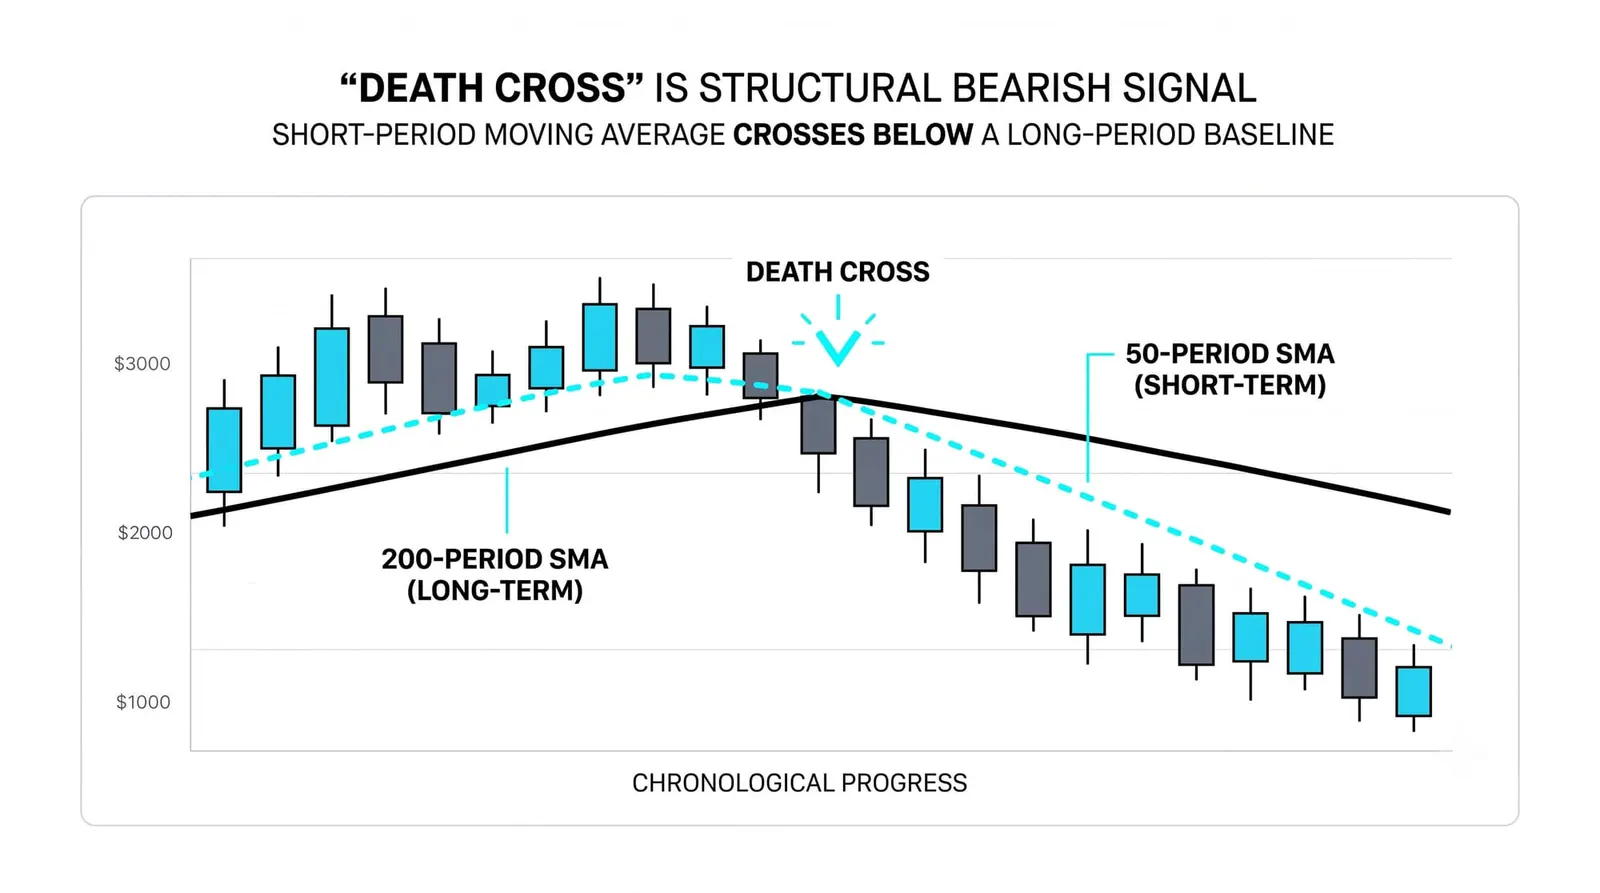
The death cross is the mirror image. It fires when the 50-day average crosses below the 200-day average.
The mechanics are identical, flipped. For the quarterly average to sink under the yearly average, recent months of prices must sit well below the longer history. The market has spent months going down, and the cross certifies it.
The name sounds ominous, and the signal is genuinely bearish as a description of trend. But here is the honest problem: because the cross confirms late, a death cross sometimes arrives near the end of the very decline it appears to predict.
Walk through why. A market falls hard for months. The fast average chases price down and finally crosses under the slow one, often after much of the damage is done. If the selling exhausts itself around that point, the death cross prints close to the low. A trader who shorts on the signal can end up selling near the bottom of a move that was already mature.
This does not make the death cross useless. It makes it a statement about the present regime, not a forecast of the next leg. Treat it as a label for the environment you are in, and it behaves. Treat it as a prophecy, and it will embarrass you at exactly the wrong moment.
Why Crossovers Confirm Late, and How Traders Use Them
The lag is arithmetic, and it cannot be tuned away. A 200-day average gives every one of those 200 days a vote. A strong new trend needs many sessions to outvote the old history baked into that line. The longer the slow average, the more convincing the cross, and the later it arrives. Reliability and speed trade against each other.
Most experienced traders respond by demoting the crossover from entry trigger to confirmation. They let structure, support and resistance, or supply and demand zones suggest the trade first. The crossover then acts as a background check: is the trend regime aligned with this idea or against it?
Traders who want faster signals shrink the pair. A common short-horizon combination is the 9-period and the 21-period. This pair crosses within days of a trend change instead of months, which suits swing traders working on hourly or daily charts.
The cost is whipsaw. A fast pair responds to every wiggle, so it crosses back and forth in sideways markets and hands you a string of small false signals. Each false cross is a small loss or a scratched trade. The 50/200 pair produces few signals and stays quiet through noise; the 9/21 pair produces many and pays for its speed in errors. There is no pair that is both early and reliable.
Pick the pair to match the decision you are actually making. Long-horizon position traders can afford the slow pair because they want regime, not timing. Short-horizon traders accept whipsaw as the fee for responsiveness.
One Cross, Months Behind
Here is a hypothetical stock with invented round numbers, purely to show the timing. Suppose it falls from 80 to 40 over half a year, a 50 percent decline. Then it bottoms and climbs back through 55 over the next two months.
The 50-day average finally crosses above the 200-day average when price trades around 55. The golden cross prints there, roughly five months after the actual low at 40.
What did the cross confirm? That the decline had truly ended and a sustained recovery was underway. The fast average could not have overtaken the slow one without months of genuine buying. As a statement about regime, it was correct.
What did a buyer waiting for the cross give up? They entered at 55 instead of anywhere near 40. That is about 37 percent above the low. The trend follower who demanded confirmation paid a large premium for it.
What did the cross protect them from? Catching the falling knife. On the way down from 80, the stock passed through 55, then 50, and kept falling. A trader buying at 50 because it "looked cheap" sat through another 20 percent drop to 40 with no confirmation of anything. The crossover trader never touched the decline. They missed the bottom, and they also never had to survive it.
| Crossover type | What it signals | Main cost |
|---|---|---|
| Golden cross (50 above 200) | A long uptrend is confirmed and the regime has turned bullish | Arrives months after the low, so entries are far from the bottom |
| Death cross (50 below 200) | A long downtrend is confirmed and the regime has turned bearish | Can print near the end of the fall it appears to predict |
| Fast pair (9 over 21) | Short-term trend shifts within days | Frequent whipsaw and false signals in sideways markets |
| Slow pair (50 over 200) | Major regime changes with few, well-filtered signals | Deep lag; useless for timing precise entries |
Crossovers, Answered
Is a golden cross a buy signal?
It is a confirmation that a long uptrend already exists, and some traders do buy it. A safer use is as a regime filter: once the 50 sits above the 200, favor long setups and let your entries come from price structure rather than the cross itself.
Why do crossovers lag so much?
Because the slow average carries months of old prices, and a new trend needs many sessions to pull the fast average across it. The lag is built into the arithmetic. Longer averages confirm more reliably precisely because they respond more slowly.
Which moving average pair is best for crossovers?
There is no best pair, only a trade-off. The 50/200 pair filters noise and suits long horizons. The 9/21 pair reacts quickly and suits short horizons, at the cost of frequent false crosses. Match the pair to the length of the decisions you make.
What happens after a death cross?
Sometimes the decline continues and the cross looks prescient. Sometimes the selling was nearly done and price bottoms shortly after, making the cross look foolish. Both outcomes are common enough that the cross should be read as a description of the current regime, never as a forecast.
Crossovers are one way to use two averages together. Next, a single average treated as a level in motion: moving averages as dynamic support and resistance.