Exponential Moving Average: EMA
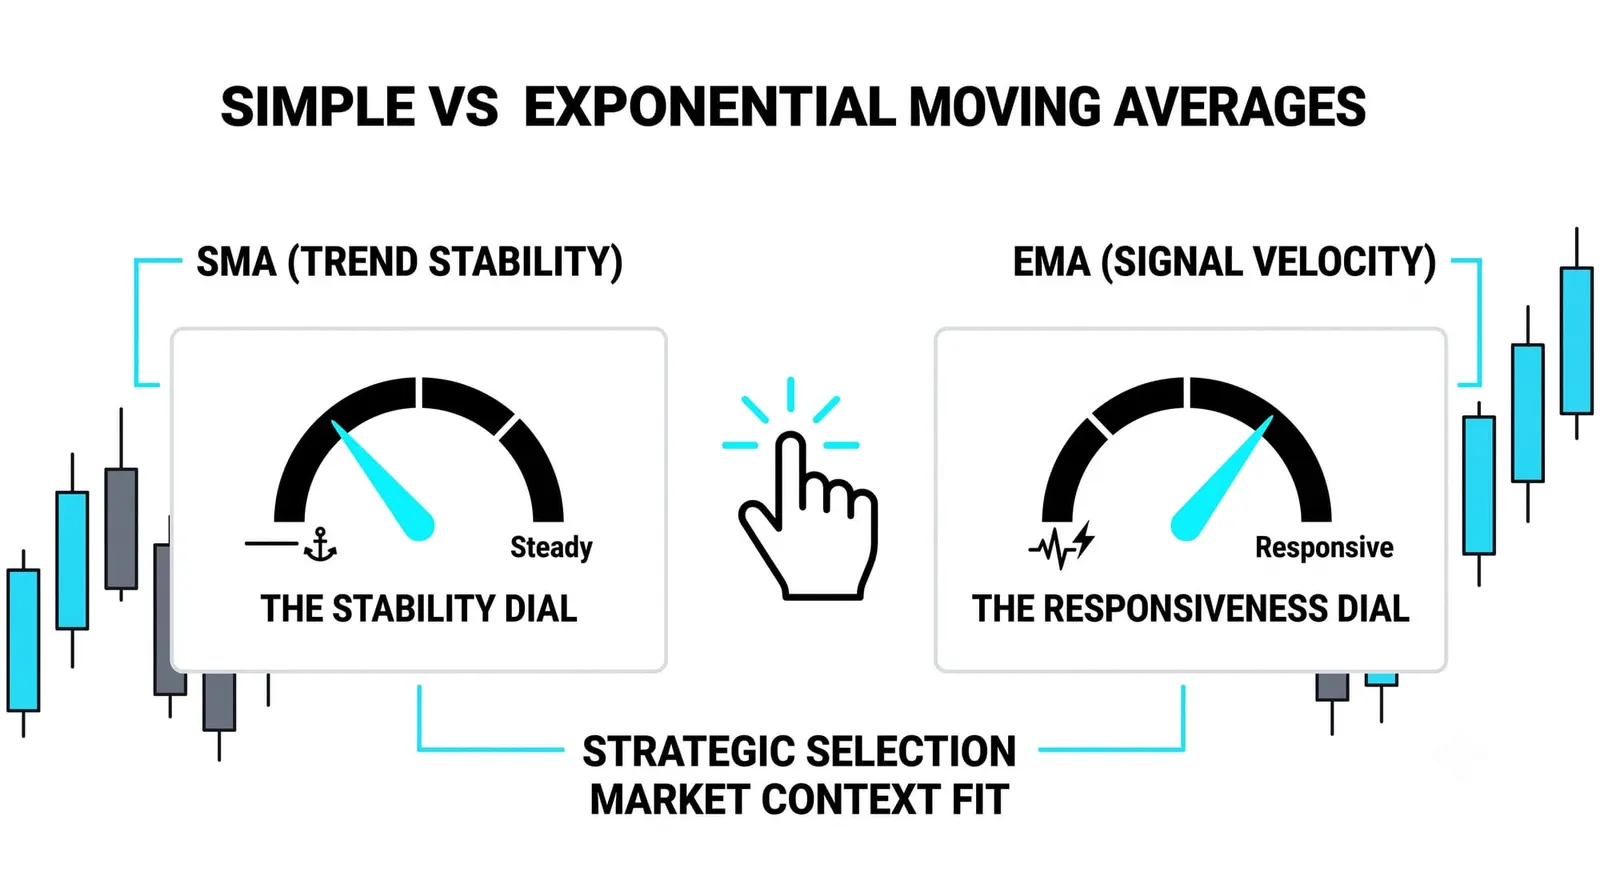
The exponential moving average is a moving average that weights recent prices more heavily than old ones, so it turns faster than the simple average. That speed comes at a price: you give up some smoothness to gain responsiveness. Every moving average is a compromise between reacting quickly and staying calm, and the EMA simply picks a different point on that dial than the SMA does.

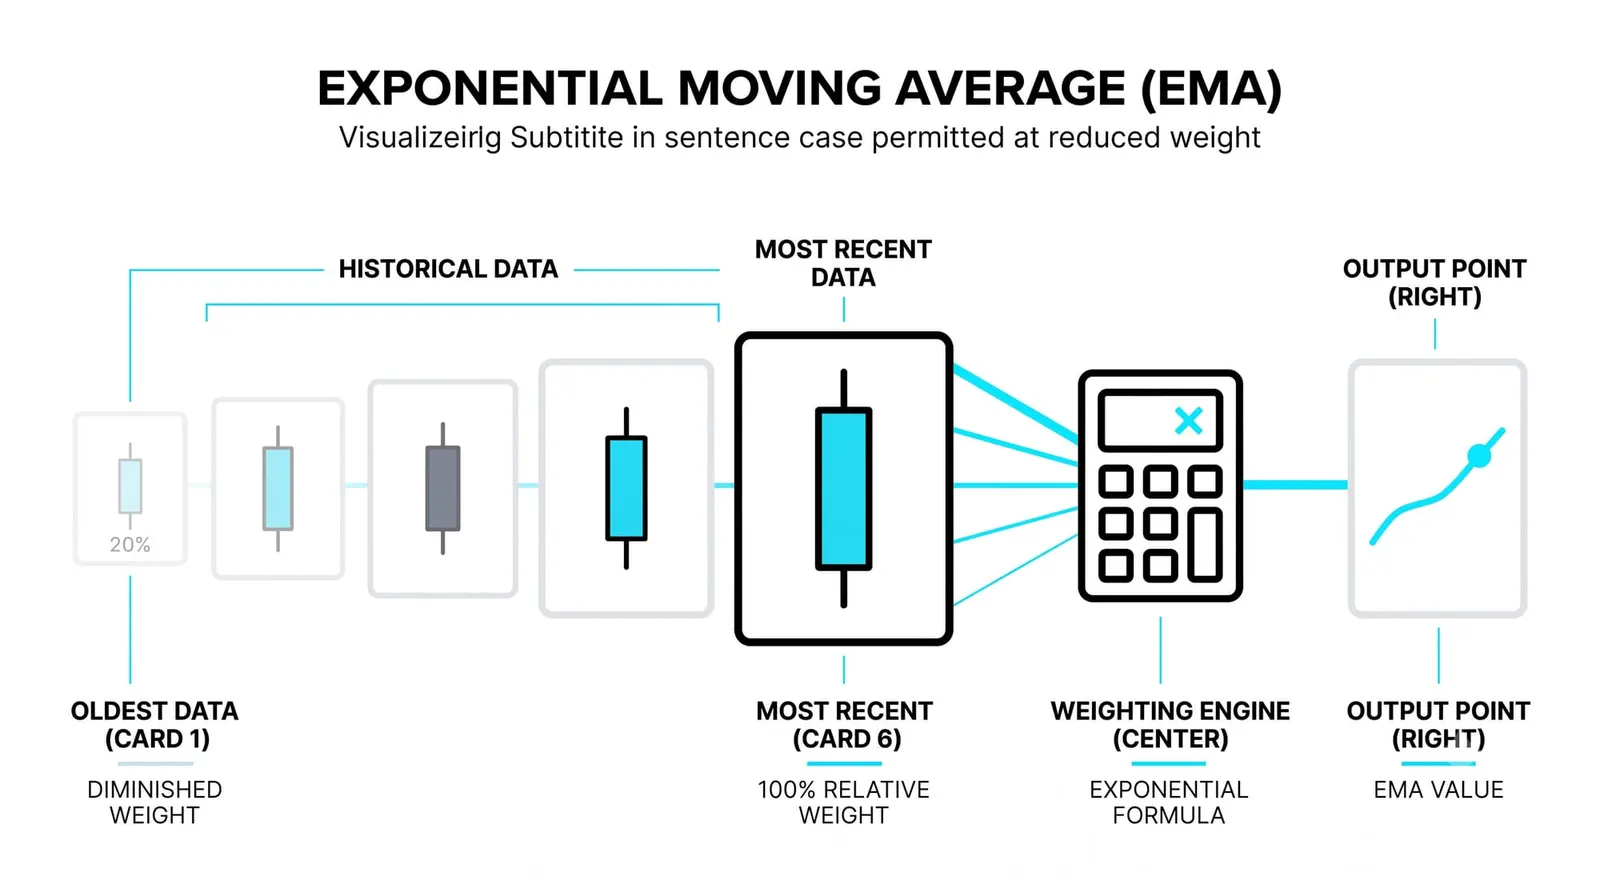
Think of the EMA as having a short memory bias. What happened yesterday outweighs what happened last month, so the line reacts while the SMA is still nodding along. If you worked through the simple moving average lesson, you already know the core idea: average some closes, plot the result, watch the line. The EMA is the same idea with weighted memory. The oldest data does not vanish on schedule; it just fades, a little more each day, until it barely matters.
How the EMA Is Calculated
The math has two pieces. First comes the multiplier, which is roughly 2 divided by the period plus one. For a 20-period EMA, that is 2 divided by 21, about 0.0952. For a 10-period EMA, it is 2 divided by 11, about 0.1818. The shorter the period, the bigger the multiplier, and the more each new close shoves the line around.
Second comes the blending step. Each new close gets mixed with yesterday's EMA value using that multiplier. The formula is: today's EMA equals today's close times the multiplier, plus yesterday's EMA times one minus the multiplier. The line is a running blend of the newest price and everything the EMA already remembers.
Notice what that structure implies. Old prices never actually drop out of an EMA. In an SMA, the close from 21 bars ago simply falls off the back of the window. In an EMA, that old close keeps a tiny, shrinking echo inside the line forever. Its weight decays toward zero but never quite reaches it. Practically, after enough bars the old data is noise. Mathematically, it is still there.
One more mechanical detail: an EMA needs a starting value. Most charting platforms seed it with a simple average of the first N closes, then let the blending take over. Early values are slightly rough; after a few dozen bars the seed stops mattering.
What the Weighting Changes
Weighting recent prices more heavily buys you one thing: the EMA turns sooner at turning points. When price bends, the EMA bends with it, while the SMA lags a few bars behind. At genuine reversals, those saved bars are real information delivered earlier.
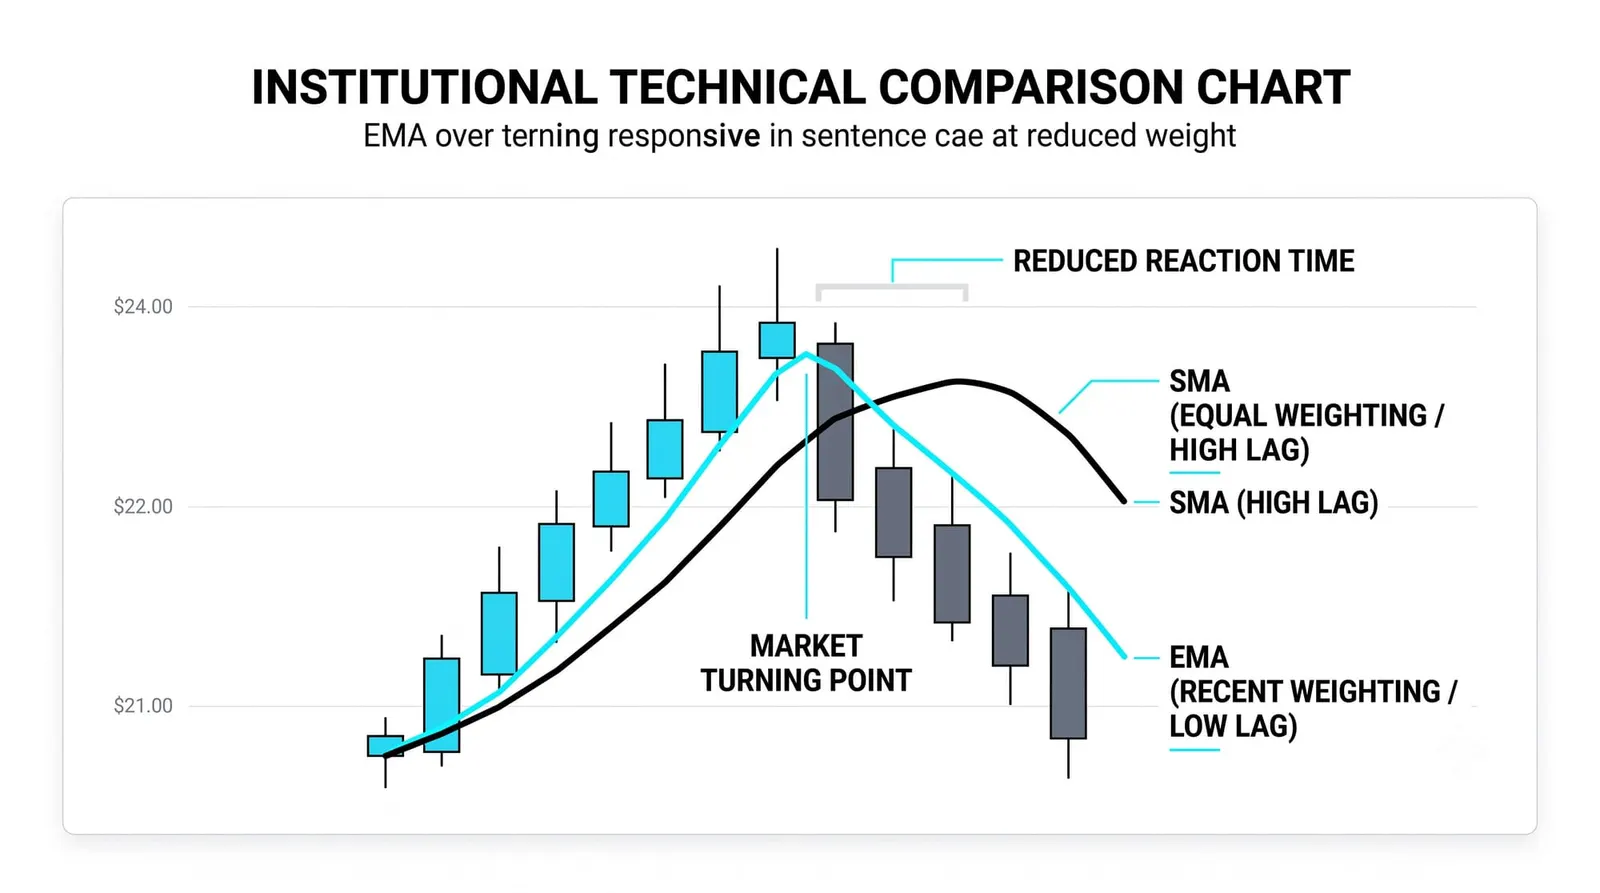
The same weighting costs you something at every other moment. A line that reacts fast reacts to everything, including random one-bar noise. Earlier signals arrive packaged with more false signals. You will get crossed above and crossed below more often, and a chunk of those crosses will mean nothing. Speed and stability trade directly against each other, and no setting escapes that trade.
This is why different trader types split on the choice. Day traders, who live on short holds and quick decisions, tend to lean on EMAs because a two-bar delay can be the whole move. Position traders, holding for weeks or months, often stay with SMAs because they want the line to ignore noise and they can afford the lag. Neither group is wrong. They are buying different things.
How Traders Use It
Certain periods show up on charts constantly. The 9 and 12 EMAs are short-term staples, the 12 especially because it feeds the MACD. The 20 and 21 sit in the middle, popular for swing trading. The 50 tracks the medium trend. Longer EMAs like the 100 and 200 exist too, though many traders prefer the SMA at that length because the weighting matters less over long windows.
The most common use is a trend filter on shorter timeframes. Price above a rising 20 EMA means favor long setups; below a falling one, favor shorts or stand aside. It is a blunt instrument, but blunt is fine when the job is just keeping you on one side of the market.
Many traders also watch EMA crossovers, a fast EMA crossing a slow one, as entry signals. The habit works in trends and bleeds in chop. Every crossover system pays a lag cost: by the time two lagging lines agree, the move has already run. Accept that cost going in, because it never goes away.
A third use is the ribbon: several EMAs of increasing length plotted together. When they fan out in clean order, shortest on top in an uptrend, the trend is strong and aligned. When they tangle and braid together, the market has no direction and the ribbon is telling you so. The ribbon turns trend strength into something you can see at a glance.
The Weaknesses: Whipsaw in Ranges
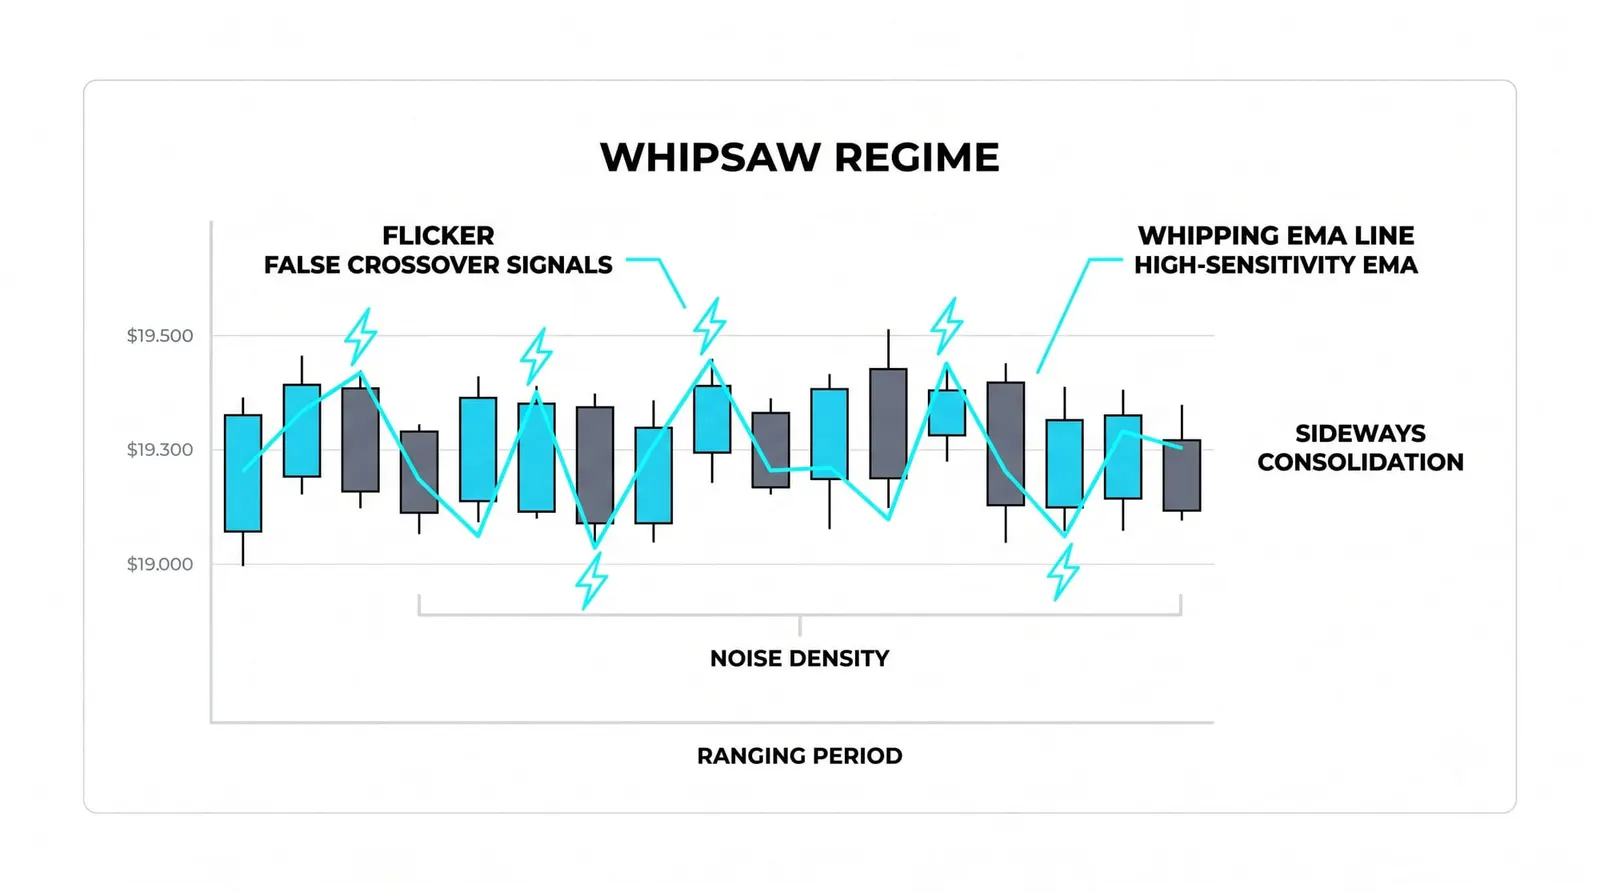
Responsiveness cuts both ways. The trait that makes the EMA useful in a trend makes it harmful in a range. Sideways markets produce constant small pushes up and down, and the EMA dutifully reacts to each one.
The result is whipsaw. Price drifts above the EMA, the line curls up, you go long. Price drifts back through, the line curls down, you exit at a small loss. Repeat that cycle ten times in a flat month and the small losses stack into a real one. The EMA crossed and recrossed the whole time, and every cross was a lie.
An SMA suffers the same problem, just slightly less often, because it reacts slower. Neither average is built for ranges. They are trend tools, and a range is the absence of trend.
So the regime decides everything. Before you ask whether the EMA is giving good signals, ask whether the market is trending or ranging. Structure from earlier levels answers that: higher highs and higher lows, or a flat box. In a trend, the EMA helps. In a range, it hurts. The indicator does not change; the environment does.
One Spike, Two Lines
Here is a hypothetical with round numbers. Imagine twenty daily closes drifting quietly between 99 and 101, averaging about 100. Then one day the close prints 110, a clear spike. The next day price falls back and closes at 100 again.
Watch the SMA20. Before the spike it sits near 100. The 110 close enters the window as one of twenty equal values, adding 10 points of excess spread across twenty slots, so the average rises about half a point to roughly 100.5. The line barely notices. It will carry that small bump for twenty days until the spike falls out of the window, then dip back.
Now the EMA20, multiplier about 0.0952. When the 110 prints, the EMA moves from roughly 100 to roughly 100.95 in one step, about twice the SMA's reaction. The spike is visible in the line immediately. Then, when the next close returns to 100, the EMA falls back faster too, shedding the spike's influence with each new bar instead of carrying it for a fixed twenty days.
What did each line tell you during the event? The SMA said: nothing much happened, this is one data point among twenty. The EMA said: something just happened, pay attention. If the spike was the start of a real move, the EMA got you in earlier. If the spike was noise, as it was here, the EMA flagged a false alarm and the SMA's stubbornness saved you a trade.
That is the choice in one picture. The EMA buys you speed and sells you false alarms. The SMA buys you calm and sells you delay. Pick based on which failure mode your trading can absorb.
Four EMAs at a Glance
| EMA | What It Tracks | How Traders Typically Use It |
|---|---|---|
| EMA9 | Very short-term momentum, the last couple of weeks of trading | Pullback entries in strong trends; price holding above it signals momentum is intact |
| EMA20 | The short-to-medium trend, roughly one trading month | Trend filter on intraday and daily charts; dynamic support in uptrends |
| EMA50 | The medium-term trend, about one quarter of trading | Swing-trading bias; crosses with the EMA20 used as trend-change signals |
| EMA200 | The long-term trend, roughly a trading year | Bull-versus-bear dividing line; long-term bias filter on daily charts |
The EMA, Answered
What is the difference between EMA and SMA?
The SMA weights every close in its window equally; the EMA weights recent closes more heavily and lets old ones fade gradually. That makes the EMA turn faster at reversals and react more to single-bar noise. Both are lagging averages of the same price data. They differ only in how the past is remembered.
Which EMA period is best for day trading?
There is no single best period; the 9 and 20 are the most common choices on intraday charts. Shorter periods react faster and whipsaw more; longer ones smooth more and lag more. Pick one, learn its behavior on your market and timeframe, and test it against your own historical charts before trusting it with money.
Why do traders stack multiple EMAs?
Stacking several EMAs of increasing length, a ribbon, turns trend strength into something visible. When the lines fan out in clean order, the trend is aligned across timeframes. When they tangle and overlap, the market is directionless. One line tells you where the average is; a stack of lines tells you whether the trend agrees with itself.
Does the EMA work in ranging markets?
No, not as a signal tool. In a sideways market the EMA crosses price repeatedly and each cross is a false signal, producing whipsaw losses. Its responsiveness, its main selling point, works against it in chop. Identify the regime first using market structure, and save the EMA for trending conditions.
Next up is the weighted moving average, a different weighting scheme with its own logic: instead of an exponential fade, it assigns fixed, straight-line weights to each bar. Same family, different memory, and worth understanding so you know exactly what each line on your chart is doing with your data.