Weighted Moving Average: WMA
The weighted moving average assigns each close in the window a weight based on its position: the newest close counts most, the oldest counts least. It sits between the SMA's flat averaging and the EMA's exponential memory, which makes it the middle option in the moving average family.

Think of the WMA as the closes lined up newest-first, each given a voice proportional to its position. The newest voice is loudest and the oldest is nearly silent. That single design choice shapes everything about how the line behaves.
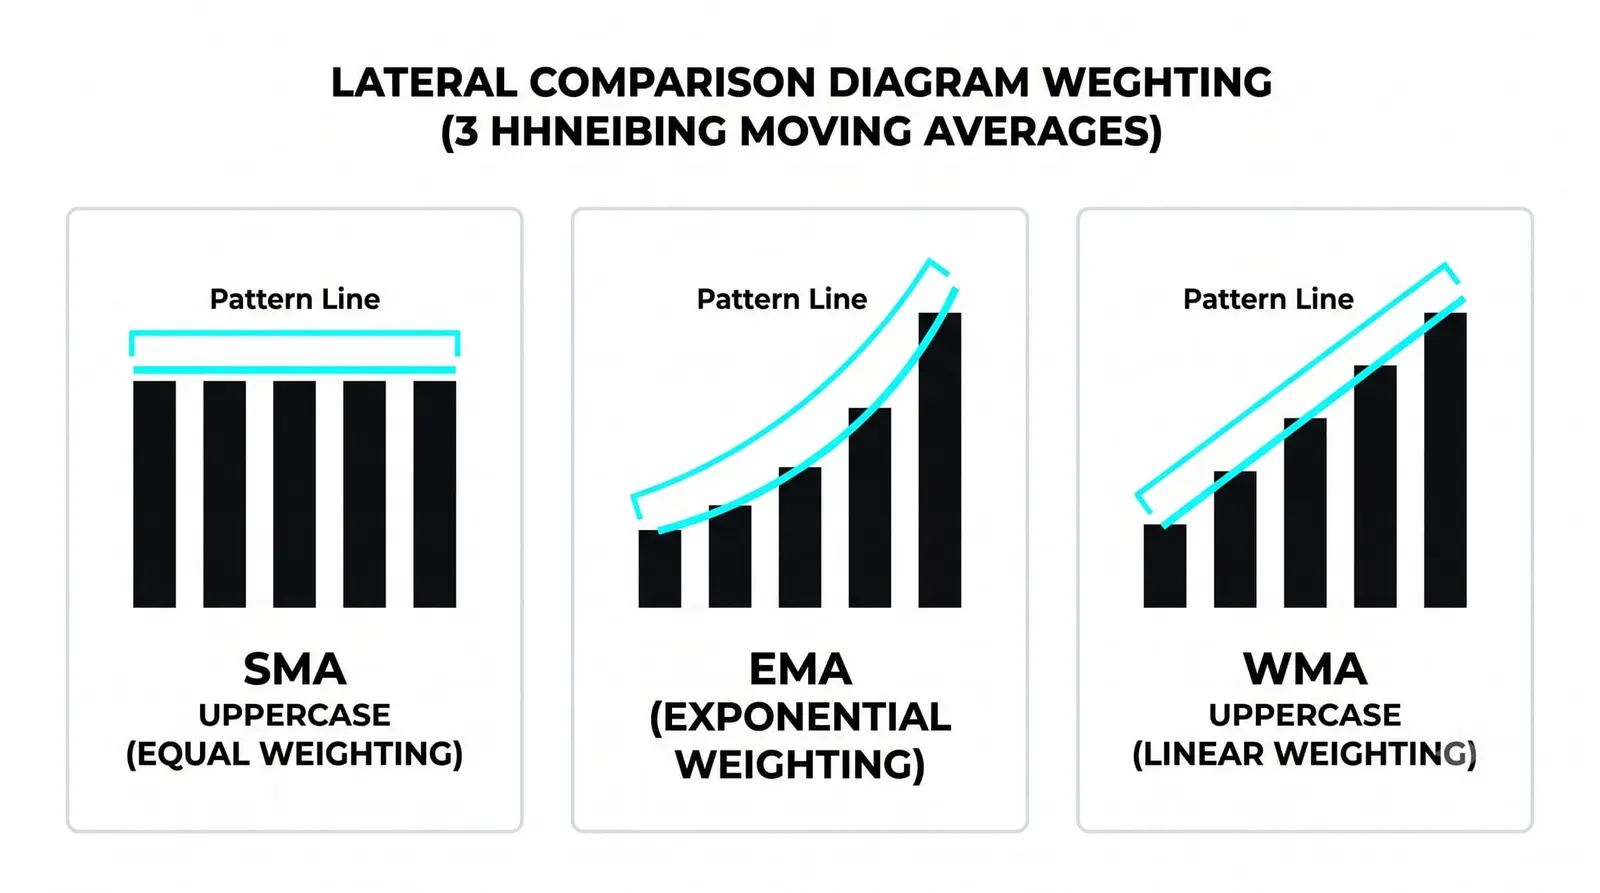
You have already met the simple moving average and the exponential moving average in the previous lessons. The WMA completes the family's middle ground, and it is worth understanding even if you never plot one, because it shows what "weighting" really means.
How the WMA Is Calculated
The weighting scheme is linear. In a 10-period WMA, the newest close is multiplied by 10, the next by 9, and so on down to the oldest close, which is multiplied by 1. Then you divide the total by the sum of the weights, which for ten periods is 55.
Take a micro-example with three closes: 10, 12, and 14, oldest to newest. The newest close (14) gets weight 3, the middle close (12) gets weight 2, the oldest (10) gets weight 1. Multiply and add: 14 times 3 is 42, 12 times 2 is 24, 10 times 1 is 10. Total is 76. Divide by the sum of the weights, 6, and the WMA is roughly 12.67.
Compare that with the simple average of the same three closes, which is 12. The WMA pulled the answer upward because the newest, highest close spoke the loudest.
The EMA approaches the same problem differently. Instead of assigning fixed weights to fixed positions, it blends a fraction of the newest price into the previous EMA value, and that blend compounds. Old data never fully leaves an EMA; it fades by a constant percentage each bar. A WMA, by contrast, has a hard edge: once a close falls out of the window, it is gone completely.
So the WMA is a weighted average in the literal, arithmetic sense. The EMA is a recursive formula that behaves like a weighted average. Both privilege recent data, but the machinery underneath differs.
WMA vs SMA vs EMA: The Same Data, Three Tempers
All three lines read the same closes. Only the weights change.
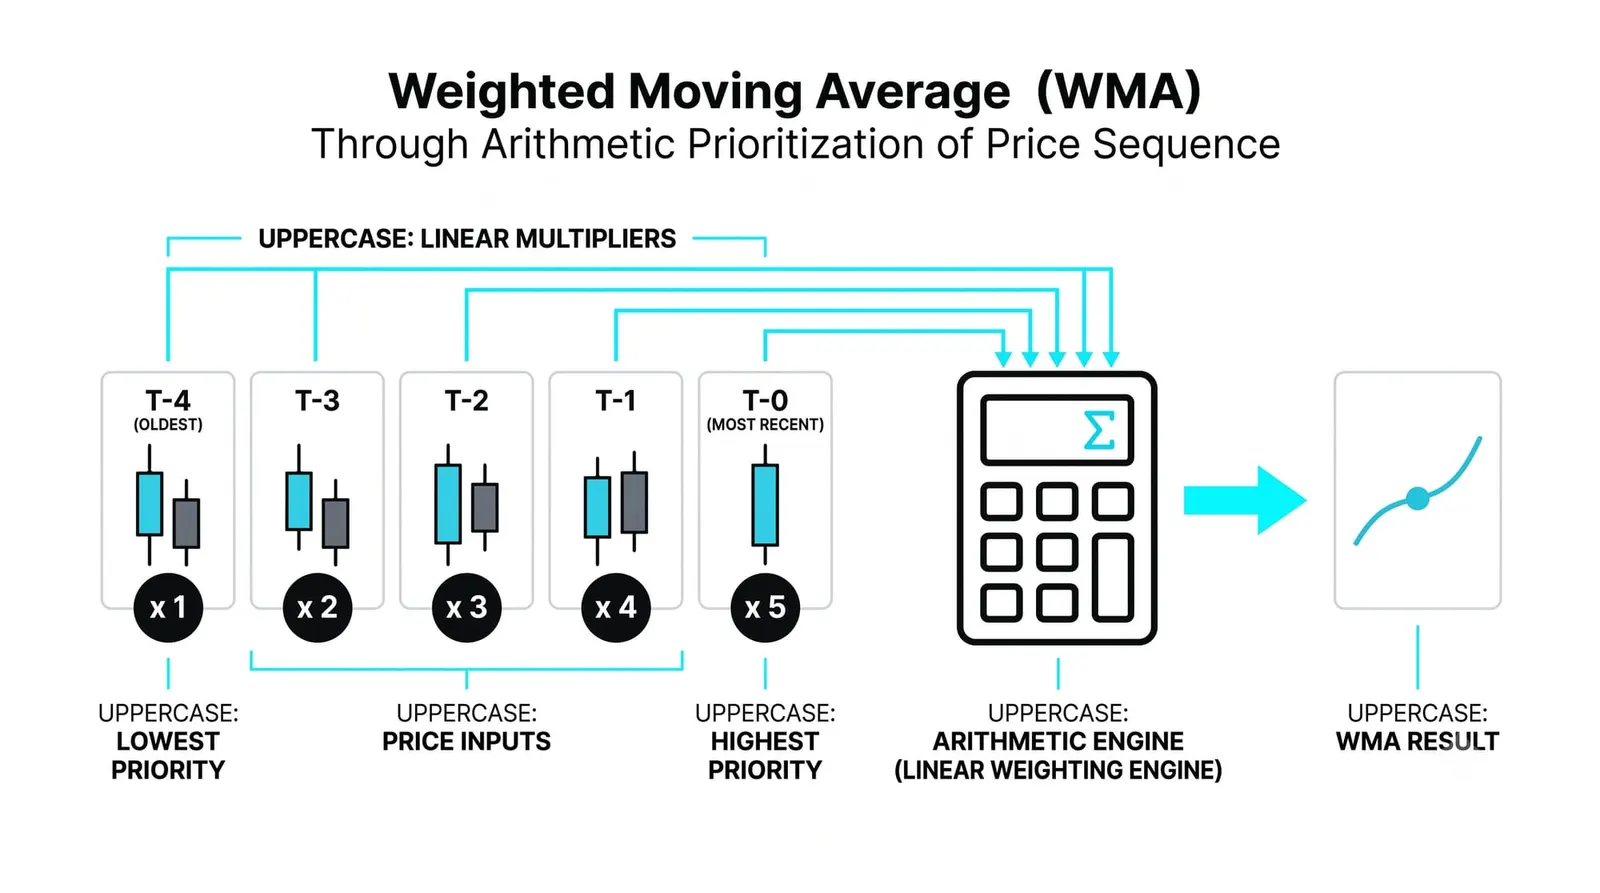
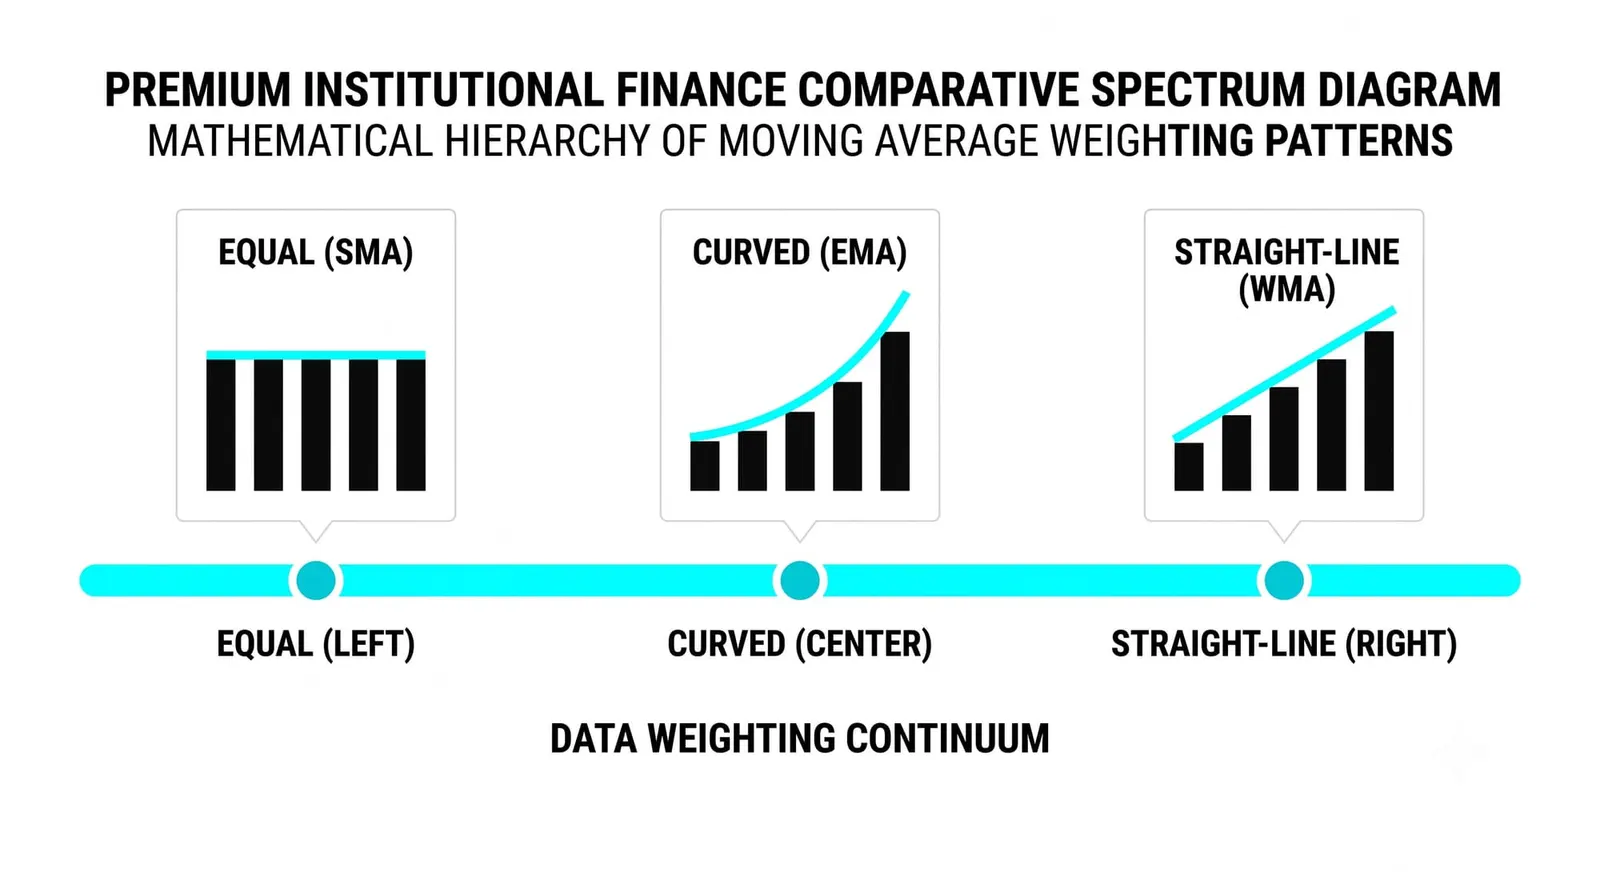
- SMA: flat weights. Every close in the window counts equally, 1 each.
- WMA: linear weights. Importance steps down by a fixed amount from newest to oldest.
- EMA: exponential weights. Importance decays by a fixed percentage, and the tail never fully reaches zero.
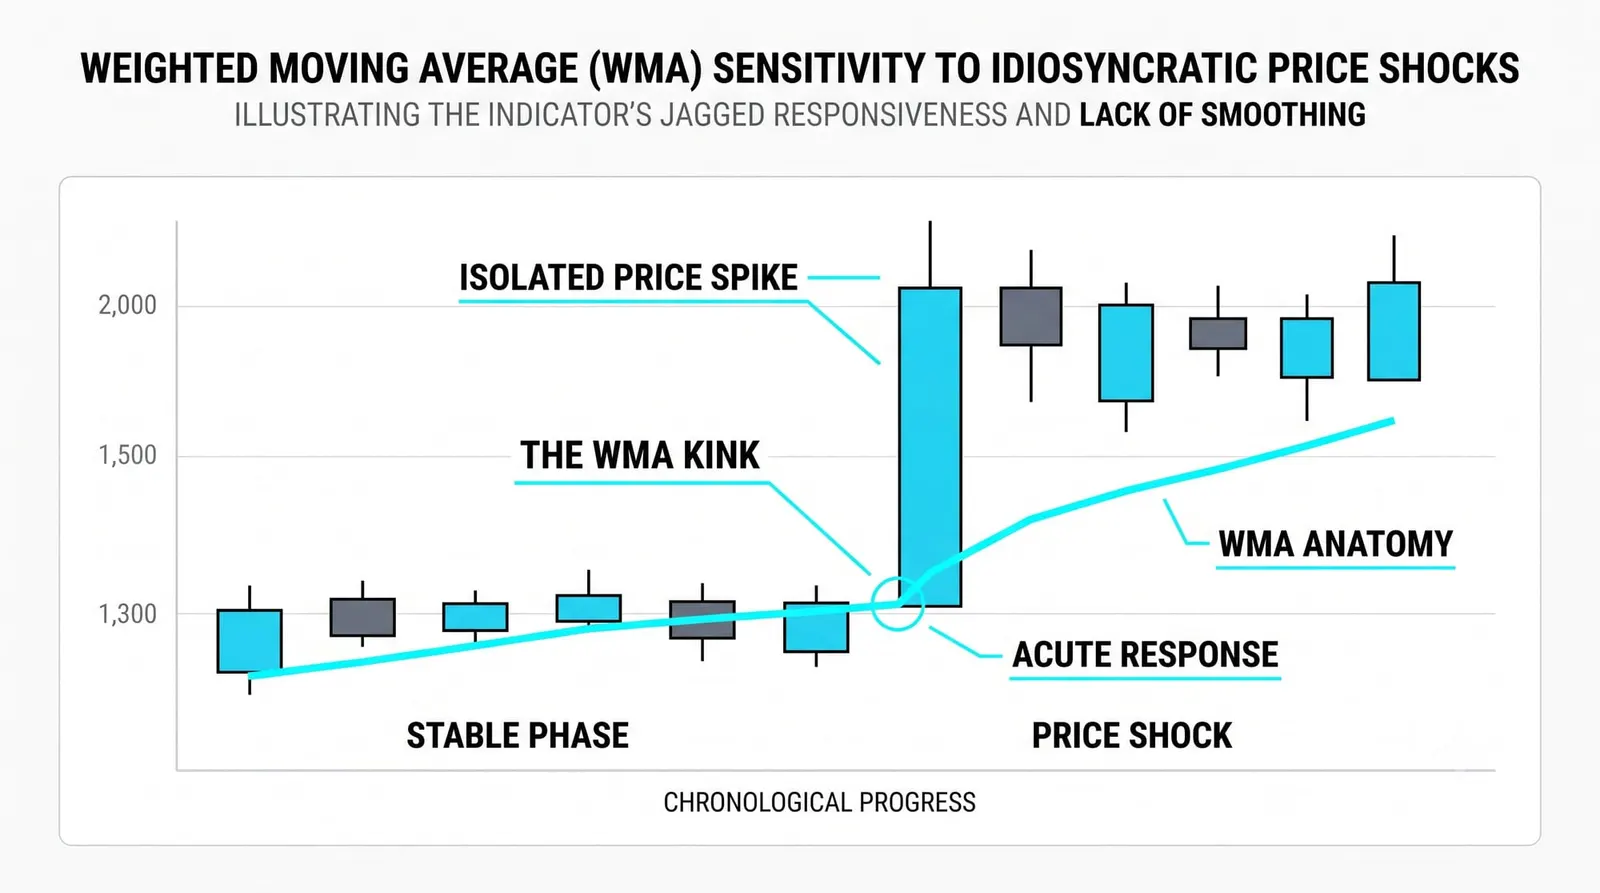
Ranked by responsiveness to new price action, the EMA reacts fastest, the WMA sits in the middle, and the SMA is slowest. Ranked by smoothness, the order flips: the SMA is the calmest line, the WMA is intermediate, and the EMA kinks the most when price jumps.
There is a subtlety here. On short windows, the WMA and EMA often track each other closely, because both lean hard on the newest few bars. On longer windows, their differences show: the EMA keeps a faint memory of data from far outside any fixed window, while the WMA forgets cleanly.
Neither temperament is a virtue on its own. Fast lines hug price and signal early, but they whipsaw more. Slow lines filter noise and signal late. The weighting scheme is simply the dial that sets where on that trade-off the line sits.
Where the WMA Fits
The WMA suits a trader who wants more response than the SMA gives, without the EMA's long, compounding memory. When a close drops out of a WMA window, its influence ends that bar. Some traders find that clean cutoff easier to reason about than a decaying tail.
Shorter windows are where the linear weighting earns its keep. On a 5- or 10-period WMA, the newest two or three closes dominate the calculation, so the line tracks short swings closely while still smoothing single-bar noise. Swing traders watching brief momentum bursts sometimes prefer that profile.
Still, the WMA is the least common of the three on most charts and in most platforms' default settings. That says something about defaults. The SMA became the convention because it is the easiest to explain and compute by hand. The EMA became the standard "faster" option because it was built into early charting software and indicator formulas like the MACD. The WMA arrived as a third option without a strong institutional sponsor, and it never displaced either.
Low popularity is not a verdict on quality. It means fewer eyes anchor on the same WMA levels, which matters if you use moving averages as reference points that other traders also watch.
The Weaknesses: Weighting Is Still a Guess
No weighting scheme removes lag. Every moving average is built from closes that already happened, so every version reacts after the fact. Weighting changes how much lag, never whether lag exists.
The weights answer one question: which past closes deserve the most attention. They say nothing about what comes next. A WMA that turned upward is describing history with a recency bias, and the market owes that bias nothing.
The other trap is overfitting the period. It is easy to scroll through old charts, test a 7-period WMA, then a 9, then a 13, and find one that "called" every turn beautifully. That line was tuned to the past. On live data it has no special claim, and the tuning exercise often manufactures confidence that the next hundred bars will not repay.
Pick a period for a reason tied to your timeframe and holding style, then leave it alone long enough to gather honest evidence.
Three Closes, Three Lines
Here is a hypothetical illustration with invented round numbers. Suppose three consecutive closes: 10, 10, and 16. Price sat flat, then jumped.
The SMA of 3: (10 + 10 + 16) / 3 = 12. The flat average treats the jump as one event among three equals. The line moves to 12, well below the current price of 16. Its message: something happened, but one bar is only a third of the evidence.
The WMA of 3: weight the newest close (16) by 3, the middle (10) by 2, the oldest (10) by 1. That gives 48 + 20 + 10 = 78... wait, check the arithmetic: 16 times 3 is 48, 10 times 2 is 20, 10 times 1 is 10, total 78, divided by 6 gives 13. (If the two older closes were 10 and 12 instead, the total would be 84 over 6, landing at 14.) With our 10, 10, 16 inputs, the WMA prints 13, one point above the SMA. The line leaned toward the jump because the jump was the loudest voice.
The EMA of 3: with a smoothing constant of 0.5, it blends half of the new close with half of its prior value. Starting from a prior EMA near 10, it lands around 13 as well, and on the next bars it will keep chasing price faster than the SMA while still carrying a fading trace of those old 10s.
Now the interpretation question: is that 16 a new trend or noise? The SMA says "wait, one bar proves little." The WMA says "the newest bar deserves the most belief, so lean, but stay measured." The EMA says "lean, and keep leaning harder if the next bars confirm." The WMA's answer sits exactly in the middle of the family argument: more conviction than the flat average, less commitment than the compounding one. None of the three knows the answer. They just encode three different levels of trust in fresh data.
| Line | Weighting scheme | Temperament it produces |
|---|---|---|
| SMA | Flat: every close weighted equally | Slowest, smoothest, most skeptical of new bars |
| WMA | Linear: weights step down by position, newest largest | Middle: responsive to fresh data, clean cutoff of old data |
| EMA | Exponential: constant-percentage decay, no hard cutoff | Fastest reaction, longest fading memory |
| All three together | Same closes, three weightings | Agreement across the three reads as a sturdier signal than any one line alone |
The WMA, Answered
Is the WMA better than the EMA?
No, and it is not worse either. They weight recent data by different formulas, and the practical difference on most windows is small. Choose based on whether you prefer the WMA's clean cutoff of old data or the EMA's fading memory, then test your choice honestly.
Why is the WMA less popular?
Habit and history, mostly. The SMA is the simplest to explain, and the EMA was embedded early in standard tools like the MACD, so both became defaults before the WMA had a constituency. Popularity among indicators tends to be self-reinforcing.
What does linear weighting actually mean?
It means the weights shrink by the same fixed amount each step: 10, 9, 8, down to 1 in a ten-period window. Each older close matters less than the one after it by an equal margin, rather than by an equal percentage as in the EMA.
Can you use a WMA for support and resistance?
You can, the same way traders use any moving average as a dynamic level, and the next lessons cover exactly that idea along with crossovers. Keep in mind that a WMA level works partly because traders watch it, and fewer traders watch WMAs than SMAs or EMAs, so its "audience effect" is thinner.
With the full moving average family in hand, the natural next step is putting the lines to work: crossovers between a fast and slow average, and moving averages acting as dynamic support and resistance. That is where the next lessons go.