MACD Indicator: Full Breakdown
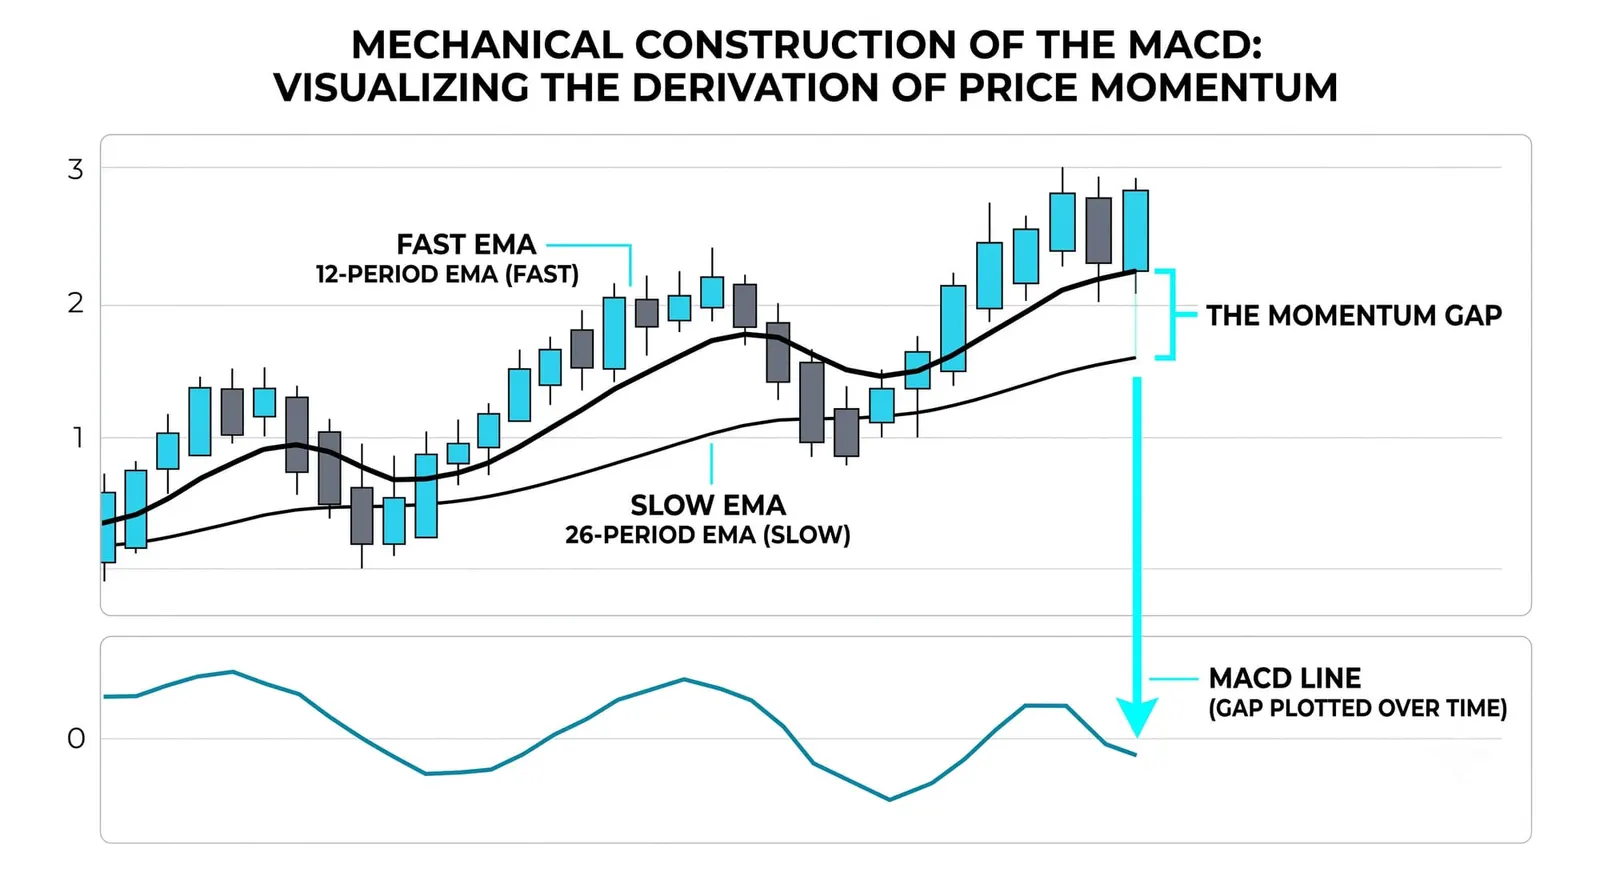
MACD, the Moving Average Convergence Divergence indicator, is built from two EMAs. It plots the gap between a fast 12-period EMA and a slow 26-period EMA, then adds a 9-period EMA of that gap as a signal line. Two trend lines become one momentum read.

Think of two swimmers in a tide, one faster off the stroke. The distance between them tells you about the current, and that distance is what MACD plots.
You already know every input here. The EMA lesson is the direct prerequisite: MACD is two of those lines doing arithmetic. Nothing else feeds it. If you can read an EMA, you can read this.
The histogram that ships with most MACD displays gets its own lesson next. One mention for now: it is the gap between the two MACD lines, drawn as bars, and it deserves a full breakdown of its own.
What MACD Is Actually Built From
The MACD line is subtraction. Take the 12-period EMA, subtract the 26-period EMA. That single number is the MACD line. When the fast EMA sits above the slow EMA, the number is positive. When it sits below, the number is negative.
The signal line is a 9-period EMA of the MACD line itself. It smooths the smoothed. It trails the MACD line by design, because it is an average of that line's recent values.
The histogram is the gap between the MACD line and the signal line, plotted as bars around zero. Positive bars mean the MACD line is above its signal line. Negative bars mean the reverse. That is all it is, and it gets its own lesson after this one.
Every input comes from EMAs you already know. There is no price data in MACD that has not already passed through an exponential moving average. The indicator is a second-order construction: averages of averages, differences of averages.
Reading the MACD Line and the Signal Line
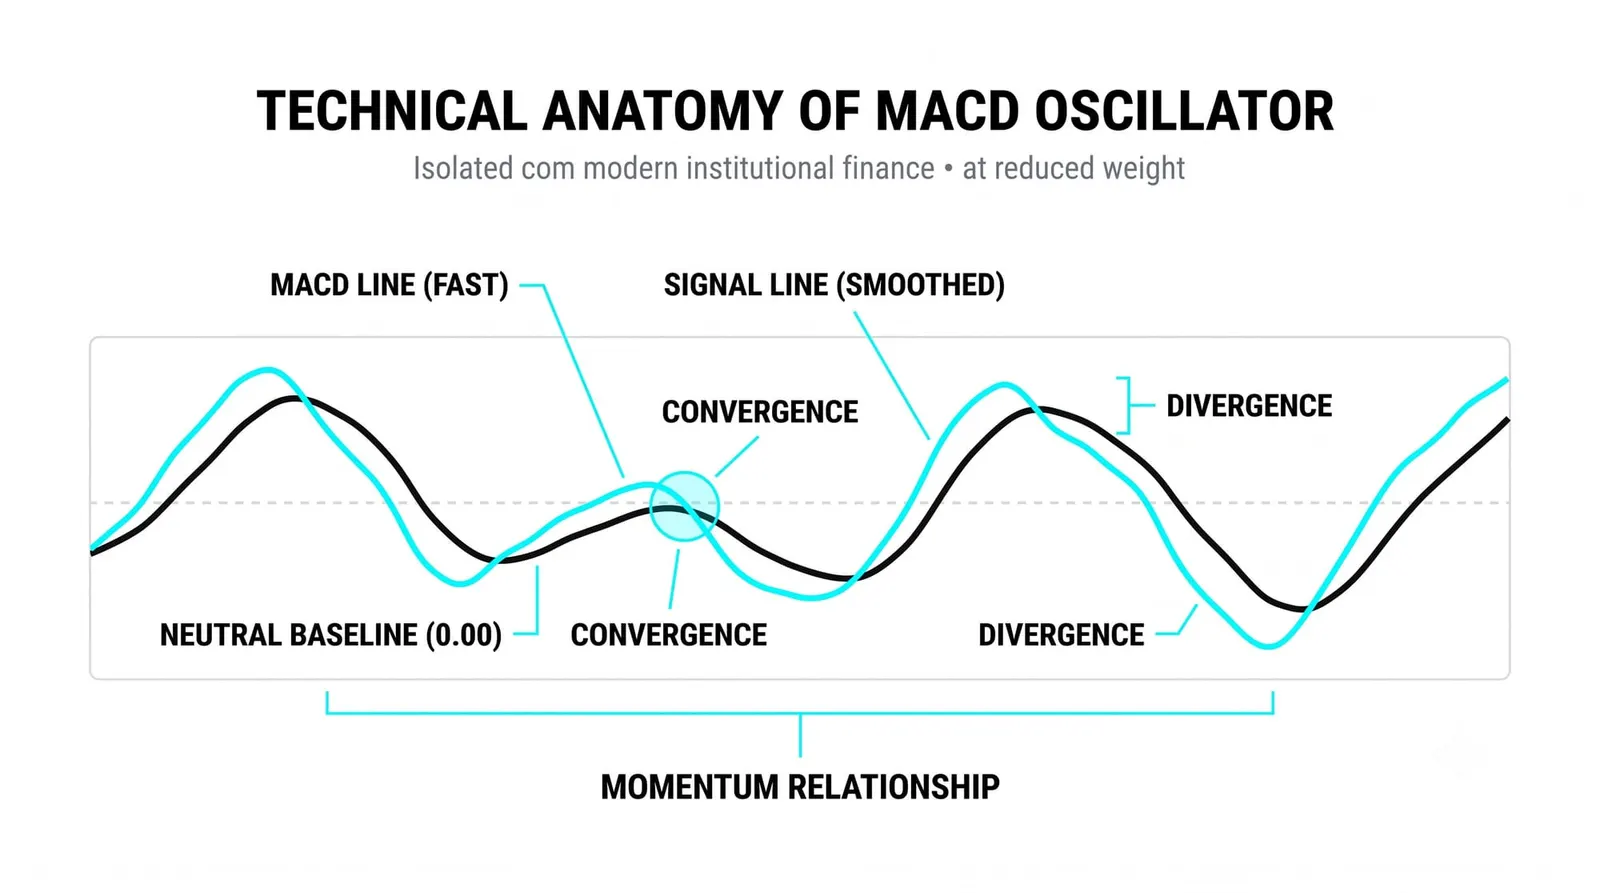
Above zero means the fast EMA is above the slow EMA. That is the trend regime read. A positive MACD line says the recent average price outruns the longer average price, which is what an uptrend looks like in EMA terms. Below zero flips the statement.
Crossovers of the two lines mark momentum shifts. When the MACD line crosses above its signal line, momentum is accelerating relative to its own recent norm. When it crosses below, momentum is fading relative to that norm. The cross does not say trend reversed. It says the fast line's lead over the slow line is growing or shrinking faster than usual.
Divergences sit one level deeper. Price makes a new high, but the MACD line does not. The fast EMA is still above the slow one, yet the gap between them is smaller than it was at the prior price high. The trend is still up. The push behind it is weaker. That mismatch is the divergence, and it warns rather than predicts.
What MACD Is Telling You About Momentum
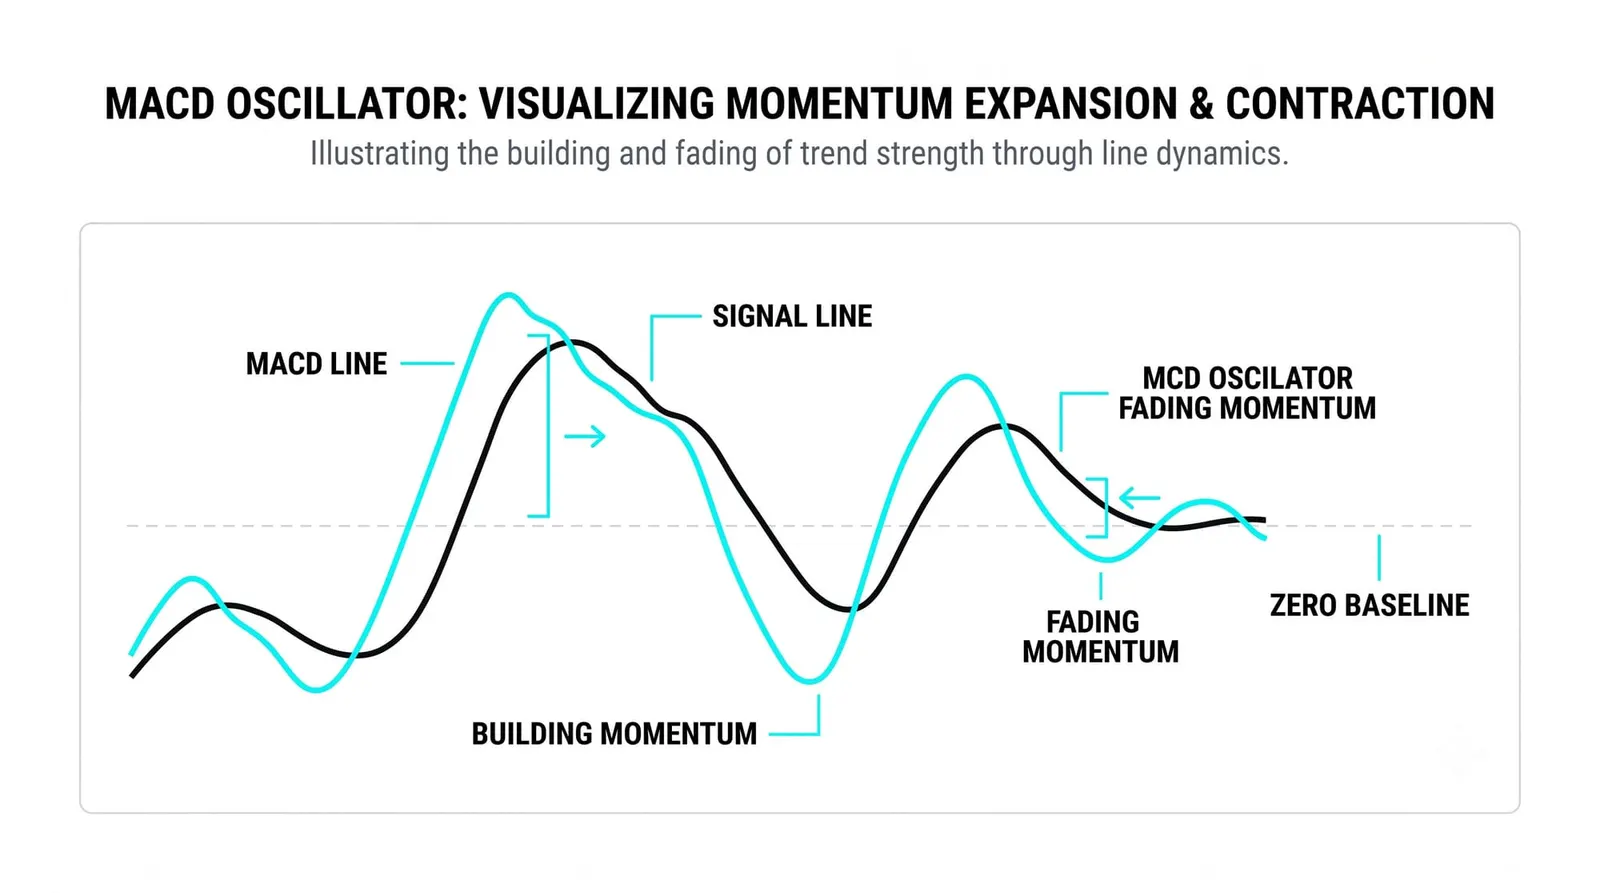
Direction and strength come as a pair. A rising MACD line in positive territory is the strong case: the fast EMA is above the slow EMA, and the lead is growing. Trend up, momentum up. A falling MACD line in negative territory is the mirror image.
The zero line is the regime border. Above it, the fast EMA leads. Below it, the slow EMA leads. A MACD line crossing zero is the same event as the 12 EMA crossing the 26 EMA on your chart. The indicator just isolates that crossing and makes it visible as one number.
Weakness shows up as shrinkage. A MACD line still positive but falling toward zero says the uptrend persists while its fuel burns down. The trend read and the momentum read disagree, and the disagreement is information.
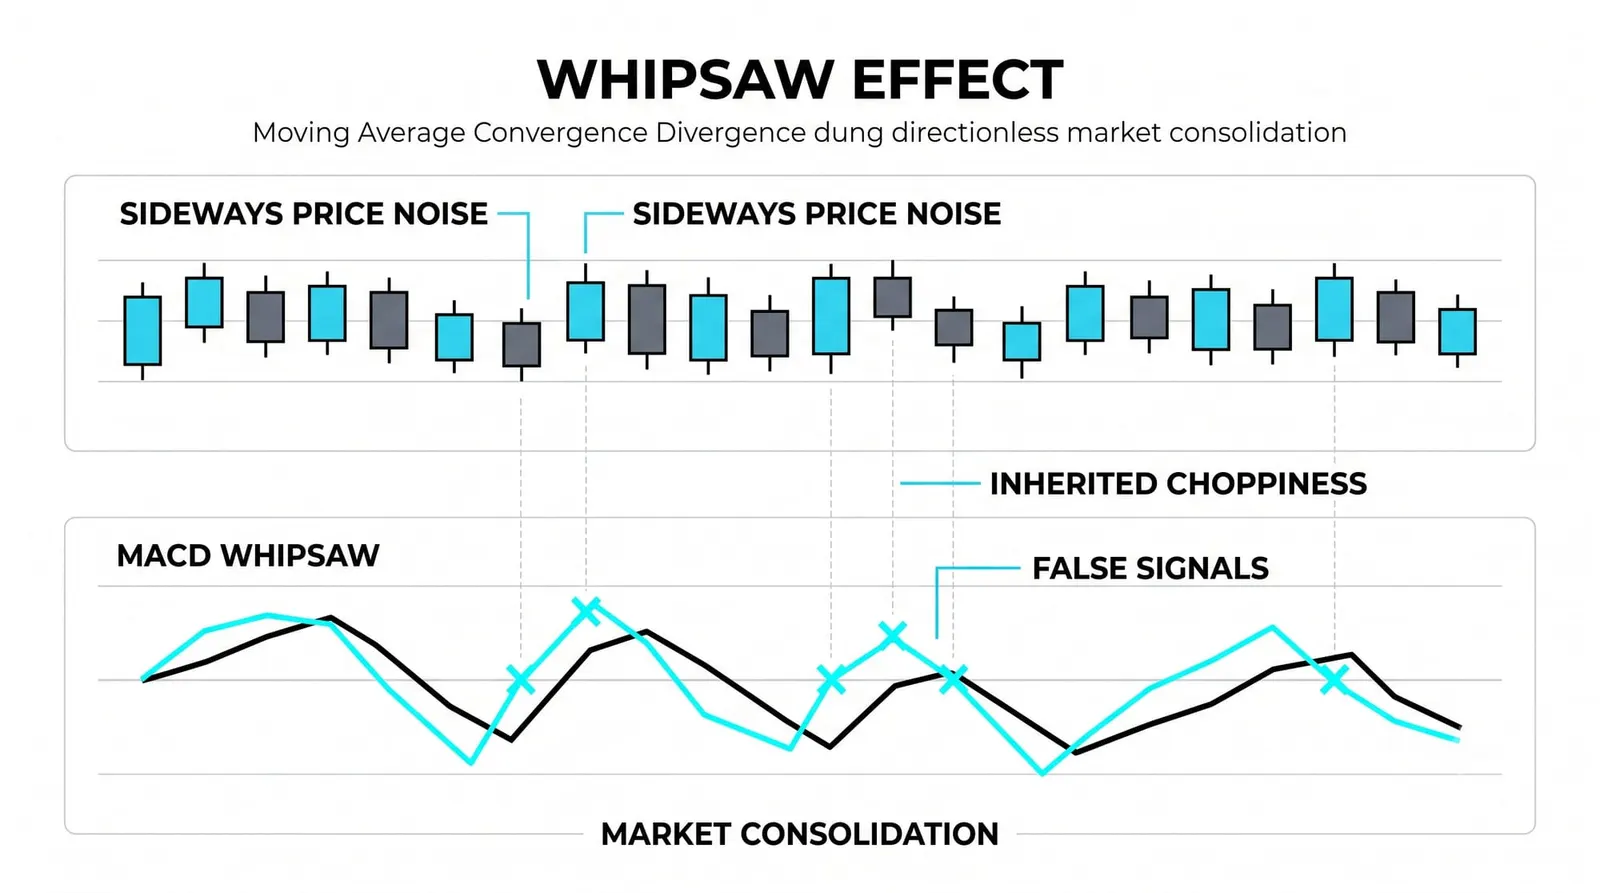
Expect whipsaws in ranges. MACD whipsaws in sideways markets for the same reason the EMAs it is built from do. In a range, the fast and slow EMAs braid around each other, so their difference flaps around zero. The indicator inherits the flaw of its inputs. No setting fixes that.
What MACD Is Good At, and Where It Falls Short
MACD does two jobs well. It confirms trend through its position relative to zero, and it flags momentum shifts through line crossovers and divergences. As a second opinion on a trend you already read from structure, it earns its screen space.
The lag is structural. MACD inherits the lag of two EMAs, then adds a third layer of smoothing for the signal line. By the time the signal line crosses, price has often moved well past the turn. MACD is not an early warning tool. It is a confirmation tool.
Quiet markets produce false crosses. When price drifts sideways in a tight band, the MACD line and signal line tangle. Each cross looks like a momentum shift and means nothing. This is the same failure mode as every moving average tool, compressed into two lines.
The settings are convention, not magic. The MACD framework built the indicator around 12, 26, and 9, and those numbers became the default on nearly every platform. Traders keep them because everyone else watches them, which gives the readings a shared reference point. Changing them changes the sensitivity, not the logic.
Two Lines and a Gap
Hypothetical numbers, round ones. A stock climbs from 100 to 112 over three months. The fast EMA settles around 110, the slow EMA around 105.5. The MACD line reads 4.5.
That 4.5 says the recent average price leads the longer average by a wide margin. The trend regime is up, and the gap is large by this stock's recent standards.
The signal line, a 9-period EMA of the MACD line, trails at 3.8. The gap between the two lines is 0.7 in the MACD line's favor. Momentum is positive, and it is running above its own recent norm.
Then the stock stalls at 112. It stops making new highs and drifts sideways. The fast EMA flattens first, because it weights recent prices more. The MACD line falls toward the signal line, and the gap shrinks to 0.2.
Walk the readings. The MACD line is still well above zero: the trend regime never changed. The signal line cross, when the shrinking gap finally closes, announces that momentum has cooled to its average pace. The shrink from 0.7 to 0.2 said it first, bar by bar, before any cross printed.
That is the practical read. The zero line tells you regime. The gap between the lines tells you whether the move is accelerating or coasting. The stall at 112 was visible in the gap long before price gave anything back.
| Component | What It Is | What It Says |
|---|---|---|
| MACD line | 12-period EMA minus 26-period EMA | Trend regime and raw momentum: positive means the fast average leads |
| Signal line | 9-period EMA of the MACD line | The recent norm for momentum; crossovers against it mark shifts |
| Histogram | MACD line minus signal line, drawn as bars | The size of the momentum edge; covered fully in the next lesson |
| Zero line | Where the two EMAs are equal | The regime border: above it the fast EMA leads, below it the slow one does |
MACD, Answered
What do the MACD settings 12 26 9 mean?
They are the periods of the three EMAs inside the indicator. The MACD line is the 12-period EMA minus the 26-period EMA, and the signal line is a 9-period EMA of that result. They are the creator's original values and the default on nearly every charting platform.
Is a MACD crossover a buy signal?
No. A crossover says momentum is accelerating relative to its own recent norm, nothing more. In a strong uptrend it often confirms what structure already showed. In a range it fires constantly and means little. Treat it as confirmation inside a larger read, never as a standalone trigger.
Why does MACD lag?
Because it is built from lagging parts. Two EMAs already trail price, and the signal line adds a third layer of smoothing on top. The indicator trades speed for smoothness, so it will always describe a turn after price has started it.
Does MACD work in ranging markets?
Poorly. In a range, the fast and slow EMAs braid together, so the MACD line hovers near zero and the two lines cross repeatedly without meaning. MACD is a trend and momentum tool; it needs a directional market to say anything useful.