Trend Strength — How to Measure It
Trend strength is not how fast price moves but how completely one side keeps winning, and you measure it from what the chart already shows: the slope of the swings, the depth of the pullbacks, and how much progress each new swing makes. You already know how to tell a healthy trend from a tired one by its phase behavior. This post is about the other half of the skill: putting a measurement on strength itself, so you can compare two trends and say which one deserves your money.

Think of it like coffee strength. Two cups can be the same size while one is twice as strong, because strength is concentration, not volume.
The Three Measurable Dimensions
Everything you need is printed on the chart. No indicator required. Three dimensions, each one observable with your eyes and a rough count of bars.
Slope. How steep is the advance or decline? A trend that gains ten points over ten sessions has a different character than one that gains ten points over sixty. Steepness tells you how urgently one side is pressing. You can see it by looking at the angle of the swing highs and lows, or by simply counting how many sessions a leg takes to cover its ground.
Swing progress. How much new ground does each swing gain? In a strong uptrend, every push higher clears the previous high by a comfortable margin. When each new high barely exceeds the last one, the buyers are still winning but winning less. Measure it in points or percent: new high minus old high, swing after swing.
Pullback behavior. How much of each swing does the counter-move give back? This is the dimension most traders skip, and it carries the most information. A pullback that retraces a third of the prior swing tells you sellers are weak. A pullback that retraces two-thirds tells you sellers are nearly matching the buyers.
None of these need a formula. You are comparing distances on a chart you already know how to read.
Why Direction Alone Is Half the Answer
Two markets can move the same percentage over the same period and carry completely different strength. Direction tells you where price went. Strength tells you how contested the trip was, and that determines how likely the trip is to continue.
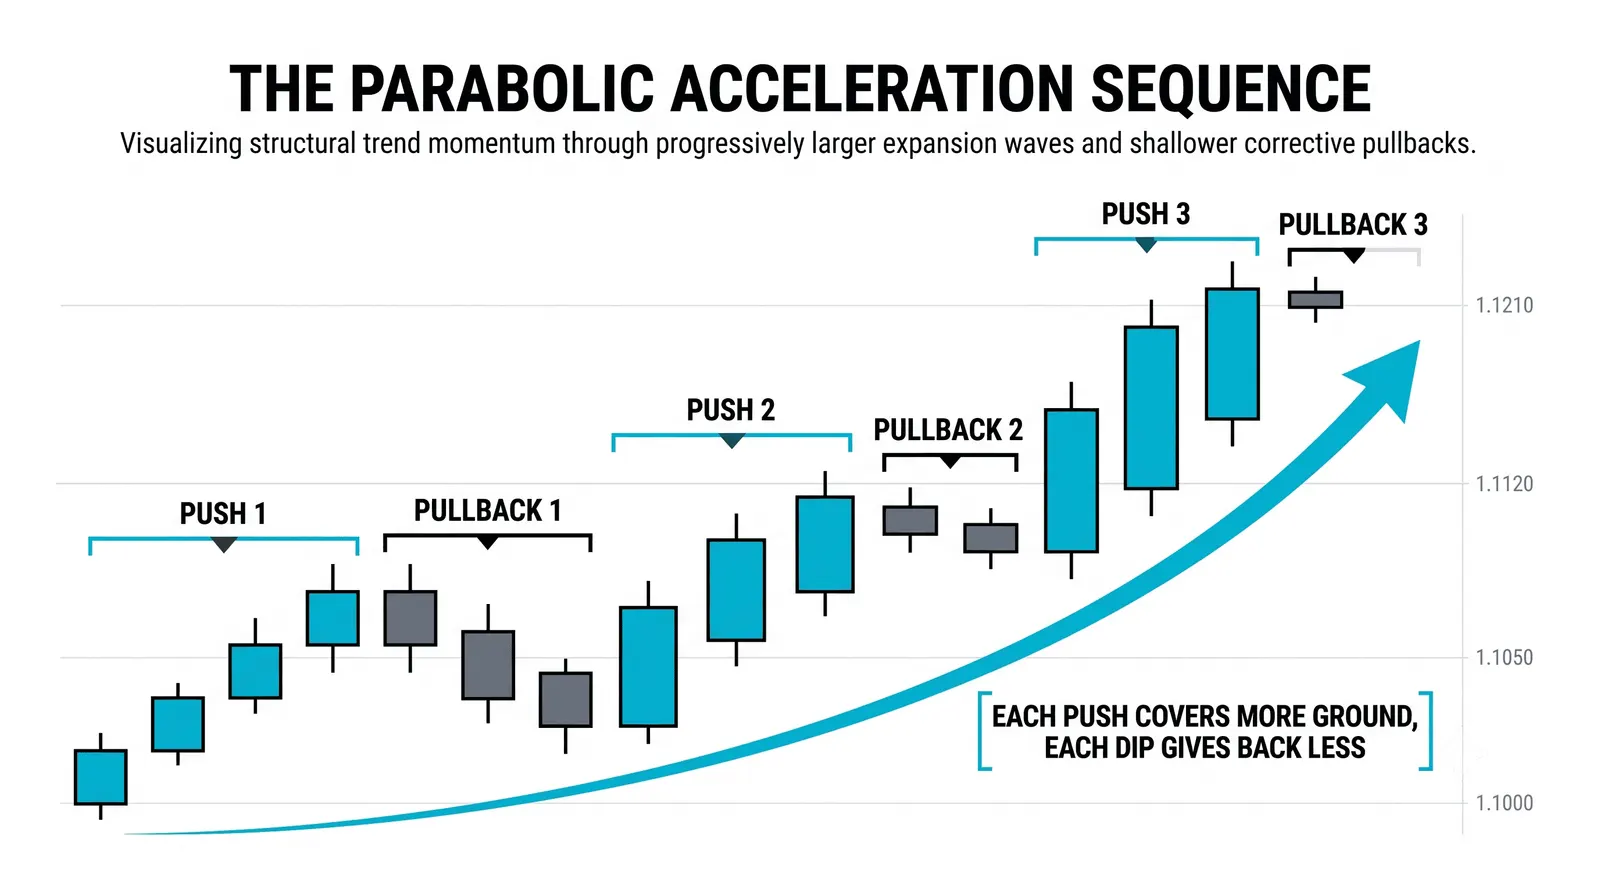
A market that rises ten percent with shallow pullbacks and expanding swings is dominated by buyers. A market that rises the same ten percent with deep, grinding pullbacks is a market where sellers show up every single session and lose by a shrinking margin. Same destination, different vehicle. The first trend can absorb bad news. The second one is one decent selling wave away from giving back weeks of work.
This is why "the trend is up" is an incomplete trade thesis. Up how? Up with what kind of opposition? Direction gets you into the conversation. Strength decides your position size, your stop placement, and whether you buy the next pullback at all.
Reading Strength From Pullbacks
The counter-move is the honest measure of the move. Anyone can look strong while pushing in their own direction. What reveals a trend is what happens when the other side gets its turn.
A useful yardstick is the retracement fraction. Take one completed swing, then measure how much of it the following pullback erases:
- About a third or less: strong trend. Sellers cannot even recover half of what buyers just took. Pullbacks here are opportunities, and they tend to be short in both depth and time.
- Around half: normal, balanced trend. Both sides are active, but the trend side still controls the net result. Tradeable, with more respect for support levels.
- Two-thirds or more: surviving, not advancing. The trend is technically intact, but each swing is a fight that nearly ends in a draw. New entries here carry poor odds of follow-through.
Watch the time dimension too. A shallow pullback that lasts many sessions is a different message than a shallow pullback that lasts two. Strong trends correct briefly, because buyers do not wait.
One blunt rule: the pullback is the audit, and the trend has to pass it every time.
When Strength Fades Before Direction Does
Strength is usually the first thing to leave and the last thing traders notice. Price keeps making new highs, the direction stays technically intact, and meanwhile the internals quietly deteriorate.
The sequence is reliable enough to watch for. First, the swings shrink: each new push covers less ground than the one before. Then the pullbacks deepen: retracements that used to stop at a third start reaching half, then two-thirds. Finally, progress per session falls: the trend needs more days to achieve less.
None of this breaks the trend on its own. Higher highs and higher lows can persist through the entire decay. That is exactly the trap. Traders who read only direction stay long and confident while the trend's engine loses cylinders. Traders who read strength start tightening stops, taking partial profits, or simply refusing to add.
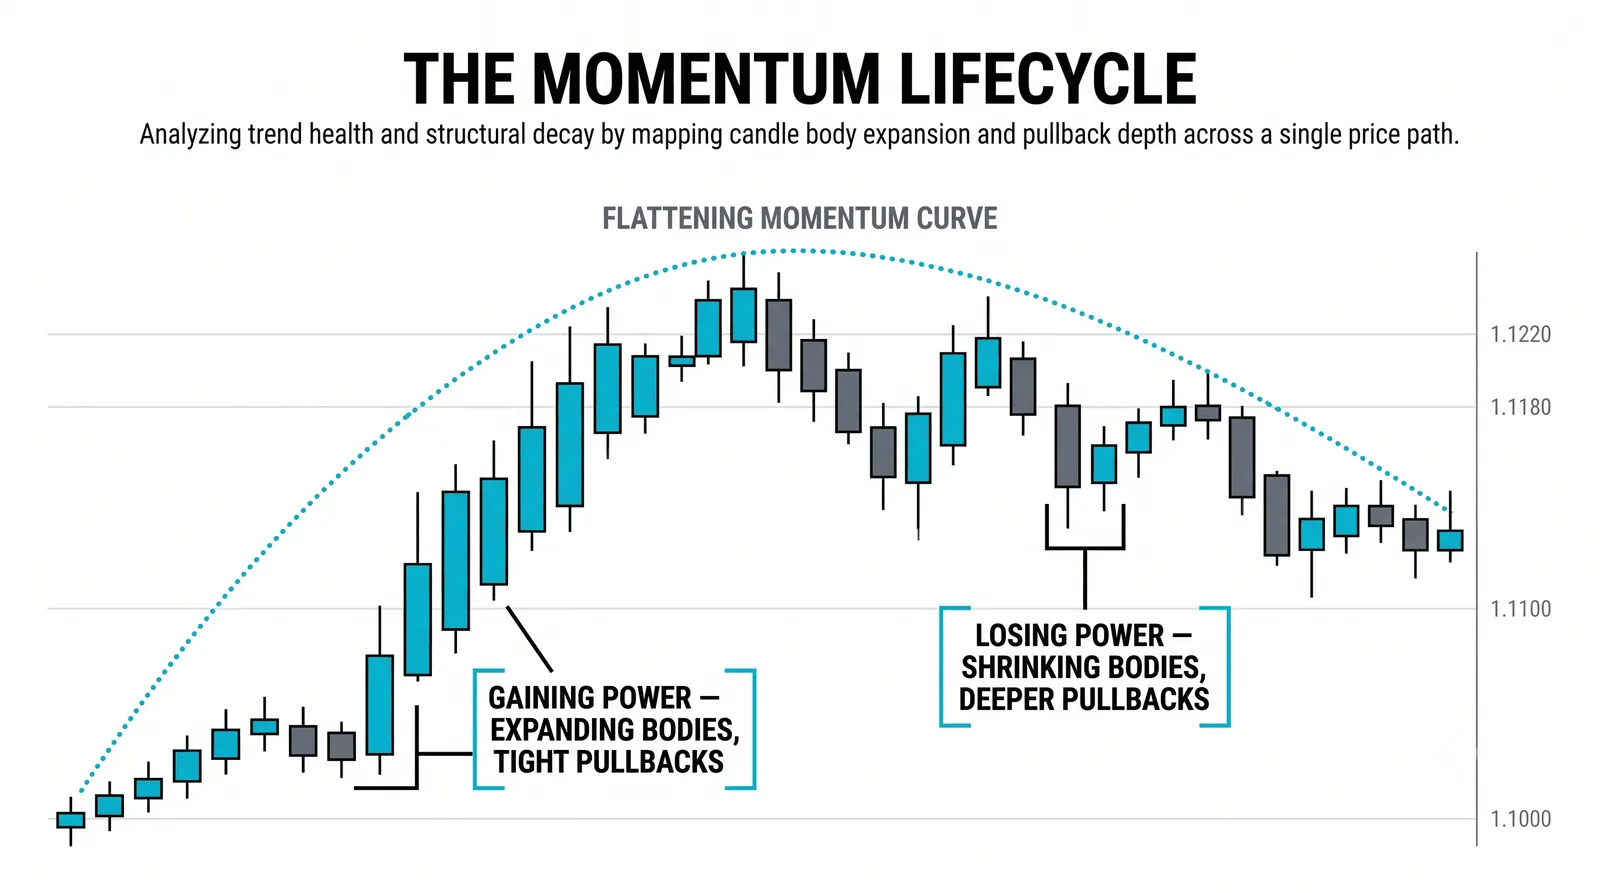
You are not predicting a reversal when you do this. You are acknowledging that the evidence supporting the trade is weaker than it was, and sizing your exposure to match.
Two Trends, One Direction
Here is a hypothetical comparison with round numbers. Two stocks, both up ten percent. Same direction, same gain, completely different strength.
Stock A climbs from 100 to 110 in 10 sessions. It does this in four swings up. Each swing gains roughly 3 to 4 points, and each pullback gives back about a third of the prior swing, roughly 1 point, before buyers step back in. Each new high clears the previous one by a wide margin. Slope: steep. Swing progress: large. Pullbacks: shallow and short.
Stock B climbs from 100 to 110 in 60 sessions. It needs nine swings to cover the same ground. Each swing gains only about 2 points, and each pullback hands most of that back before the next attempt. New highs clear old highs by fractions of a point. Slope: flat. Swing progress: small. Pullbacks: deep and slow.
Now compare what this means for a pullback buyer. In Stock A, buying a pullback means entering a trend where sellers have repeatedly failed to reclaim even half of any swing. Your stop can sit just below the pullback low, a tight, logical invalidation. In Stock B, the same buy means entering a trend where sellers routinely reclaim most of every swing. Your stop must sit far away to survive normal noise, which wrecks your reward-to-risk, or sit tight and get hit constantly.
Same ten percent. One trend pays the pullback buyer; the other taxes them. The measurement told you that before the entry, using nothing but swing distances.
Strong Versus Fading, Side by Side
| Dimension | Strong Trend Shows | Fading Trend Shows |
|---|---|---|
| Slope | Steep angle; legs cover ground in few sessions | Flattening angle; same ground takes more sessions |
| Swing progress | Each new extreme clears the last by a wide margin | New extremes barely exceed the previous ones |
| Pullback behavior | Retraces a third or less of each swing, briefly | Retraces half to two-thirds, and takes longer |
| Overall read | One side dominates; pullbacks are entries | Contested ground; tighten risk, stop adding |
Trend Strength, Answered
Can I measure trend strength without indicators?
Yes, and the chart-only version is arguably better. Slope, swing progress, and pullback depth are all distances you can measure with your eyes or a ruler tool. Indicators like ADX just compress the same information into a number. Learn to read the raw swings first, then decide if you want the shortcut.
Does high volume always mean a strong trend?
No. High volume means high participation, which can accompany either a strong trend or a violent tug-of-war. A trend rising on moderate volume with shallow pullbacks is stronger than one rising on huge volume with deep pullbacks. Volume tells you how many showed up; the swing structure tells you who is winning.
What does it mean when strength fades but price still rises?
It means the trend is intact but weakening, and your risk management should change before your directional bias does. Shrinking swings and deepening pullbacks with price still making new highs is a signal to tighten stops, reduce size, or stop adding, not necessarily to short. Direction and strength are separate dials, and they often move at different speeds.
Which dimension matters most?
Pullback behavior, because it measures the opposition directly. Slope and swing progress describe what the winning side does on offense; pullback depth shows what the losing side can accomplish on its best attempt. A trend where the counter-move keeps failing to retrace even a third of each swing has weak opposition, and weak opposition is what keeps trends alive.
Next, take this measurement habit into multiple timeframes: a trend that reads strong on the daily chart can look very different when you check what the weekly chart says about the same ground.