Higher Timeframes Control the Fib Levels
Higher timeframes control the fib levels the way a headline controls a story: the daily chart's retracement lines decide which of the hourly chart's lines mean anything, and the lower chart's lines trade only inside the permission the higher chart grants. Draw a 38.2 percent line on the daily and a 61.8 percent line on the hourly, and the two are not equals negotiating. One is the level of record. The other is a candidate waiting for approval.

Think of the headline and the article. The headline is fixed first and read by everyone, the article is written inside it, and no paragraph in the article rewrites the headline. The daily swing is the headline. The hourly swings are paragraphs. A paragraph can be sharp, timely, and well-placed, and it still answers to the line at the top of the page.
The earlier lesson on control established the hierarchy between timeframes in general, so this one stays narrow: what the hierarchy does to ratio work specifically. Whose lines bind. Whose lines serve. That distinction decides more trades than any retracement percentage ever will.
The Lines of Record
A daily swing takes weeks to form. Every participant watching that market, from the smallest retail account to the largest desk, sees the same swing high, the same swing low, and the same retracement lines drawn between them. The daily 38.2 percent line is a price where the bigger trend's pullback is officially deep, and it is official because the crowd watching it is the largest crowd the chart can assemble.
The hourly chart's lines come from swings that took hours. Fewer eyes, shorter memory, smaller commitments. An hourly line is real, but it is local. When price bounces at an hourly line that sits far from any daily line, the bounce joins only the shallow crowd, the traders working that small swing. When price bounces at the hourly chart's location that happens to sit on the daily line, the bounce joins the deep crowd, everyone watching the larger pullback.
Same candle, same shape, two different audiences. The audience is the level.
Fibonacci cluster practice draws the higher timeframe's swings first for exactly this reason. The larger swing's levels are fixed before the smaller chart offers its opinions, so the smaller chart's ratios are always measured against something already standing. Draw the small lines first and the chart fills with candidates that look equal. They are not equal.
The rule the control produces is simple to state and hard to obey: the entry chart may time the trade but never relocate it. The zone belongs to the higher chart. The hourly chart decides when inside that zone, never where.
What the Control Decides
Three decisions fall out of the hierarchy, and each one removes a common mistake.
- The zone. A trade location is valid only where a higher timeframe line stands. The hourly chart can refine inside that zone, tightening the entry by a few ticks, but it cannot declare a new zone of its own.
- The timing. The lower chart earns its keep here. Reversal candles, momentum shifts, the first sign that the pullback is done: all of that is hourly work, done inside the daily's address.
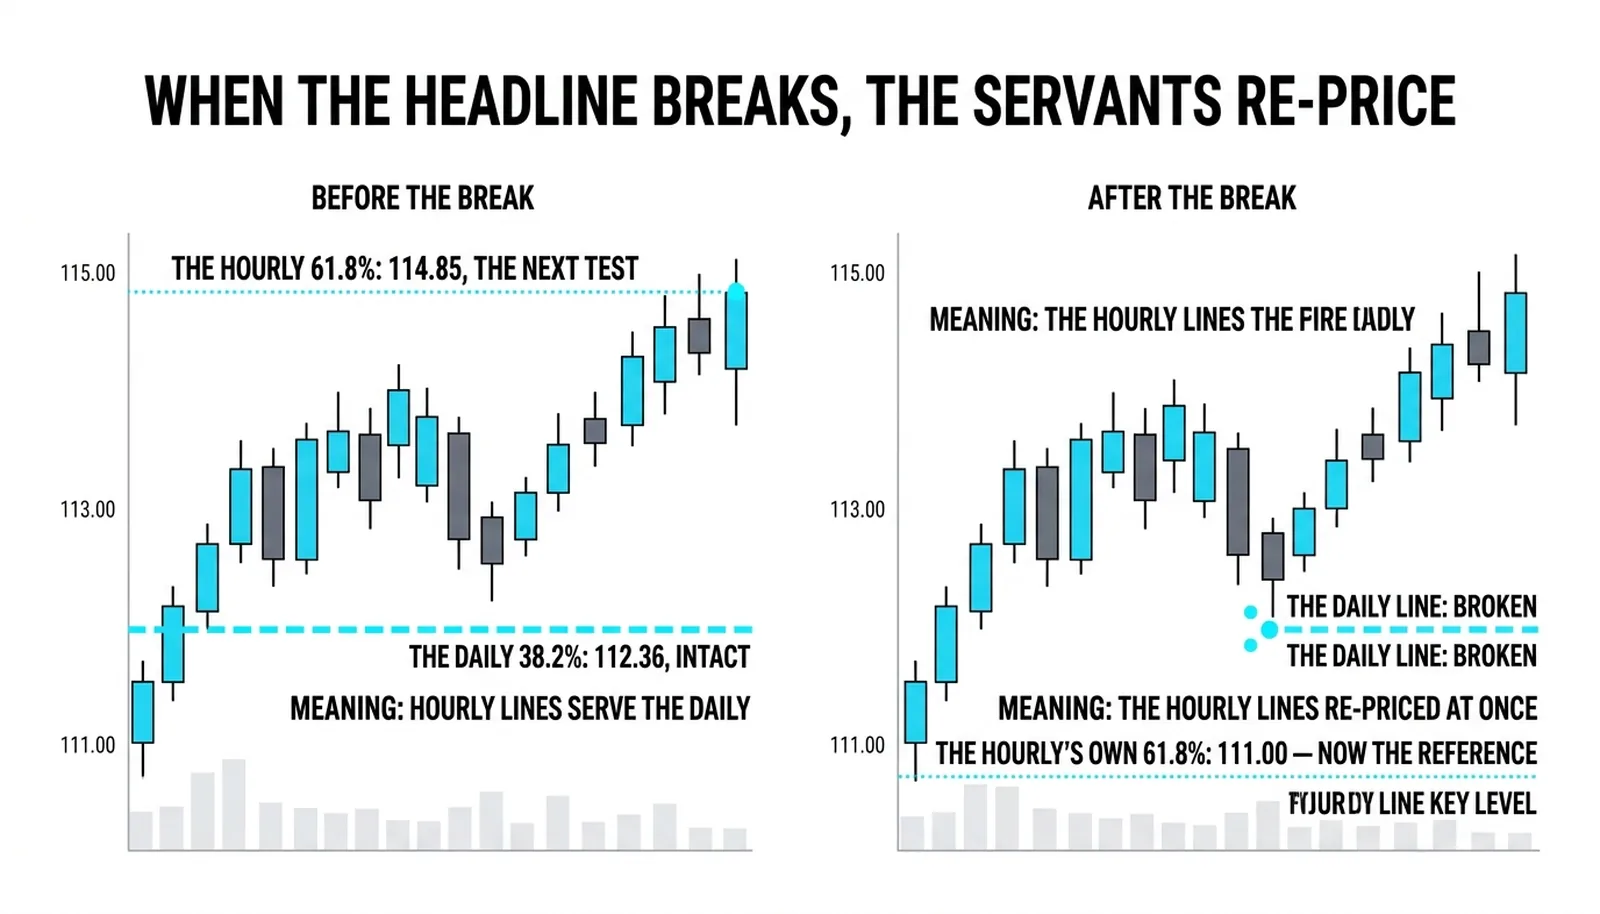
- The rewrite. When the daily line breaks, every hourly line inside the old structure is re-priced at once. The headline changed and every article under it is rewritten.
The price action canon covers the failure case directly. A level holds because the traders respecting it keep defending it, and when the daily line gives way, that defense is gone. The hourly lines drawn inside the old pullback do not gently fade in relevance. They become marks on a chart describing a structure that no longer exists. Traders who keep honoring them are reading yesterday's article under today's headline.
Now the honesty, because control is not prophecy. The daily line breaks too. Sometimes the lower chart's reversal candles fire before the daily confirms anything, and the move runs without the higher chart's blessing. The trader who waits for the higher chart to agree on everything enters after the move, paying worse prices for more certainty. The discipline is not obedience to the daily. The discipline is knowing that a trade taken at the daily line carries the deep crowd behind it, and a trade taken anywhere else carries only whoever happened to be watching that hour.
Trading Under the Headline
The practical routine has two moves: a refusal and an acceptance.
The refusal comes first. Price pulls back, the hourly chart prints a clean reversal candle at the hourly chart's own retracement line, and nothing from the daily sits anywhere nearby. This is the trap the hierarchy exists to catch. The setup looks complete on the hourly chart because the hourly chart cannot show what is missing. Under this method, that bounce is declined. It may work for a few bars. It may even run. It is still a shallow-crowd trade, and shallow crowds abandon levels quickly.
The acceptance comes when price reaches the daily line. Now the hourly chart's job begins. Watch for the reversal candle inside the daily zone, let it close, and enter on that close or just beyond it. The stop goes below the daily line, not below the hourly low, because the daily line is what the trade is built on. If the daily line fails, the trade's reason is gone, so the stop belongs where the reason dies.
Targets work the same way. The first target sits at a level the higher chart recognizes, a prior swing extreme or the next daily ratio, not at some hourly projection. Every piece of the trade traces back to the higher chart's structure, with the lower chart contributing only the when.
The Daily Line at 112.36
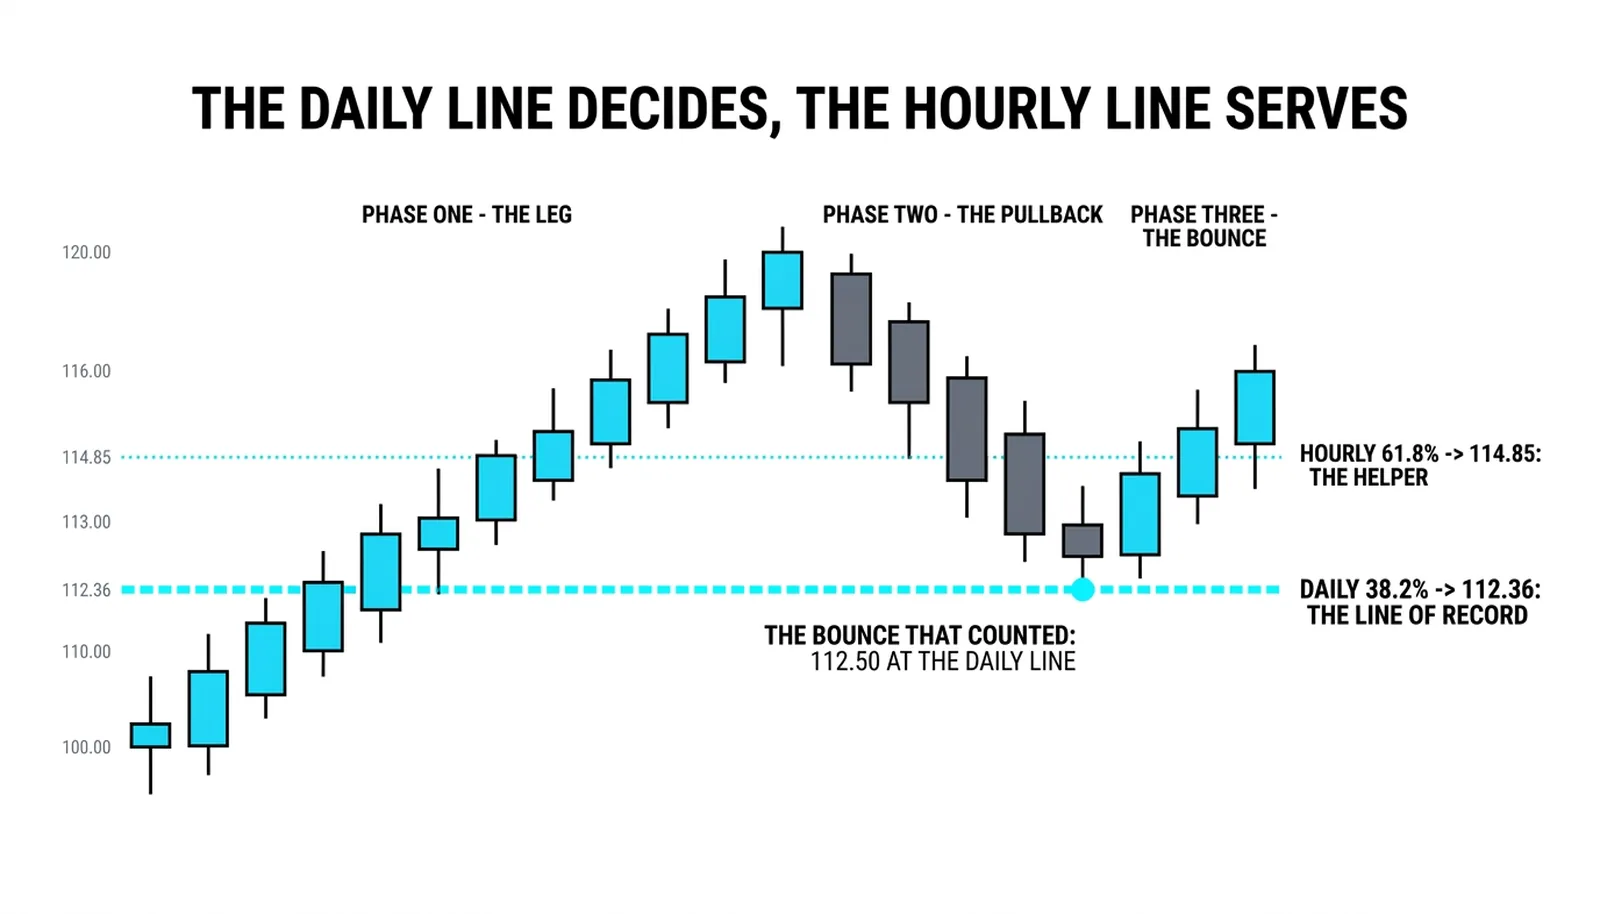
A hypothetical illustration with round numbers. The daily swing runs 20.00 points, from 100.00 up to 120.00. The 38.2 percent retracement line sits at 112.36. That is the level of record, the price where the larger trend's pullback becomes officially deep.
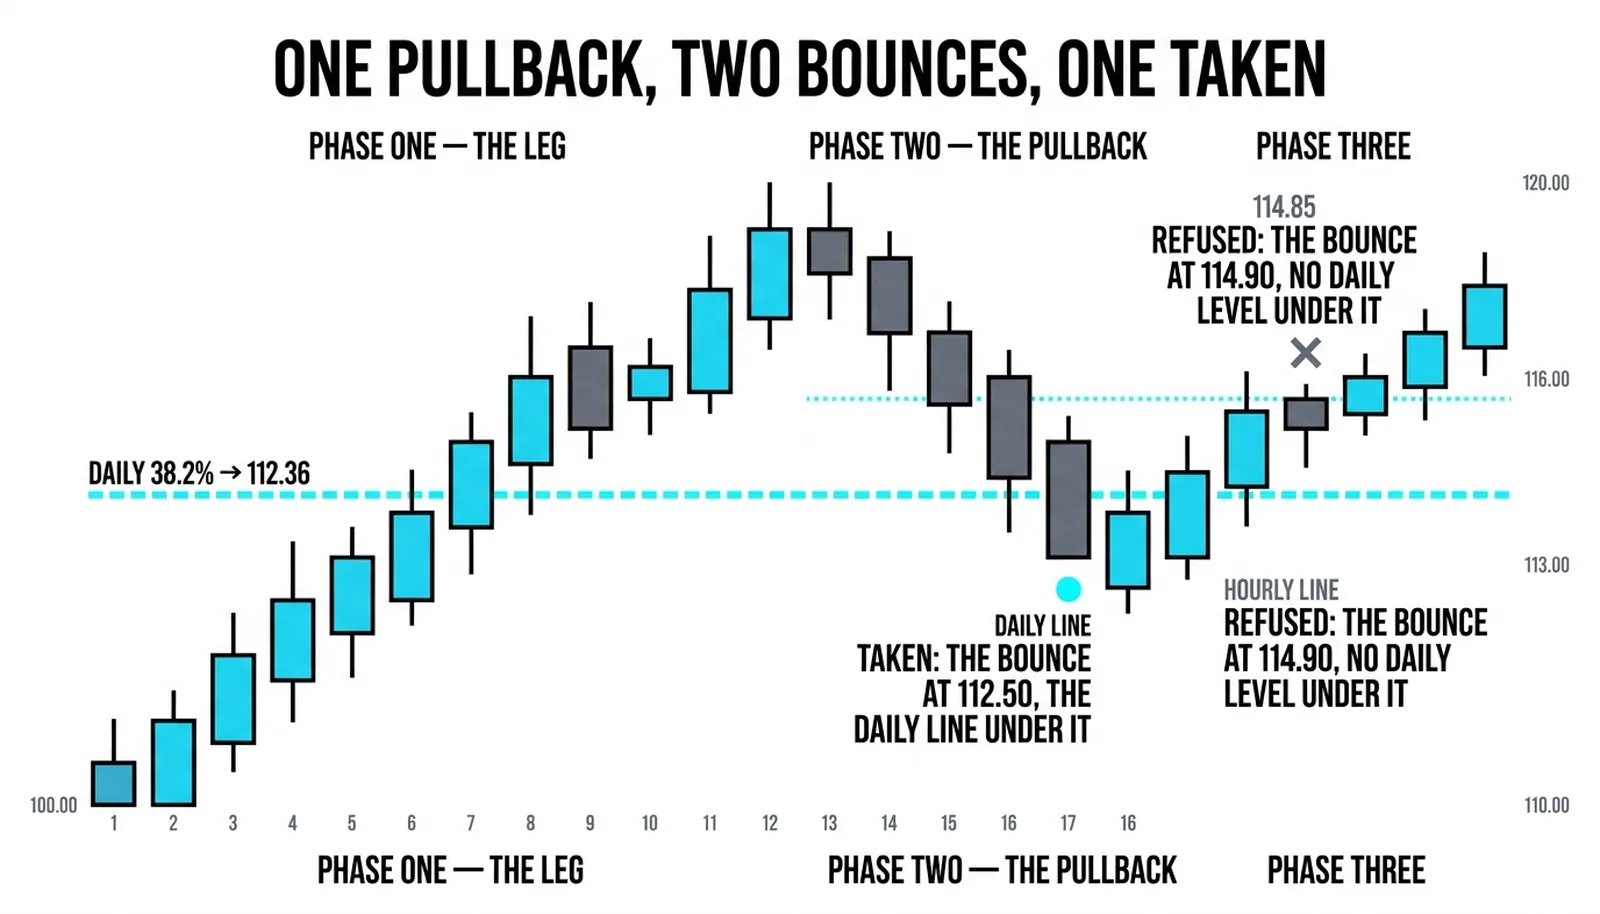
Price starts pulling back. On the hourly chart, the most recent leg runs from 116.00 down to 113.00, and that leg's own 61.8 percent line sits at 114.85. As price falls through 115.00, the hourly chart prints a tidy reversal candle right at 114.90, a whisker from the hourly line. No daily level stands anywhere near it. Under this method, the bounce is refused. The market does turn for a few bars, then the shallow bounce dies, and price continues down toward the daily zone. The refusal cost nothing.
Price reaches 112.50, touching the daily line's zone. Now the hourly chart matters. A reversal candle forms and closes at 113.20. The long is taken at 113.30 on that close. The stop sits at 111.80, below the daily line, risking 1.50. The first target is 118.00, near the prior swing area, a gain of 4.70, roughly 3.1 times the risk.
Read the division of labor in that trade. The hourly line at 114.85 was consulted and outranked. The trade happened where the daily said and timed when the hourly said. Neither chart did the other's job.
| The Chart | The Line | The Crowd Behind It | What It Decides |
|---|---|---|---|
| Daily | 38.2 percent at 112.36 | Everyone watching the weeks-long swing | The zone, the stop's location, the target |
| Hourly | 61.8 percent at 114.85 | Traders working one small leg | Nothing, once outranked |
| Hourly | Reversal close at 113.20 | Traders timing inside the daily zone | The entry trigger |
| Daily | Break of 112.36 | The deep crowd, exiting | The rewrite of every lower line |
Control Questions, Answered
How do higher timeframes control fibonacci levels?
By deciding which lines carry the weight of the largest crowd. A retracement line works because enough traders respect it, and the higher timeframe's lines are the ones the most participants see, so the lower chart's lines operate only inside the permission those bigger lines grant.
Which timeframe owns the zone?
The higher timeframe owns the zone, always. The lower timeframe may time the entry inside that zone, tightening the trigger and sharpening the stop, but it can never declare a location of its own. Location is a higher-chart decision; timing is the lower chart's contribution.
What happens when a higher timeframe level breaks?
Every lower timeframe line inside the old structure is re-priced immediately. The structure those lines described no longer exists, so they stop acting as levels and start acting as history. Traders who keep honoring them are trading a headline that has already been replaced.
Can a lower timeframe line ever outrank a higher one?
No, not while the higher structure stands. A lower line gains power only when it overlaps a higher one, borrowing the deep crowd's attention. Standing alone, it serves the shallow crowd, and the shallow crowd's levels fail faster and mean less when they do.
With the hierarchy settled, the next step is putting the ratios to work at a single scale: running the same retracement practice on one timeframe until the drawing, the zones, and the refusals become routine. That repetition is where the method stops being a concept and starts being a habit.