What Is Order Flow and Why It Matters
Order flow is the record of every executed trade, tagged with which side initiated it, the buyer or the seller, at what price, and in what size. It matters because a price chart only shows the outcome while order flow shows the intent that produced it. Two bars can look identical on a chart and mean completely different things underneath.

The Market Profile block showed you where volume concentrated and where the auction found acceptance. Order flow is the next layer down: it is the instrument panel that makes the earlier claim, that volume shows effort, something you can actually watch in real time. Think of a heart-rate monitor at the running track: the race clock shows the lap times, the monitor shows the heartbeat underneath, two views of the same run and only one of them tells you how much is left in the legs.
What Order Flow Records
Every fill on a centralized exchange gets tagged one of two ways. If a buyer lifts the offer, the trade is buyer-initiated. If a seller hits the bid, the trade is seller-initiated. That single tag, applied to every print, is the raw material everything else is built from.
Three classic windows let you read that raw material. The first is the depth-of-market ladder, often called the DOM, which shows the resting limit orders queued at each price above and below the market. You see the bids stacked below and the offers stacked above, and you watch them get pulled, added, or hit.
The second window is the per-bar chart that splits each price level's volume into bought at the ask versus sold at the bid. Instead of one volume number per bar, you see two numbers per price: how much traded because buyers reached up, and how much traded because sellers reached down.
The third window is delta, the simplest summary of the whole stream. Delta is bought volume minus sold volume over whatever period you choose. A positive delta means buyers initiated more; a negative delta means sellers did.
The order flow framework treats these tools as essential timing instruments for the day trader, and that framing is accurate. They do not tell you where price should go. They tell you who is pushing, how hard, and whether the other side is absorbing the push.
Hold the boundary clearly. Order flow reads the present in fine grain. It does not predict. It lets you see aggression, hesitation, and absorption as they happen, which is a timing edge, not a crystal ball.
What It Adds to the Profile Tools
The profile tools told you where business got done. Order flow tells you how it got done, moment by moment. Effort stops being an inference and becomes a live reading.
Aggression shows up first. When buyers keep lifting offers without waiting for pullbacks, the tape shows a run of buyer-initiated prints and a rising positive delta. That is urgency, and urgency is information.
Hesitation shows up next. Prints thin out, delta flattens, the ladder goes quiet at a level where you expected a fight. A market that was supposed to break and instead goes still is telling you something the candle has not said yet.
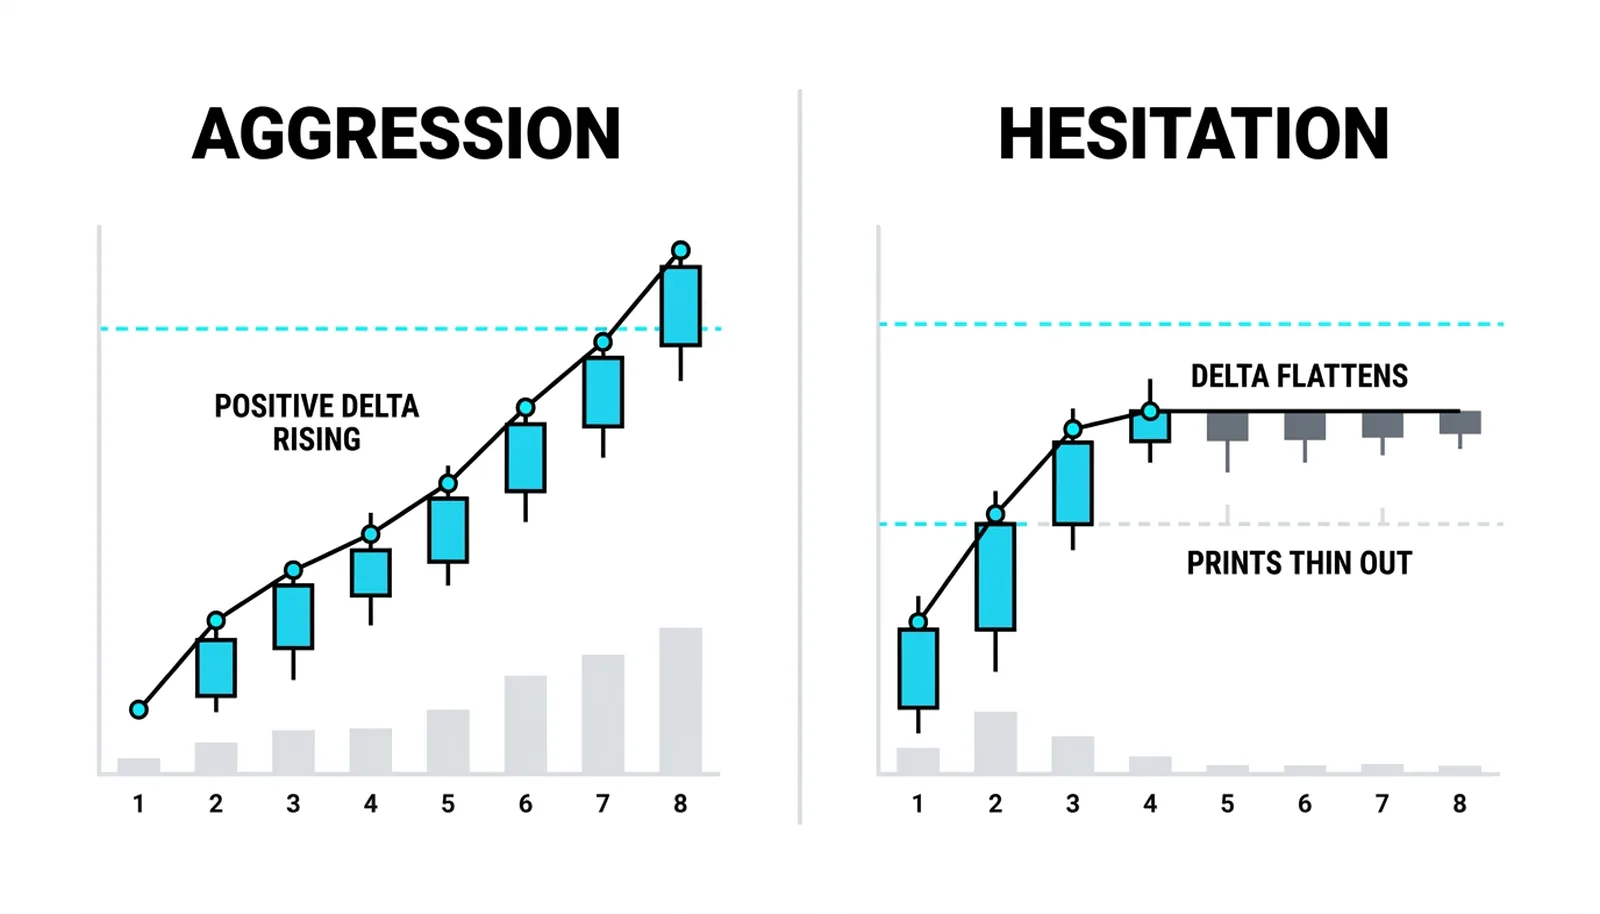
Absorption is the subtlest read and the most valuable. Heavy selling hits the bid, the delta goes sharply negative, and price refuses to fall. Someone is sitting there taking everything offered. That is a wall of passive interest eating aggressive flow, and it often marks the spot where a move exhausts itself.
Each of these reads is visible only in the flow. A candle closes and shows you the result. The flow shows you the argument that produced it.
The Limits of the Read
Data quality decides everything. Order flow work assumes a single, complete tape of every transaction. Centralized exchanges provide that. Forex and other decentralized markets do not, because there is no single tape, only fragments from individual venues.
If you want to do this work honestly, trade instruments with centralized exchange data, and ideally pay for the deeper level-two feed that also shows the resting book, not only the prints. A partial feed gives you partial intent, and partial intent can be worse than none because it still feels like certainty.
The second limit is deeper. Seeing intent is not knowing the future. Aggressive buyers can be trapped at a high when the offers reload above them. Aggressive sellers can be shaken out at a low when the bids absorb and price snaps back. The flow showed real urgency in both cases, and both traders still lost.
The read improves the odds. It never guarantees the outcome. Treat it as evidence, not verdict, and size your trades accordingly.
One Bar, Under the Skin
Here is a hypothetical illustration with invented round numbers. A stock prints a five-minute bar that runs from 118.2 to 118.9 and closes near the high at 118.9, on 4,800 shares of total volume.
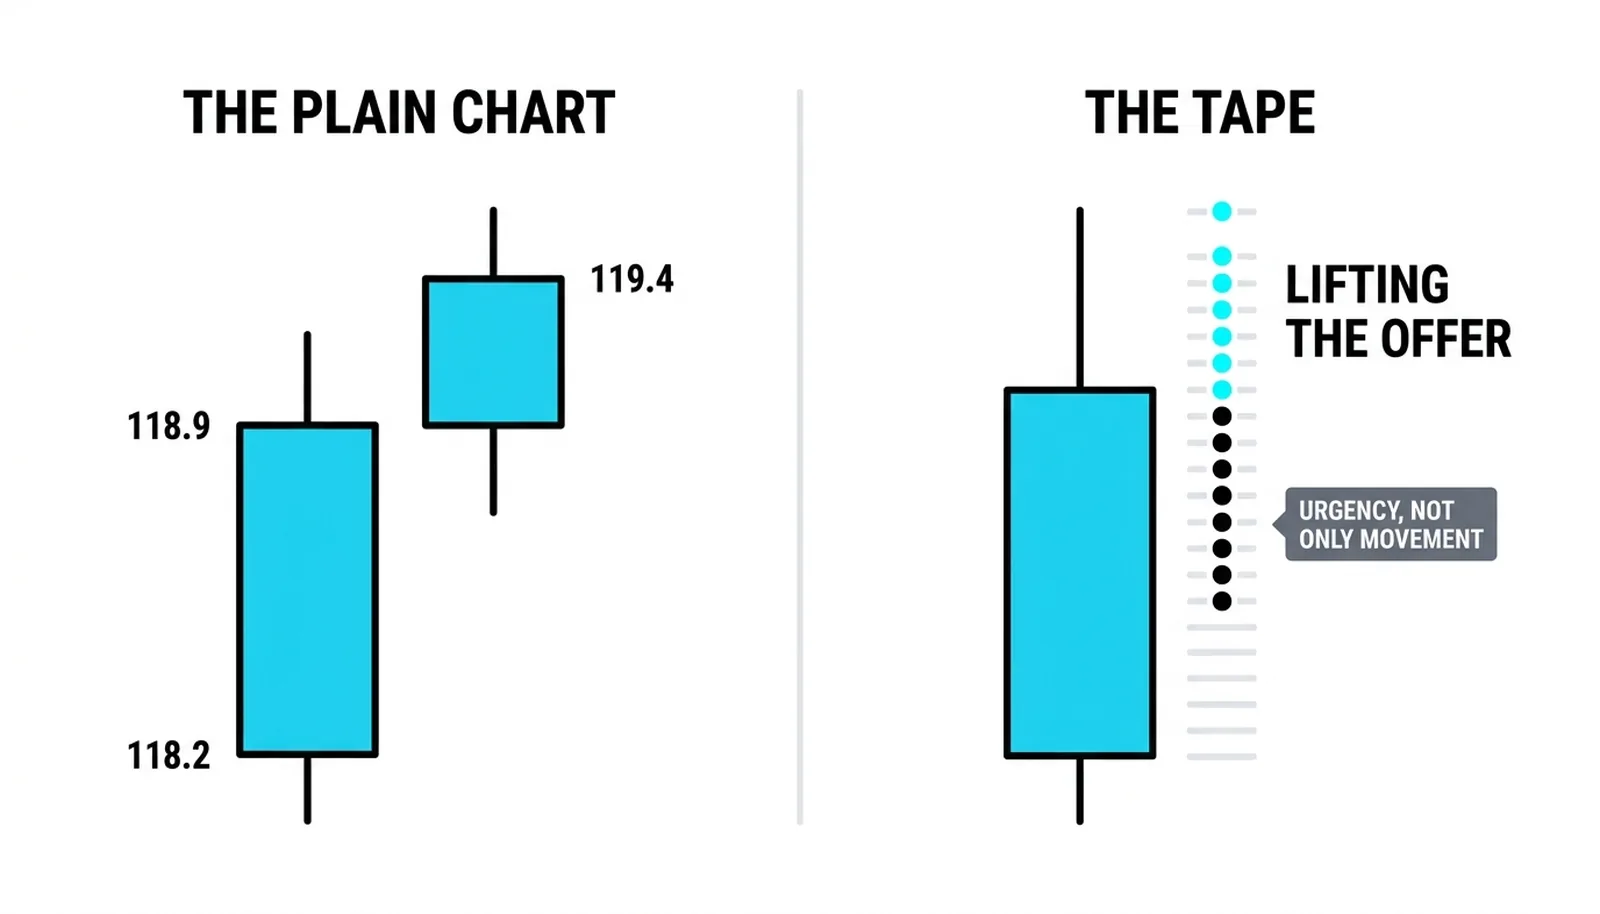
On a plain chart, that bar says one thing: price rose. A trader sees a strong close and not much else.
Now split the tape. Of the 4,800 shares, 2,976 executed at the ask, buyer-initiated. That is sixty-two percent of the bar. The remaining 1,824 shares hit the bid. Delta for the bar is positive 1,152 shares.
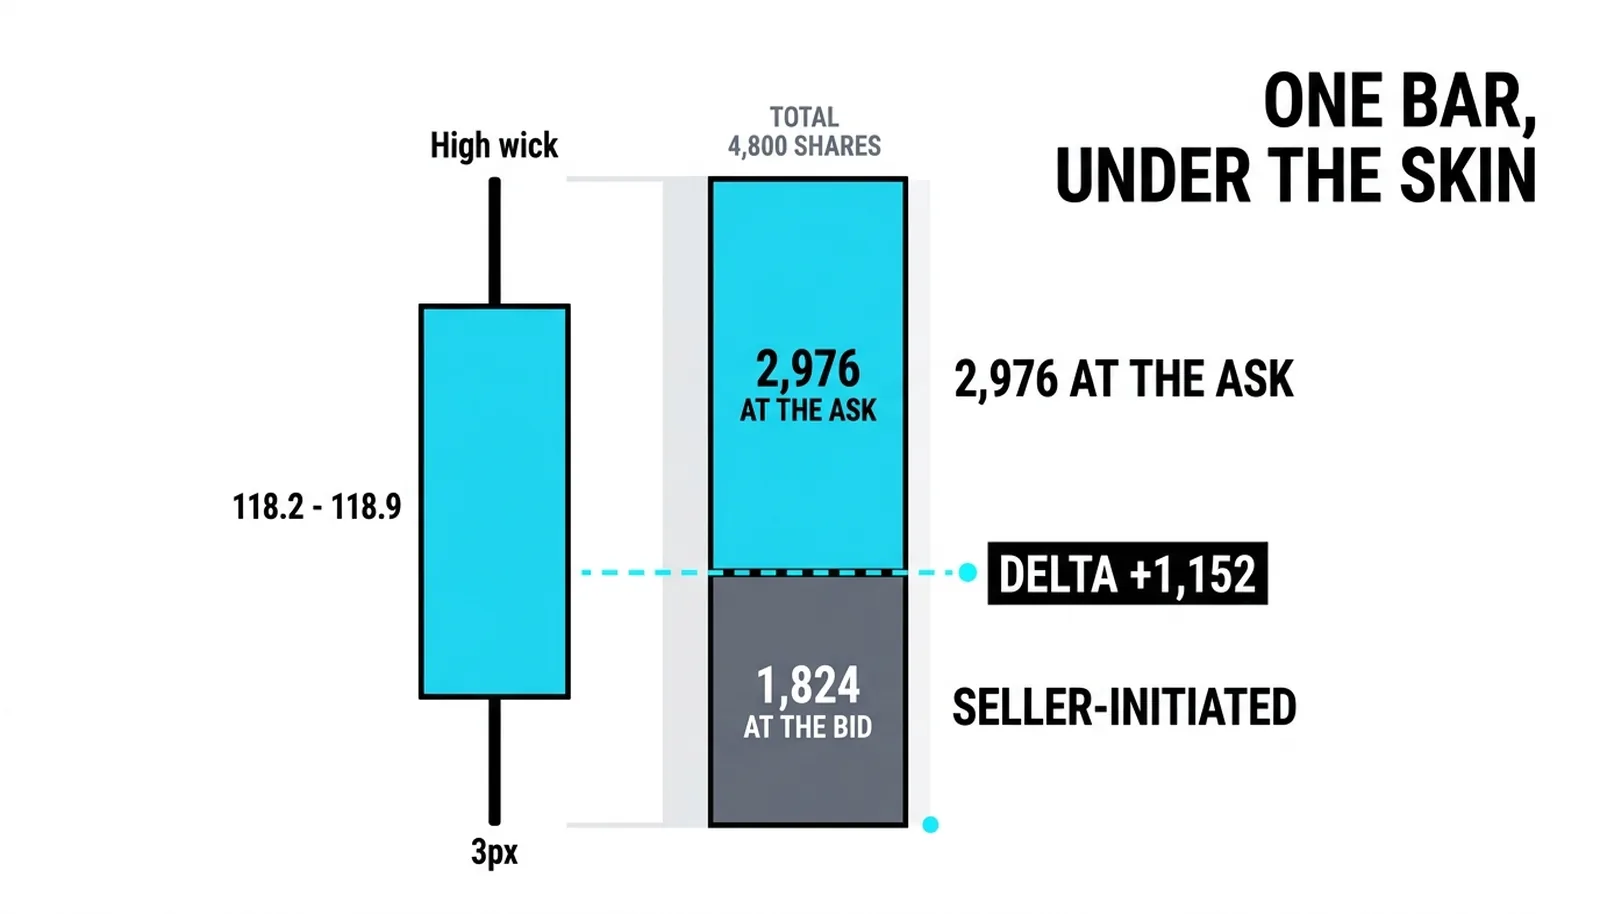
That split changes the read. Buyers initiated most of the trade and paid up to do it, lifting the offer rather than waiting for a fill. That is the signature continuation reads are built on: urgency in the direction of the move, not only movement.
The next bar opens at 118.9 and extends to 119.4. The flow-based read, buyers pressing and getting filled, lined up with follow-through. The plain chart showed a green bar. The tape showed why it was green and who was paying for it.
| Layer | What It Shows | The Question It Answers | The Trap |
|---|---|---|---|
| Plain candle | Open, high, low, close | Where did price end up? | Outcome without cause |
| Volume total | 4,800 shares traded | How much business was done? | Effort without direction |
| Bid/ask split | 2,976 at ask vs 1,824 at bid | Who initiated the trades? | Assuming initiation equals control |
| Delta | +1,152 shares | Which side pressed harder? | Reading one bar as a trend |
Order Flow, Answered
What is order flow in trading?
Order flow is the record of every executed trade, tagged by which side initiated it, at what price, and in what size. It is the transaction-level detail underneath the chart, and it reveals the intent that produced each price move.
How is order flow different from volume?
Volume tells you how much traded; order flow tells you who initiated it. A bar with 4,800 shares of volume is one number. The same bar split into buyer-initiated and seller-initiated prints is a story about urgency, and that split is what order flow adds.
What is delta in order flow?
Delta is bought volume minus sold volume over a chosen period. A positive delta means buyers initiated more trades by lifting offers; a negative delta means sellers initiated more by hitting bids. It is the fastest single-number summary of which side was pressing.
Do you need level two data for order flow?
For serious work, yes. The basic tape shows executed trades, but the level-two feed also shows the resting limit orders in the book, which is where you see absorption and spoofed interest before trades even happen. And in decentralized markets like spot forex, no feed gives you a complete tape at all, so the honest answer is to apply order flow where centralized exchange data exists.
The next lessons take this foundation into the mechanics: how the bid and the ask actually fill orders, and the real tradeoff between market orders and limit orders. That tradeoff is where the theory you just read turns into execution decisions.