Confirming Price Action With Volume
Confirming price action with volume means treating every chart signal as a claim that volume must verify before you act on it. A breakout candle, a reversal pattern, a pullback that looks finished: each one is a hypothesis until the trading activity behind it agrees. Volume price analysis states the principle plainly: a price move backed by above-average volume is genuine, and a move the volume does not back is an anomaly worth doubting. The pattern is the hypothesis. The volume is the evidence.

Think of a notary's seal: a document can look perfect, but it is not valid until the seal goes on, and price action is not valid until volume signs it. The earlier lessons in this block taught you to read the tape and the book, the raw transactions themselves. This block steps back to the chart and asks one question of every setup you see: validated, or anomalous? That single question, asked consistently, filters out more bad trades than any indicator setting ever will.
Validated or Anomalous
The sixth principle of volume price analysis reduces the whole discipline to two words. Validation is when volume behaves the way the price action suggests it should. An anomaly is when it does not. The anomaly is a warning, not a trade. It tells you to wait, to doubt, to demand more proof. It never tells you to jump in the other direction on its own.
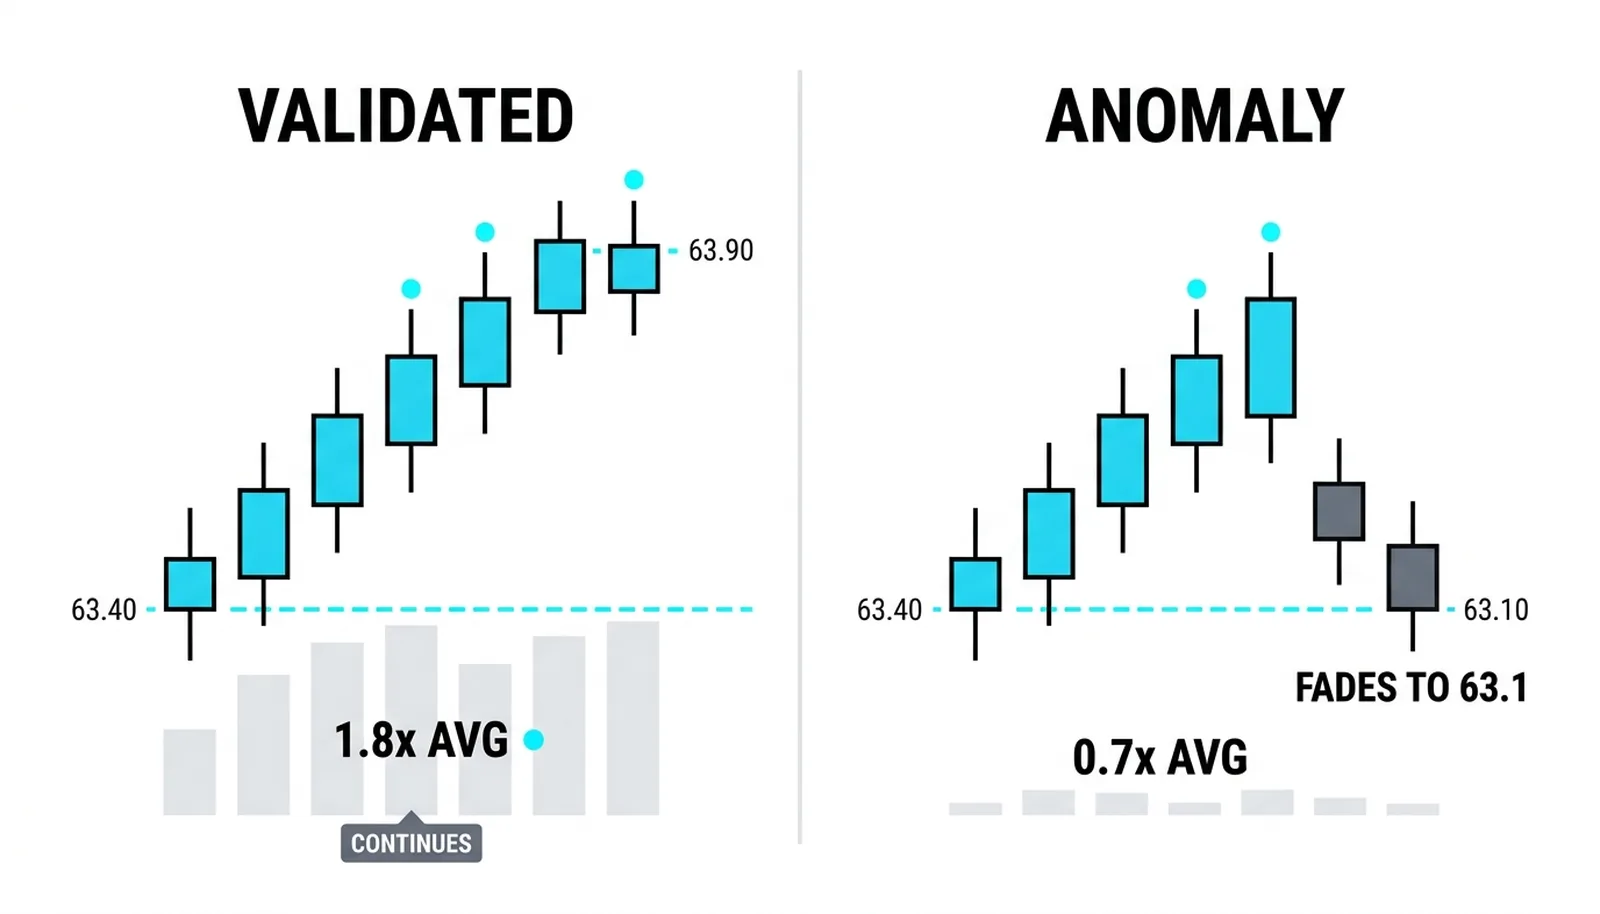
Validation has recognizable shapes. Rising moves should arrive on expanding volume, because genuine buying interest shows up as more transactions, not fewer. Pullbacks inside an uptrend should come on shrinking volume, because a real rest means sellers are not interested, only that buyers are pausing. Breakouts through a level should print volume clearly above the recent average, because breaking a defended price requires commitment from real money.
Anomalies have their own shapes, and they matter more. A new price high printed on falling volume is the classic one: the chart says strength, the volume says nobody showed up. Tight little candles drifting on almost no trade tell you the move is hollow, easily reversed by the first real order flow. And one huge volume bar that price then ignores, a massive print with no follow-through, says somebody large traded into the move and the market absorbed it without continuing.
None of this requires exotic tools. You are comparing what price claims against what participation confirms. When the two agree, you have a validated signal and can plan a trade. When they disagree, you have information of a different kind: the market is telling you the picture is incomplete.
Be blunt with yourself here. Most losing trades are taken on signals that were never validated.
Volume History Is the Judge
Above average only means something relative to the recent past. There is no universal number that counts as "high volume." The same 2 million shares can validate a move one week and qualify as an anomaly the next, depending entirely on what the stock has been doing lately.
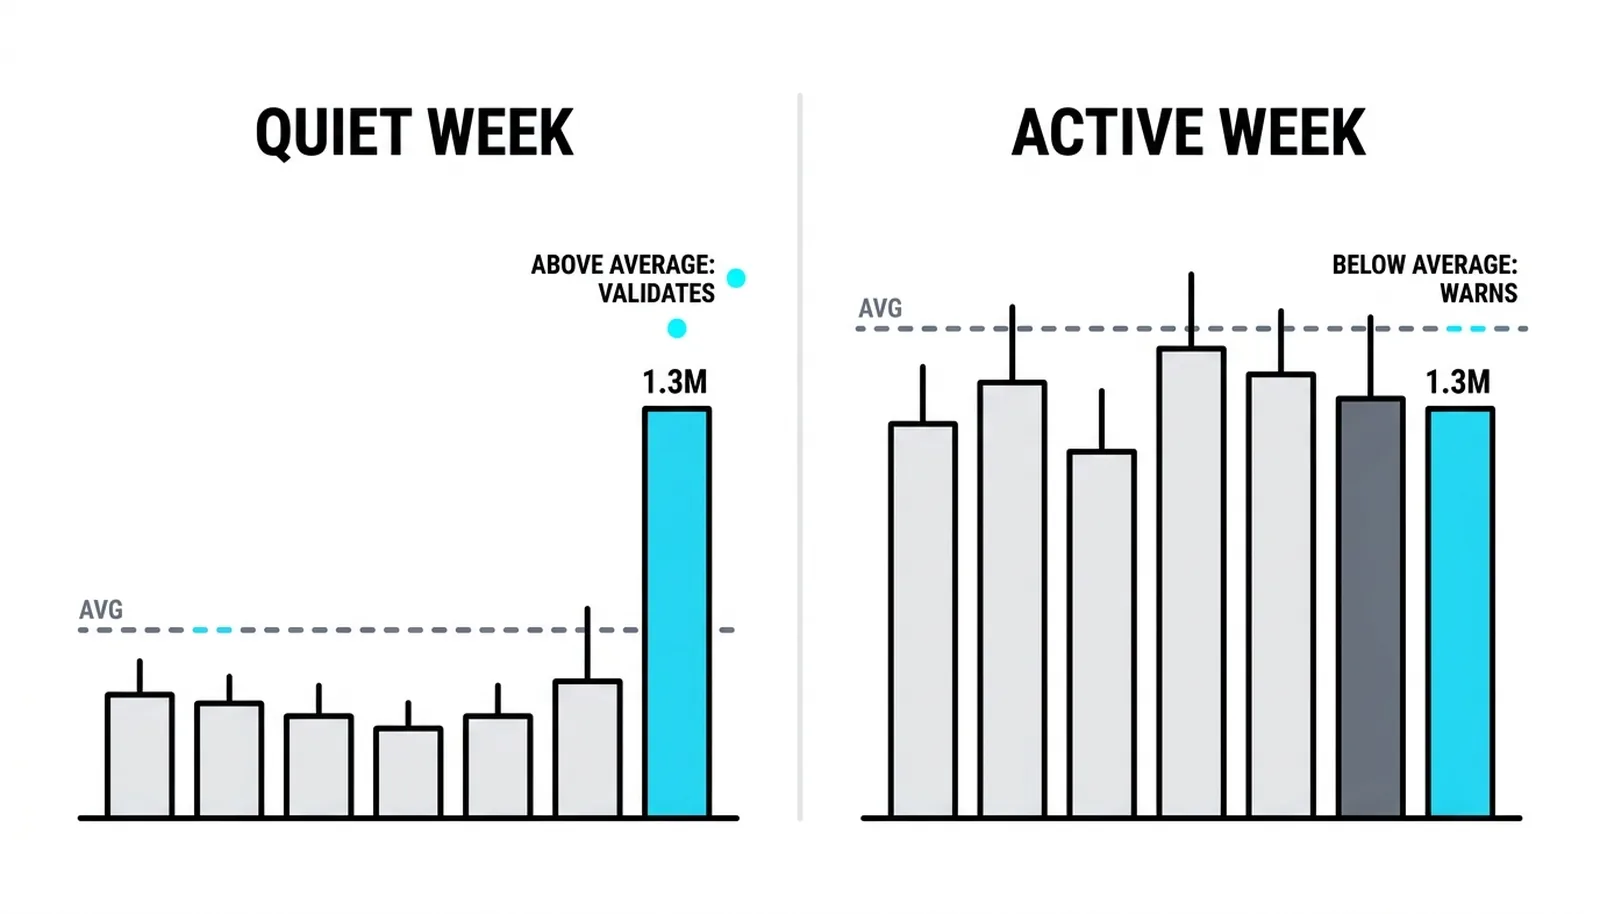
This is why the volume bars at the bottom of your chart are a history to read, not a score to beat. You read them backward from the signal bar: what did participation look like over the last twenty or thirty sessions? Where does today's bar sit against that baseline? A breakout on volume that is merely average for a quiet stock may be exceptional. The same bar on a stock that has been trading heavily for weeks may be nothing at all.
Build the habit of checking three things before you accept any volume print as confirmation:
- The recent average. Roughly the last twenty sessions is a working baseline many traders use, but even a visual scan of the bars gives you the texture.
- The trend of volume itself. Rising participation over weeks changes what "normal" means. A stock warming up deserves a different yardstick than a stock going quiet.
- The specific day in context. A session after major scheduled news will naturally trade heavy. A midsummer afternoon will not. Judge the bar against what the day could reasonably produce.
Context also decides what the same print means. A huge volume bar early in a fresh breakout validates the move. The same bar after a long, extended run can mark a climax, the last burst of buying before exhaustion. Location in the trend, position at a level, distance traveled: these decide which reading applies. The volume bar alone never decides.
Let the Market Sign First
A signal is a hypothesis until the market confirms it, and the confirmation takes time you must be willing to give. Volume price analysis describes an early mistake of entering the moment a pattern appeared, then watching price continue past the signal candle and through the stop. The pattern was real. The timing was the error. The market had not yet signed the document.
The discipline is simple to state and hard to practice: let the market prove the claim before money goes on. For a breakout, that means waiting for the volume expansion on the break, not anticipating it from inside the range. For a reversal, it means watching the new direction attract participation across more than one bar. For a pullback entry, it means seeing the volume dry up on the dip and then expand again as price turns back with the trend.
Yes, waiting costs you a few ticks of entry price. That cost is the premium you pay for evidence, and it is cheap compared to the cost of acting on unvalidated claims. Traders who consistently enter early are not more skilled. They are paying for information they do not yet have.
The second caution pairs with the first: confirmation is judged in context, never in isolation. A volume print that validates a breakout at a well-tested resistance level means something different from the identical print appearing after price has already run far from any structure. Always ask where the signal sits in the larger chart before you ask what the volume says about it.
The Flag at 63.40
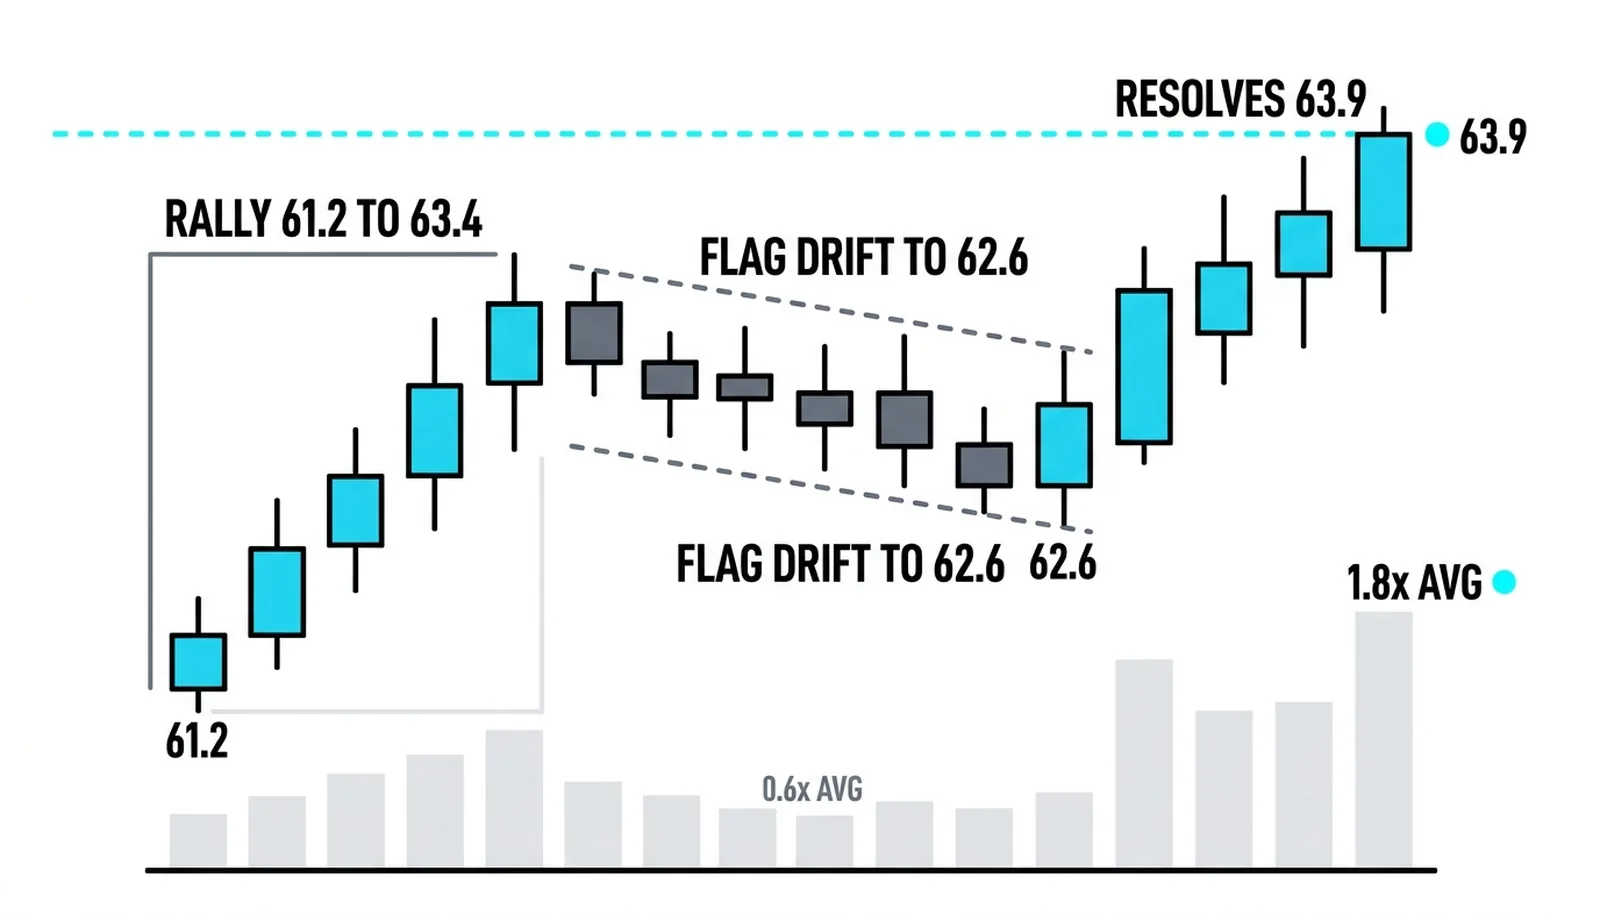
Here is a fully hypothetical illustration with round numbers. A stock rallies from 61.20 to 63.40 over several sessions, and each up day prints volume larger than the last, building to roughly 1.5 times the recent average. The rally is validated: expanding participation agrees with rising price.
Then price stalls and drifts sideways to slightly down, easing back to 62.60 in a small flag. Volume on those sessions dries up to roughly 0.6 times the average. This is exactly what a healthy pause looks like. The quiet flag says sellers are not pressing; holders are simply sitting, and the few transactions happening lack conviction in either direction. Shrinking volume on the pullback validates the flag as a rest rather than distribution. If large holders were unloading, you would see the volume to prove it.
Now the resolution. A session closes at 63.90, above the flag and above the prior high, on volume of 1.8 times the recent average. The breakout claim and the participation evidence agree. The continuation is validated, and a trader who waited for this bar has both the signal and the signature.
Compare the anomaly version of the same chart. Same rally, same flag, but the breakout session closes at 63.90 on only 0.7 times average volume, then fades back to 63.10 by the close of the following day. Price made the same claim. Volume refused to sign. The trader who entered on the pattern alone bought a document with no seal, and the market treated it accordingly.
| Price action | Validating volume | Anomalous volume | The read |
|---|---|---|---|
| Rally 61.20 to 63.40 | Expanding to ~1.5x average | Flat or falling volume on the rise | Validated trend versus a hollow climb |
| Flag drifting to 62.60 | Drying to ~0.6x average | Heavy volume on the down drift | Rest versus hidden distribution |
| Breakout close at 63.90 | ~1.8x average on the break | ~0.7x average on the break | Confirmed continuation versus a trap |
| Day after breakout | Holds above 63.40 on steady trade | Fades back into the flag | Acceptance versus rejection of new prices |
Notice that every stage had a volume answer, and the answer only made sense against the stock's own recent history. The 1.8x print validated because it stood clearly above the baseline this stock had set. On a different instrument with heavier recent trade, the same ratio might have meant nothing.
Confirming Price Action, Answered
What does it mean to confirm price action with volume?
It means treating every chart signal as a claim and requiring trading activity to back that claim before you act. The pattern proposes, and volume disposes. A breakout, reversal, or pullback earns your trust only when participation behaves the way genuine interest should behave: expanding on moves with the trend, shrinking on pauses against it, and surging through levels that matter.
What is an anomaly in volume analysis?
An anomaly is any case where volume does not behave the way the price action suggests it should, and it functions as a warning rather than a trade signal. New highs on falling volume, drifting candles on near-zero trade, a giant volume bar that price ignores: each tells you the picture is incomplete. The correct response is patience and doubt, not an immediate position in the opposite direction.
How much above average is confirming volume?
There is no fixed threshold, because the bar is judged against the instrument's own recent history. As a working guide, a breakout printing one and a half to two times the recent average shows clear commitment, while anything near or below average fails to confirm. The same absolute figure can validate one week and mean nothing the next, so always measure against the last twenty or so sessions of that specific chart.
Can volume confirmation fail?
Yes, and accepting that keeps you honest. A fully validated breakout can still fail when broad conditions shift or when large players use the surge of public buying to exit their own positions. Confirmation raises the odds that a signal is genuine; it never guarantees an outcome. That is why position sizing and exits remain non-negotiable even on the cleanest validated setups.
Once this validated-or-anomalous question becomes automatic on every chart, the next lessons in this block apply it where it earns the most: breakouts, reversals, and the false breakouts designed to catch traders who never asked for the signature.