The Golden Zone: 61.8 to 78.6
The golden zone is the band between the 61.8 and 78.6 percent retracement levels. It is the deepest stretch a healthy pullback usually reaches, and it is the area where the toolkit's most watched reactions cluster, because it is far enough into the leg to be cheap and close enough to the extreme to still count as a pullback.

Think of it like a baseball strike zone: the band the pitcher must hit, wide enough to matter and narrow enough to be judged. The earlier lessons introduced the deep pair of ratios and measured the pullback itself. This lesson joins them into a single band and explains why the band outperforms the line.
Why a Band Beats a Line
A single line asks the market to be precise. The market is not precise.
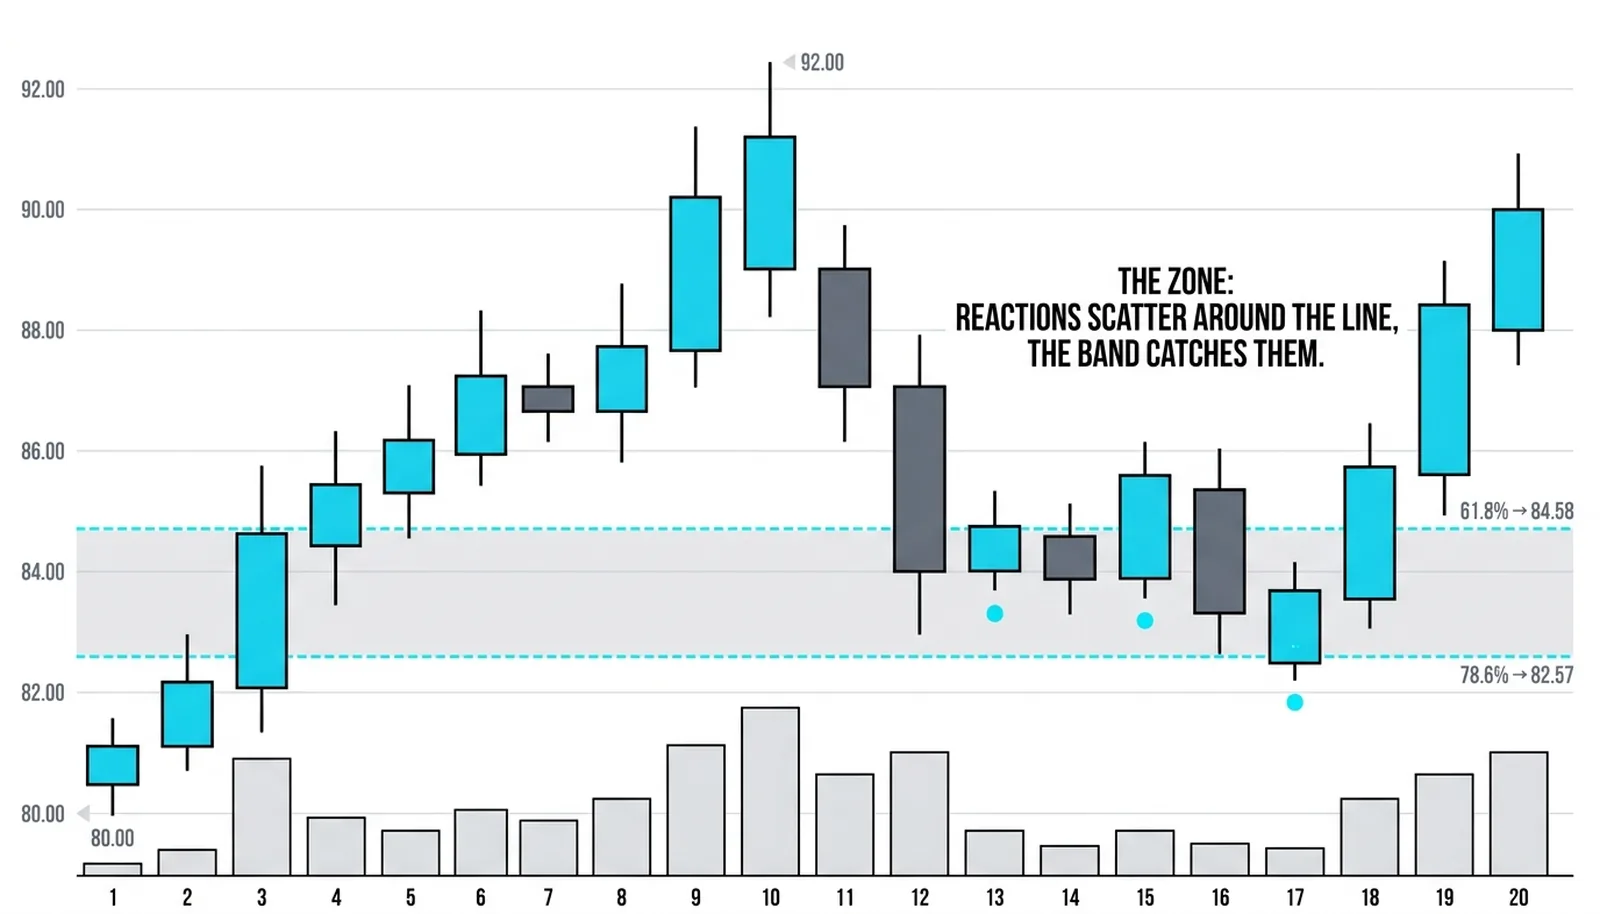
Reactions scatter around a level. Wicks overshoot it by a few ticks. Two platforms compute the same retracement from slightly different swing extremes and land on slightly different numbers. If the plan hangs everything on one line, those small differences become large frustrations.
The better read treats the 61.8 and 78.6 lines as the walls of one area. Inside that area, three things overlap.
- The deepest ordinary pullback of a confident trend, the last discount a strong leg typically offers before resuming.
- The last prices before the prior swing point itself comes under threat, which concentrates attention.
- The stop density of everyone who bought the leg, whose exits cluster in the same stretch and add fuel to any reaction.
That overlap is why reactions inside the zone tend to be sharp when they come at all. The buyers defending the trend, the sellers taking profits into depth, and the trapped longs exiting all act in the same narrow band. The cluster method treats the deep retracement area exactly this way, as a zone where the reversal-versus-pullback question gets answered, not as a magic line.
The zone also fixes a timing problem. A trader waiting for one exact line either gets skipped when price turns early or gets run over when price slices through. A band gives the plan room to work without giving up structure.
The Two Walls and What Each Defends
The two boundaries of the golden zone carry different meanings, and treating them as interchangeable is a common mistake.
The 61.8 wall is the line the trend is expected to defend. A confident trend usually holds at or above it. When price enters the band and stalls near the top wall, the pullback looks ordinary and the trend looks intact.
The 78.6 wall is the last honest defense. Below it, the pullback stops reading as a pullback and starts reading as something worse. The deeper price travels inside the band, the more the burden of proof shifts to the buyers.
This makes a close beyond the zone's far wall one of the most informative single events the toolkit produces. A wick through the wall is noise. A close through it announces that the discount was rejected, the dip buyers were overwhelmed, and the prior swing point is now the question.
Read the band as a gradient, not a switch. Top of the zone, trend healthy. Middle of the zone, trend on trial. Bottom of the zone, trend one close away from a formal challenge. That gradient is what gives the zone its practical edge over any single ratio.
Trading the Zone
The trade has three parts, and each part comes from the structure rather than from hope.
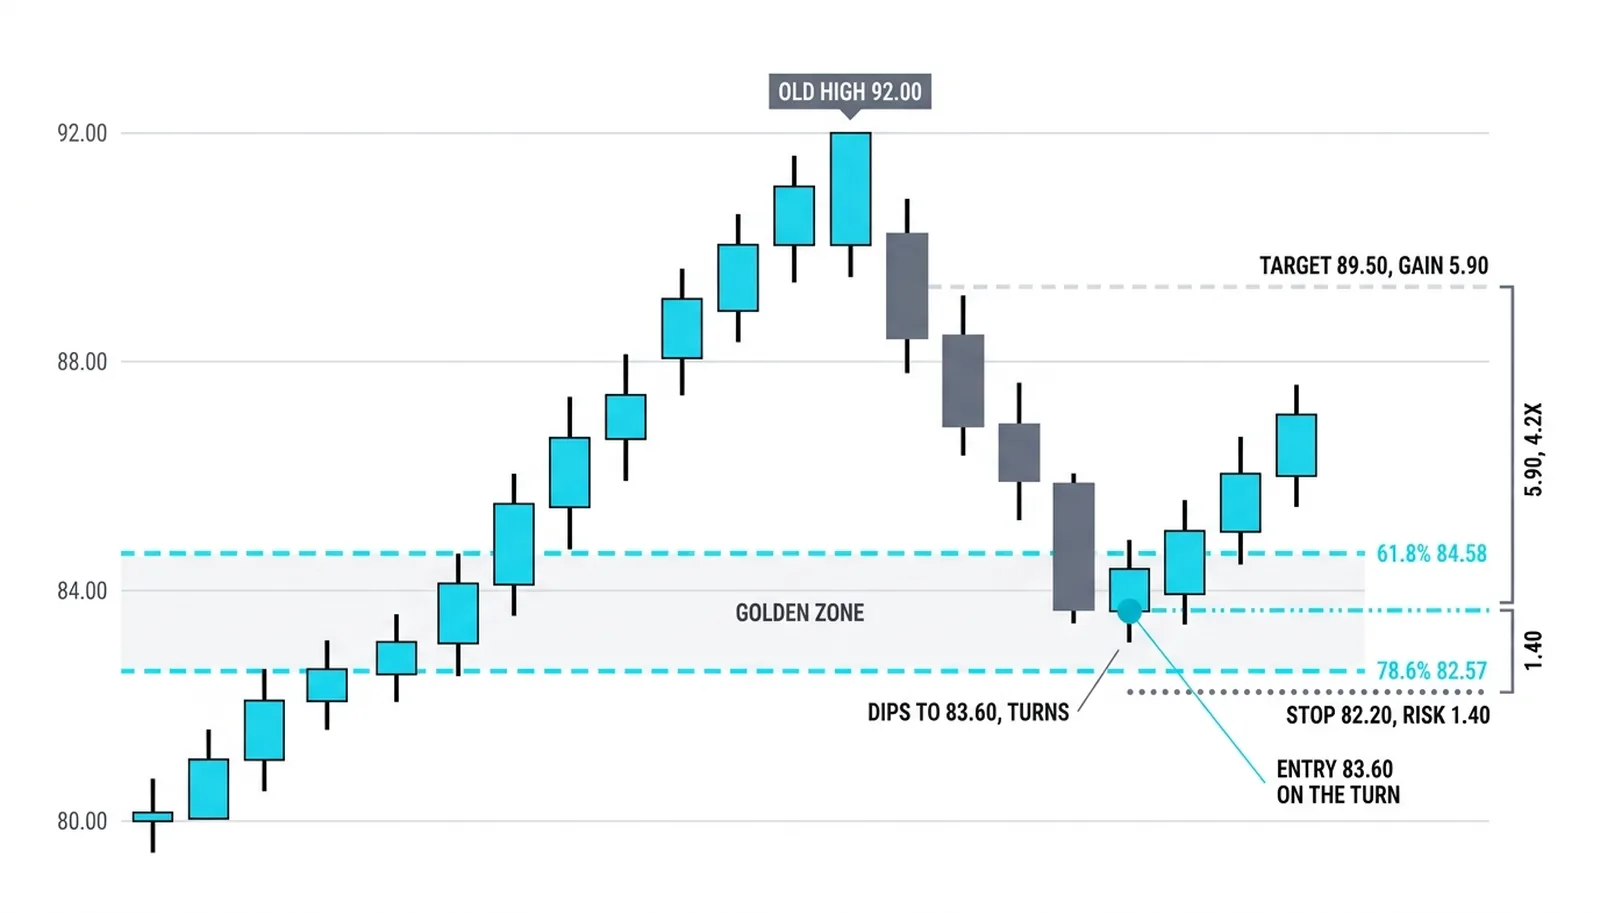
Entry. Do not buy the touch. Wait for price to enter the zone and then turn: a rejection wick, a strong close back up, a shift in the lower-timeframe structure. The turn confirms that the overlapping interest inside the band is actually acting. Entering on the turn costs a worse price than entering on the touch, and it buys information worth more than the difference.
Stop. The stop belongs beyond the far wall, past 78.6, not inside the zone. A stop inside the band dies to ordinary noise in the exact area where noise is guaranteed. The far wall is where the trade idea is proven wrong, so that is where the exit belongs.
Targets. Work back up the leg. The first target sits below the old high, not at it, because supply often waits just under the prior extreme. Ambitious targets can extend past the high only after the first target pays and the stop has moved.
One rule overrides the rest: size smaller than a shallow-retracement trade. The deepest zone is where the trend is most on trial. The reward-to-risk is often excellent, and the win rate is lower than at the 38.2 or 50 area. Smaller size matches the trade to its actual probability.
The zone is where the decision happens, not where the outcome is owed.
The Turn at 83.60
A hypothetical example with round numbers shows the full mechanics.
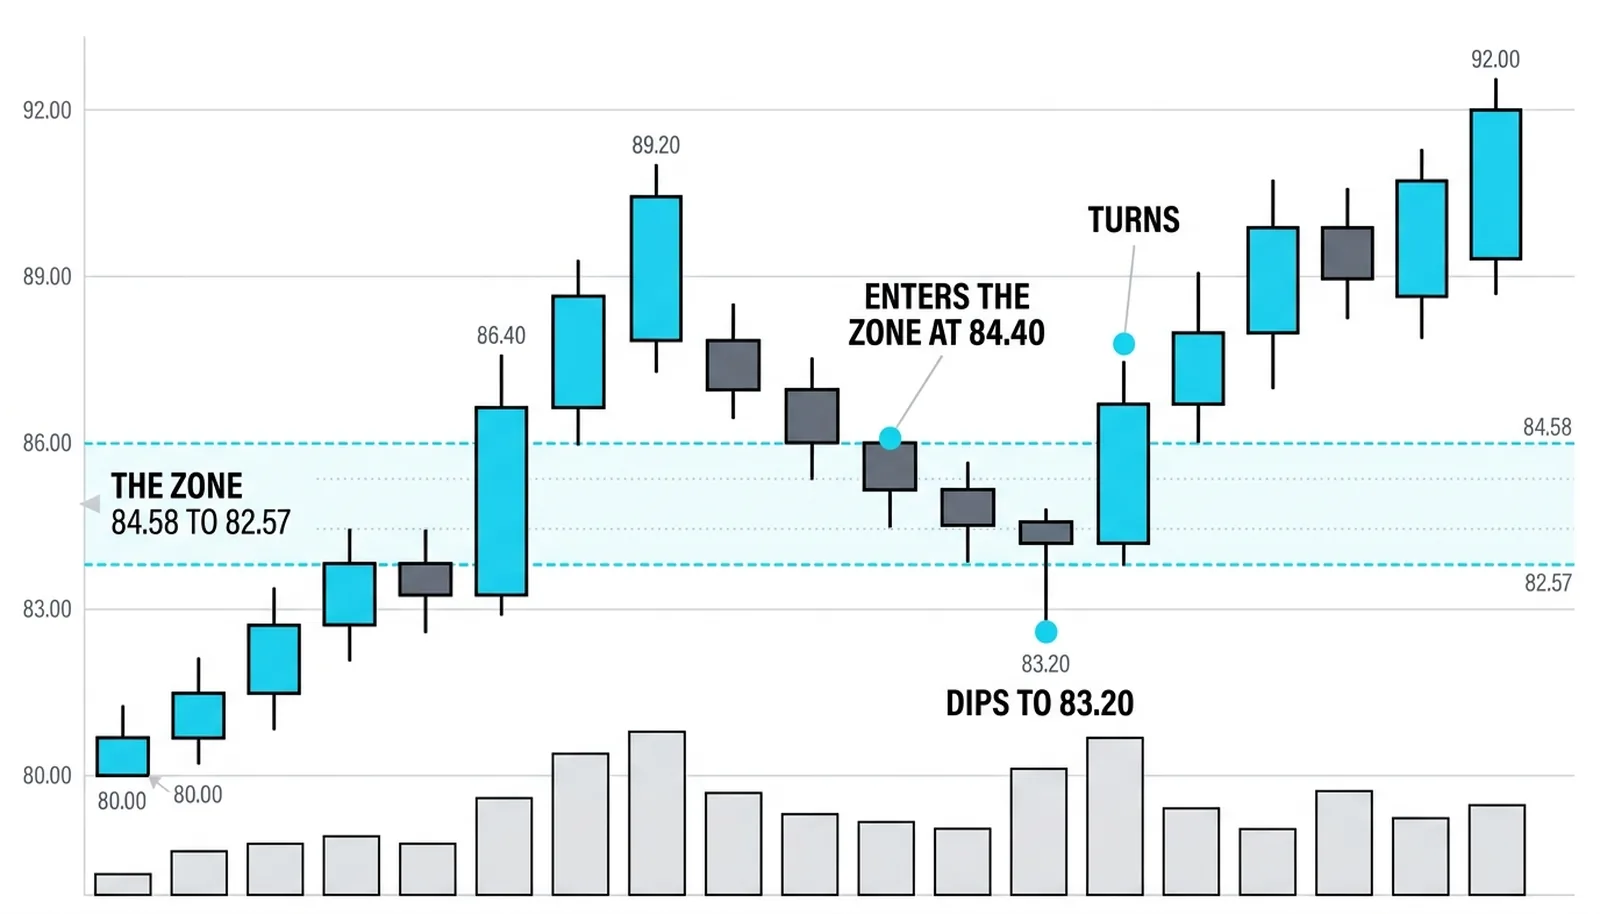
A leg runs 12.00 points, from a swing low at 80.00 to a swing high at 92.00. The golden zone spans 84.58 at the 61.8 wall down to 82.57 at the 78.6 wall.
Price pulls back and enters the zone at 84.40. It dips to 83.20 inside the band, prints a rejection, and turns. The long is taken at 83.60 on the turn. The stop sits at 82.20, below the far wall, risking 1.40. The first target is the mid-80s shelf at 89.50, just under the old high, a gain of 5.90. That is about 4.2 times the risk.
Now the failed version. Price enters the zone, keeps sliding, and closes at 81.90, below the far wall. The band converts from opportunity to warning in a single close. There is no trade and no argument. The watch moves down to the swing low at 80.00, which is now the level the entire structure depends on.
Both outcomes came from the same zone. The difference was the close relative to the far wall, which is exactly the distinction the band exists to measure.
| Price reached | Zone read | Probability story | Response |
|---|---|---|---|
| 84.40, enters the zone | Pullback is now deep enough to matter | Trend still favored, attention required | Watch for a turn, no entry yet |
| 83.20, dips and turns | Buyers acting inside the band | Ordinary deep pullback, odds favor resumption | Enter on the turn at 83.60 |
| 82.57, the far wall | Last honest defense | Trend on trial, one close from a formal challenge | Hold only while the wall holds, stop beyond it |
| 81.90, close below the zone | Band converts to warning | Pullback reading shifts toward reversal | Exit, move the watch to the 80.00 swing low |
Golden Zone Questions, Answered
What is the golden zone in Fibonacci retracement?
The golden zone is the band between the 61.8 and 78.6 percent retracement levels of a prior leg. It marks the deepest stretch a healthy pullback usually reaches, where the trend's strongest discount and its last honest defense sit side by side.
Why is the 61.8 to 78.6 area powerful?
Because three forces overlap inside it: the deepest ordinary pullback of a confident trend, the last prices before the prior swing point is threatened, and the clustered stops of everyone who bought the leg. When reactions come, that stacking makes them sharp.
Should you enter at the top of the golden zone or the bottom?
Neither, by default. Enter on the turn, wherever inside the band the turn appears. A turn near the top wall signals a strong trend; a turn near the bottom wall still works but carries more risk, and the sizing should reflect that.
What if price falls through the golden zone?
A close beyond the 78.6 wall converts the band from opportunity to warning. Exit any position built on the pullback idea, and shift attention to the prior swing point, because that low or high is now the level the whole structure depends on.
The coming lessons map how the shallow lines, the halfway line, and the deep band divide the work of reading any pullback.