The 50 Percent Level in Fibonacci
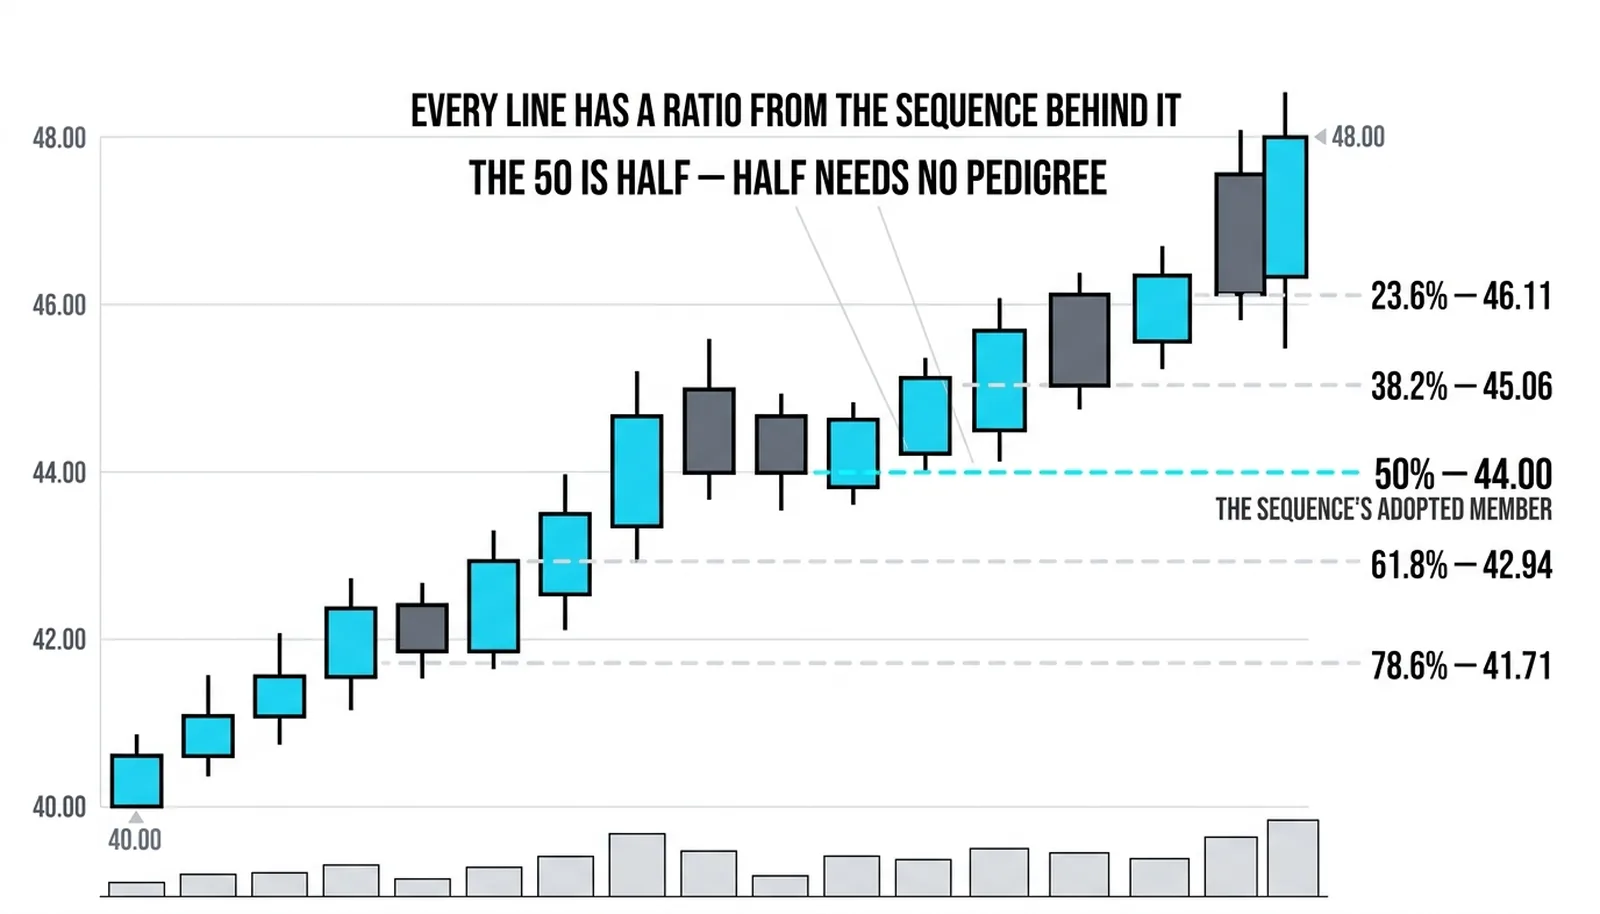
The 50 percent retracement is the halfway point of the prior leg, and it is not a Fibonacci ratio at all. No number in the sequence's ratio family produces it. Divide any Fibonacci number by the one two places ahead and you approach 38.2 percent; divide by the next and you approach 61.8 percent; nothing in the sequence yields a clean half. Yet the midpoint matters more than almost any true ratio, because it is the market's most natural reference, the level the classical Dow theory half-way principle watched, the line every charting platform draws by default, and the boundary that divides a routine pullback from a questioning one.

Think of the halfway line on a soccer pitch: it is not a scoring line itself, yet every formation orients by it the moment possession changes. The midpoint of a price leg works the same way. It scores nothing on its own, but both buyers and sellers organize around it. The ratios lesson listed the 50 alongside the true Fibonacci levels and owed an explanation for that. This lesson pays it: why a number that is not a ratio ended up in every tool's set, and why traders refuse to remove it.
Why a Non-Ratio Anchors Every Chart
Three forces converge at the midpoint, and none of them require the Fibonacci sequence to be true.
The first is the arithmetic itself. Half of a leg surrendered is the natural dividing line between confirmation and doubt. A trend that gives back a third of its advance barely blinked. A trend that gives back half has done something meaningful: the average buyer of the whole move is now at breakeven, and the average seller is sitting on profit. That symmetry needs no mystical sequence. It is the arithmetic of position, and every participant feels it whether or not they know the word Fibonacci.
The second force is the round-number effect. Many instruments trade near whole numbers, and a leg that runs between round prices tends to put its midpoint on or near another round price. When the 50 percent line and a round price land together, two crowds watch one level: the retracement traders and the round-number traders. Confluence of that kind thickens the order flow at the line, and thick order flow produces visible reactions.
The third force is platform adoption. Every retracement tool draws the 50 whether the user asks for it or not. That single design decision means every participant sees the midpoint, and a level everyone sees is a level everyone reacts to. Reactions cluster there because the watching is universal, not because the number carries inherited power.
The cluster method treats the half-way point exactly this way: a level the market respects for its position rather than its pedigree. That framing is the honest one. The 50 works because it is central, round-adjacent, and universally drawn. Strip any one of those away and the line weakens. All three together make it the most-watched non-ratio on the chart.
The Half-Way Principle
Classical Dow theory observed the behaviour long before Fibonacci tools existed. The half-way principle in classical Dow theory held that a trend which corrects roughly half of its prior advance remains a trend. The correction is digestion, not reversal. Only when the give-back runs well past the half does the trend itself come into question. That observation, made on rails and industrials, still describes how pullbacks behave on any liquid chart.
The price action canon arrives at the same zone from the price-action side. The tape-reading framework's read of corrections is that they tend to unfold in two legs, and two-legged corrections tend to finish near the middle of the prior move. The first leg down shakes out weak longs, the bounce invites the hopeful back in, and the second leg down tests whether genuine sellers remain. When that second leg stalls around the midpoint, the correction has usually spent its fuel.
Put the two observations together and a practical band emerges. Pullbacks die in the 50 to 62 percent area far more often than they die at any single line. The 50 is the front edge of that band and the 61.8 is the back edge. Treating the midpoint as a zone opener rather than a razor line matches how price actually behaves: it overshoots, probes, and then decides.
Depth above the midpoint reads as shallow confirmation. Depth below it reads as deep strain. Those two readings are the subjects of the next two lessons, and both are graded against this line.
Trading the Midpoint
The trade at the 50 is a turn trade, not a touch trade. Price arriving at the line is information; price turning at the line is the signal. The distinction matters because midpoints get probed constantly, and buying the first touch means buying every probe, including the ones that keep falling.
The standard construction has three parts:
- The entry comes after the turn shows itself: a rejection tail, a strong close back above the line, or a higher low forming just beneath it. Entering on that evidence costs a few ticks of price but buys confirmation.
- The stop sits below the line, far enough to survive the probe but close enough to keep risk defined. If the midpoint fails, the trade idea is wrong and the exit should be immediate.
- The target is the prior extreme, or just in front of it. A pullback that holds at the half is, by the classical half-way principle, a trend continuing, and a continuing trend retests its old high or low.
The warning side deserves equal weight. A close below the 50 percent line is the first evidence that the correction is more than routine. Not proof, but evidence. The proper response is to withdraw the shallow read and hand the watch to the next level down, which is usually the 61.8. If the 61.8 also fails, the pullback has stopped being a pullback.
Be blunt about the limits. The 50 is a reference, not a force. The line holds because enough traders watch it, and when they stop watching, the line says nothing. No level on a chart has ever owed anyone a bounce.
The Hold at 84.00
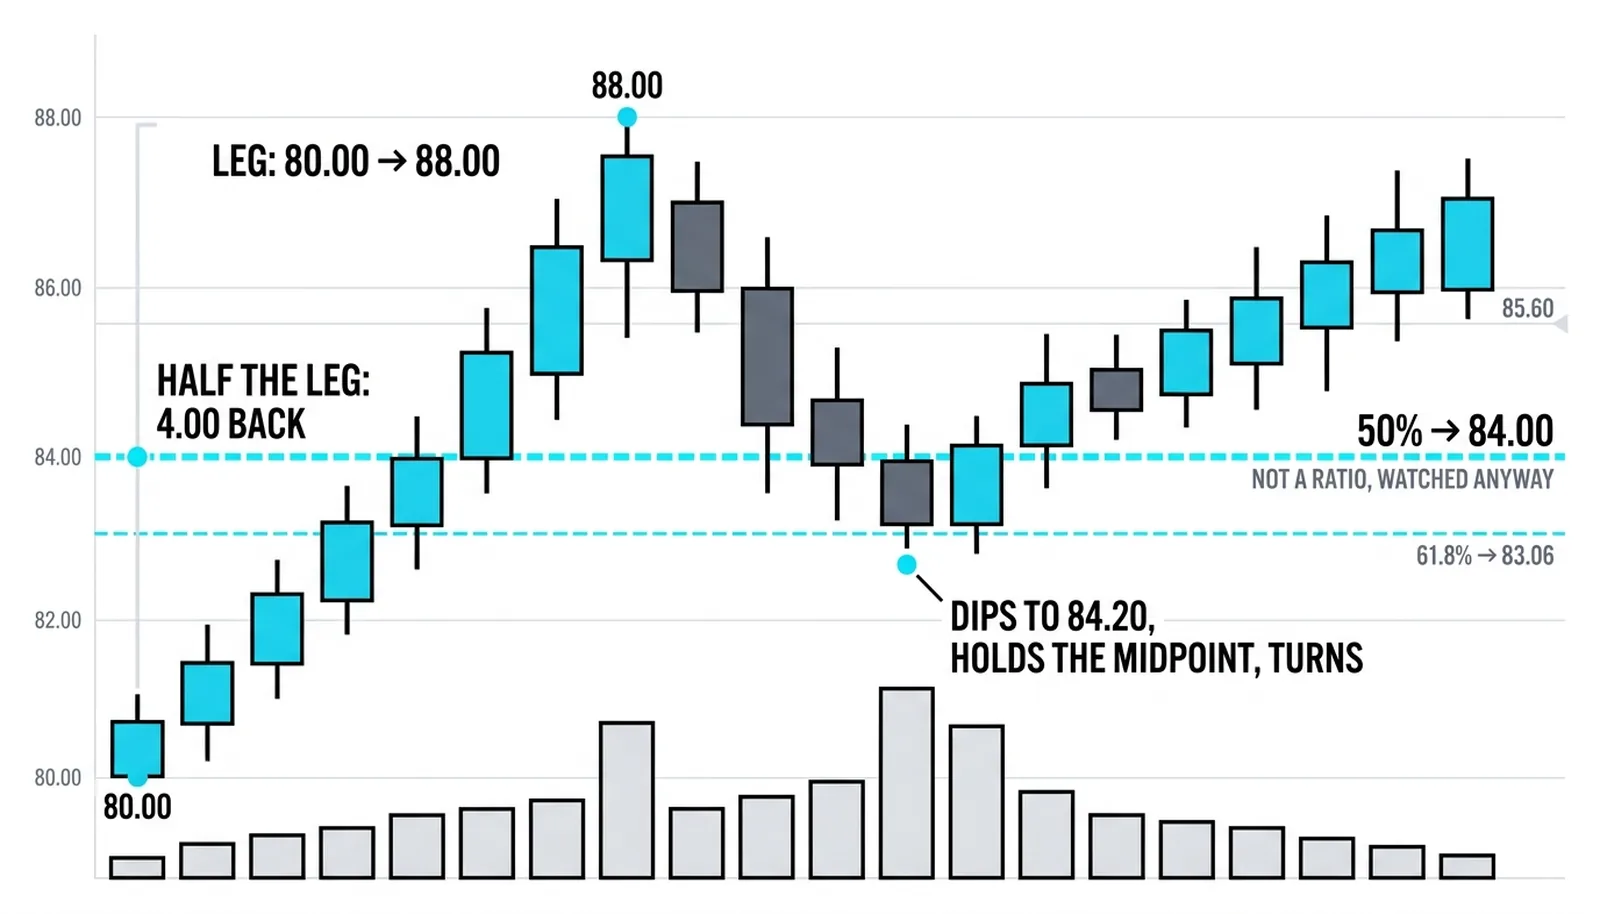
A hypothetical illustration with round numbers. A leg runs 8.00 points, from 80.00 up to 88.00. The 50 percent line lands at 84.00, and the 61.8 line sits at 83.06 beneath it.
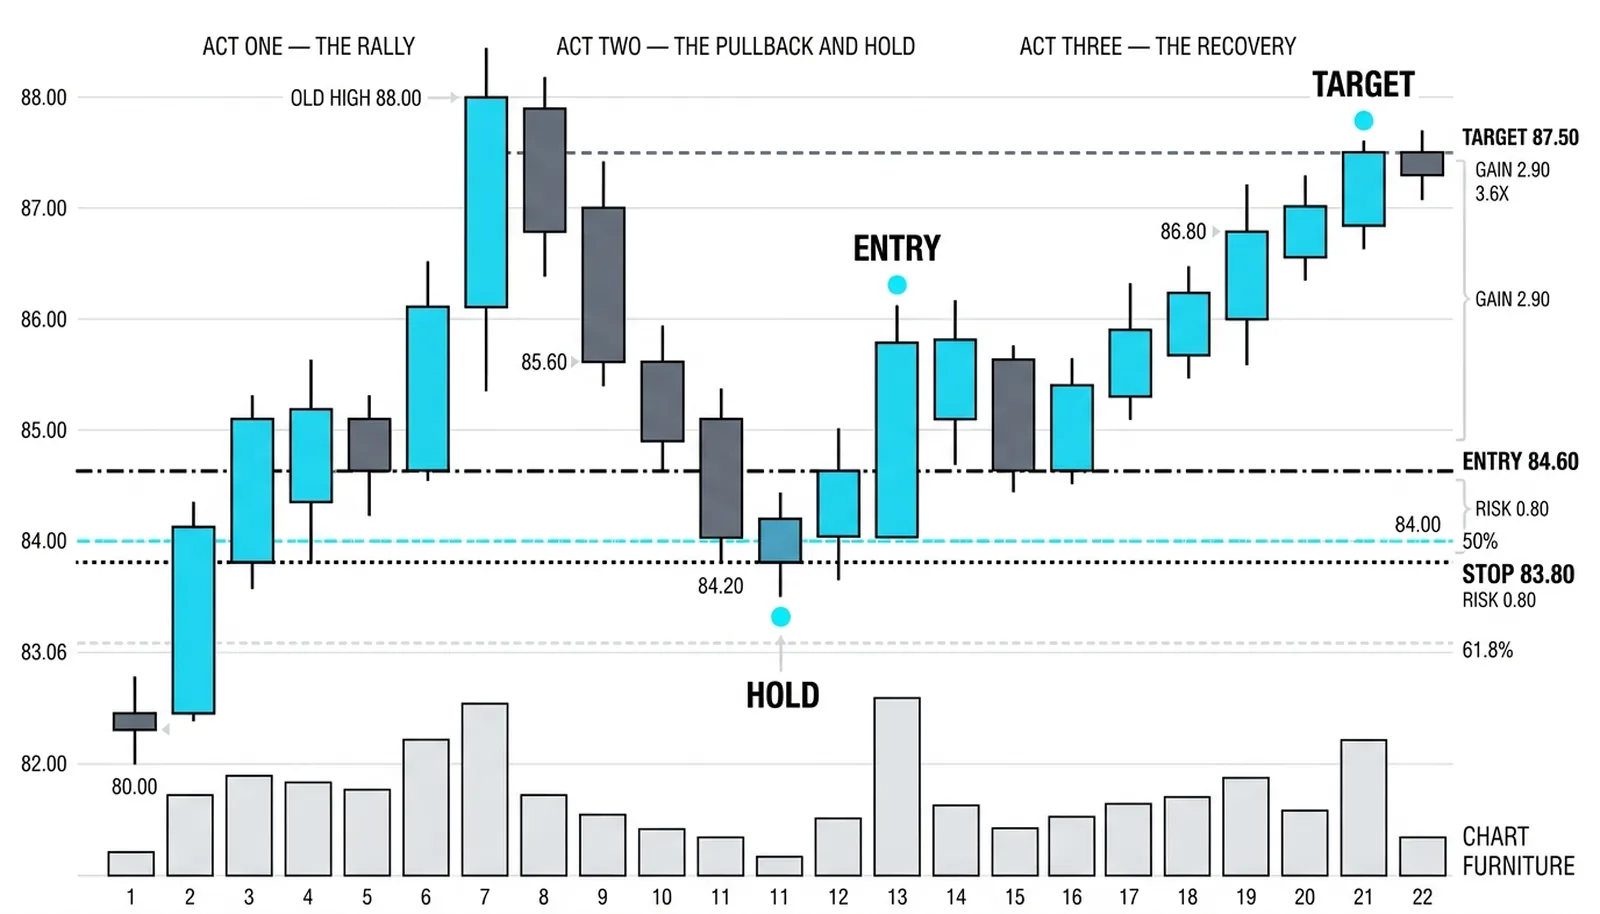
Price sags off the high and drifts into the midpoint. It dips to 84.20, finds buyers, and turns with a strong close back toward 84.60. The long is taken at 84.60 on that turn. The stop goes at 83.80, below the line and below the probe low, risking 0.80 per unit. The first target is 87.50, just under the old high, for a gain of 2.90. That is about 3.6 times the risk, a clean reward profile built entirely off one reference line and one turn.
Now the failed version. Price reaches 84.00 and does not turn. It closes at 83.60, below the midpoint. The routine-pullback read is withdrawn on that close. The trade is either stopped at 83.80 or never entered, and the watch hands down to 83.06, where the 61.8 line gets its chance to prove the correction is still a correction. If 83.06 fails too, the leg from 80.00 is no longer the reference; the whole advance is in question.
| The Level | The Price | The Story It Tells | The Response |
|---|---|---|---|
| Prior high | 88.00 | The leg's extreme and the natural target | Take profit just in front of it, at 87.50 |
| 50 percent line | 84.00 | The midpoint; a hold here keeps the trend intact | Buy the turn at 84.60, stop at 83.80 |
| 61.8 line | 83.06 | The next defense if the midpoint fails | Hand the watch down only after a close below 84.00 |
| Leg origin | 80.00 | A return here erases the entire advance | Treat any approach as a trend failure, not a pullback |
Notice what the example did not require: any belief that 50 carries inherited power. The trade worked off position, symmetry, and crowd attention. That is all the midpoint ever offers, and it is enough.
50 Percent Level Questions, Answered
Is 50 a Fibonacci ratio?
No. No division within the Fibonacci sequence produces 50 percent; the true ratios cluster around 38.2 and 61.8. The 50 appears in every retracement tool because of the classical half-way principle, round-number gravity, and platform convention, not because of the sequence.
Why does the 50 percent level matter if it is not a ratio?
It matters because the midpoint is where the average participant of the prior leg sits at breakeven, which makes it the natural dividing line between a healthy correction and a threatening one. Universal platform adoption means every trader sees it, and levels everyone sees attract the order flow that produces reactions.
What does a bounce off the 50 percent level mean?
A bounce means the correction behaved the way the classical half-way principle describes: the trend gave back half, found buyers, and continued. It confirms the prior trend remains in force and typically sets up a retest of the old extreme, which is why the standard target sits just in front of that extreme.
What does a close below the 50 percent retracement mean?
A close below the midpoint is the first evidence the correction is more than routine, and it withdraws the shallow-pullback read. The watch then hands down to the 61.8 line; if that level also fails, the move should be treated as a potential reversal rather than a pullback.
The midpoint is now graded. The next lesson moves to the shallow side of it, the 23.6 and 38.2 lines, where a trend that barely gives back anything is telling you something different, and louder, than one that rests at the half.