Housing Data: Permits, Starts, Home Sales
Housing data is a family of releases covering the construction pipeline and the resale market: building permits, housing starts, and existing home sales. It earns its own lessons because housing is the most interest-rate-sensitive corner of the economy, and one of the earliest to turn when policy changes.

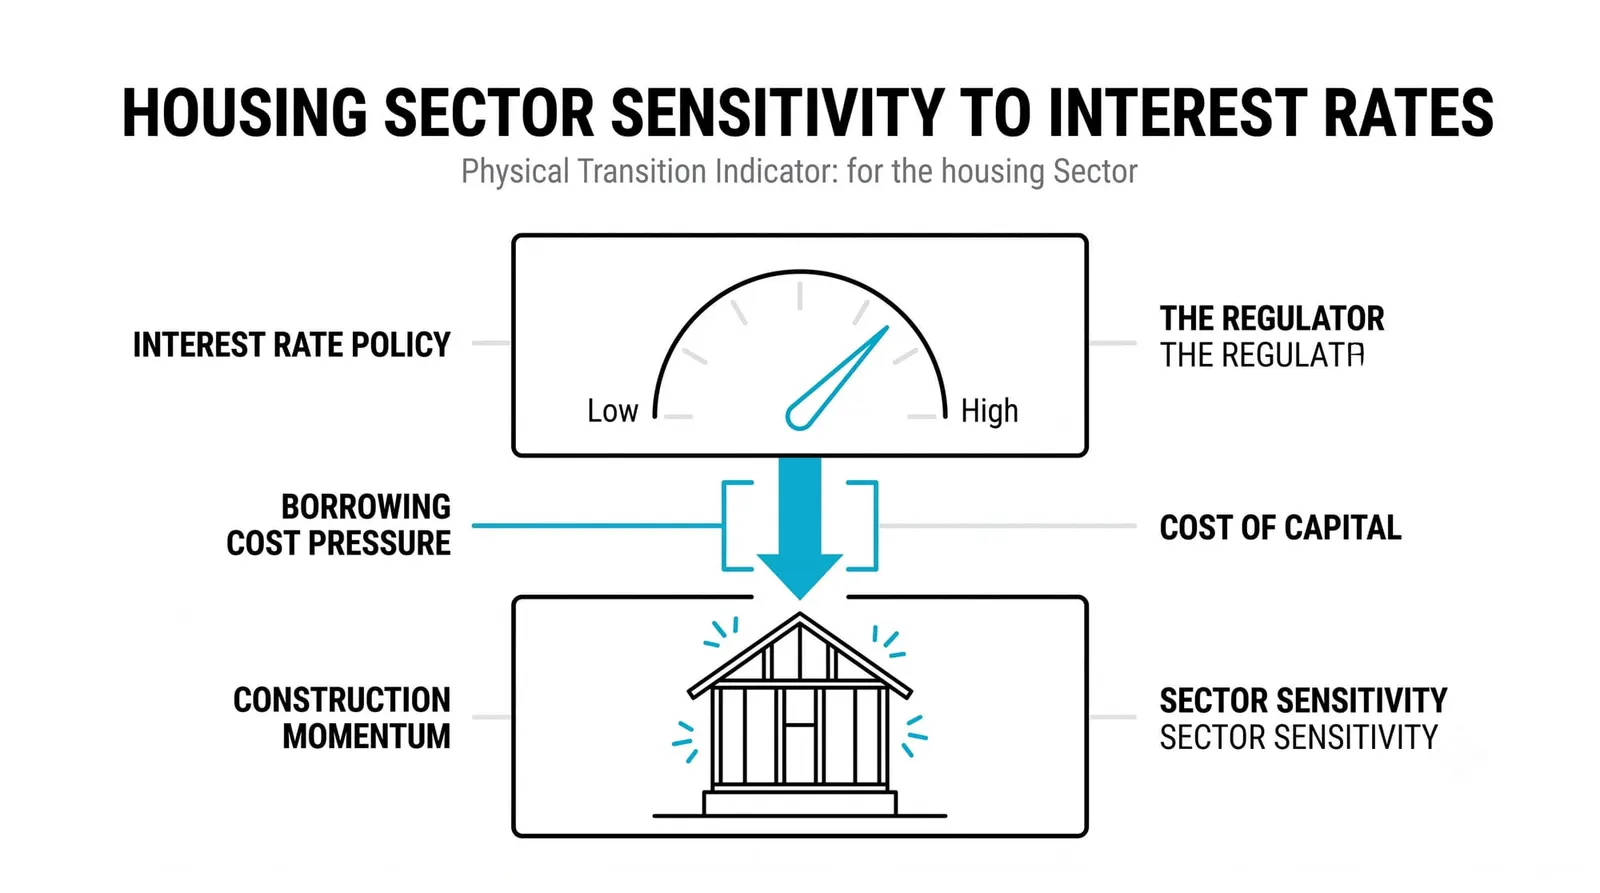
You already know how rate changes transmit through the economy. Housing sits at the front of that transmission because almost every home purchase is financed, so a shift in mortgage rates changes monthly payments immediately and reshapes demand within weeks.
Think of the housing pipeline as a row of dominoes: permits tip into starts, starts tip into construction jobs and appliance orders, and the whole chain runs slower than any other corner of the economy. That slowness is the gift. It gives you time to read each stage before the next one falls.
One more connection before the details. Residential investment is a component of GDP, which you covered in the previous lesson, so what happens in housing shows up in the growth numbers with a lag you can anticipate.
Building Permits: Reading the Earliest Signal
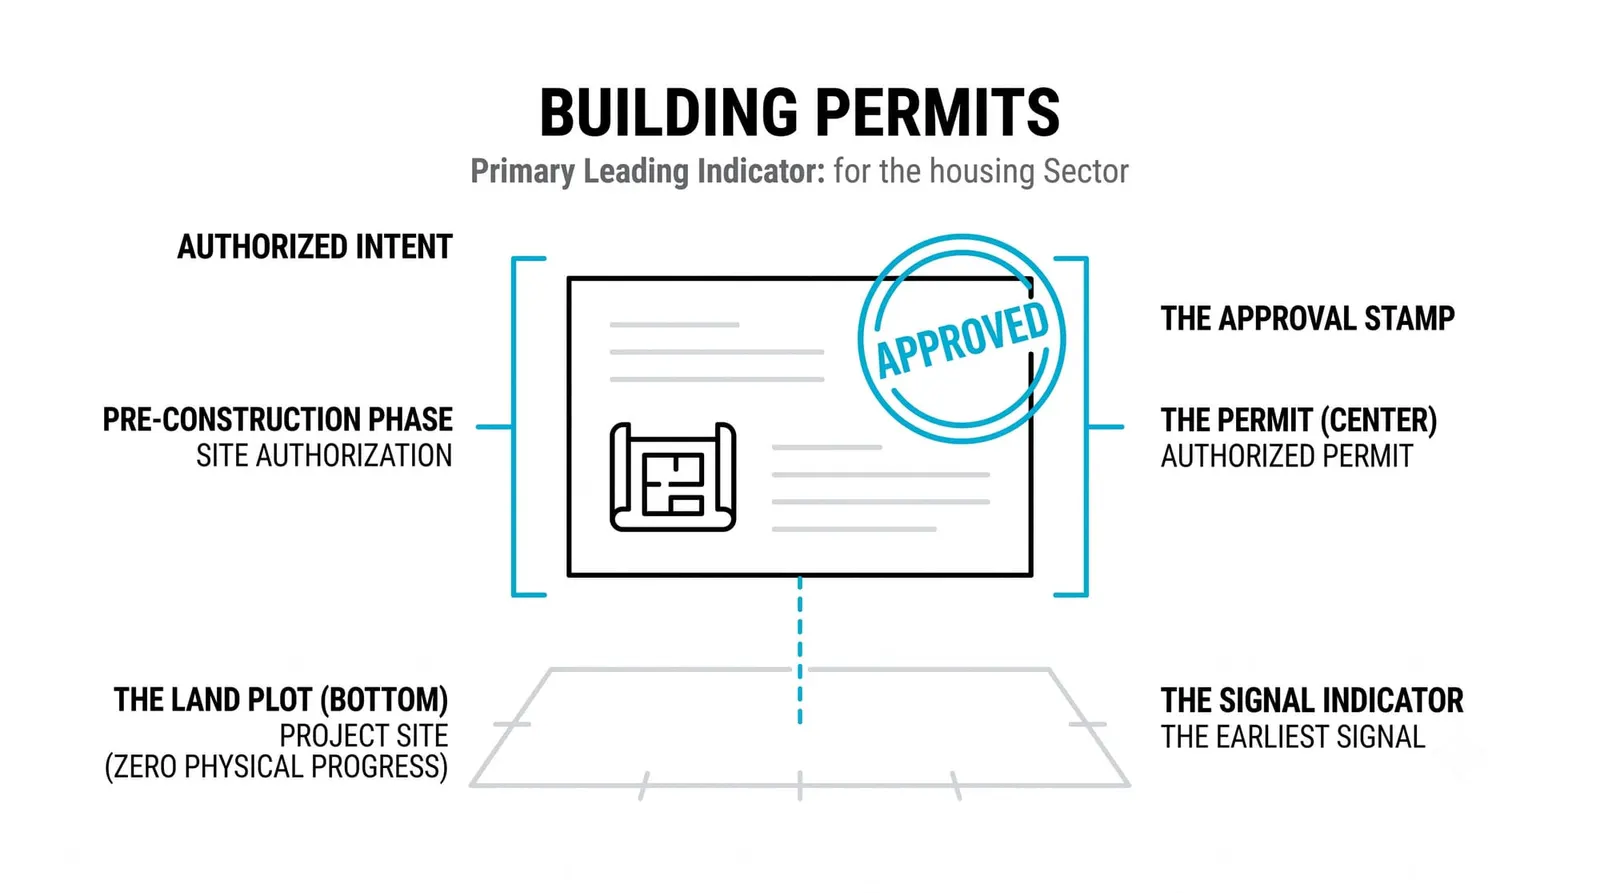
A building permit is permission, granted by a local authority before ground is broken. A builder who wants to construct a home files plans, pays fees, and waits for approval. Only then can work legally begin.
That sequence makes permits the forward-looking edge of the pipeline. A permit reflects a builder's intention, formed after weighing financing costs, expected demand, and input prices. When permits fall, builders are telling you they see weaker conditions ahead, months before that weakness appears in employment or output data.
There is a catch. A permit granted is not a house built. Some permitted projects stall when financing dries up or material costs spike. Others sit idle because the builder was stockpiling approvals during a strong period. So the gap between permits issued and projects actually started is itself information: a widening gap signals caution even when the headline permit count looks firm.
For a trader, permits are the first place a rate-driven slowdown or recovery shows up. Watch the trend over several months rather than any single print, because one month of permits can be swung by a handful of large multi-family projects.
Housing Starts: When Construction Actually Begins
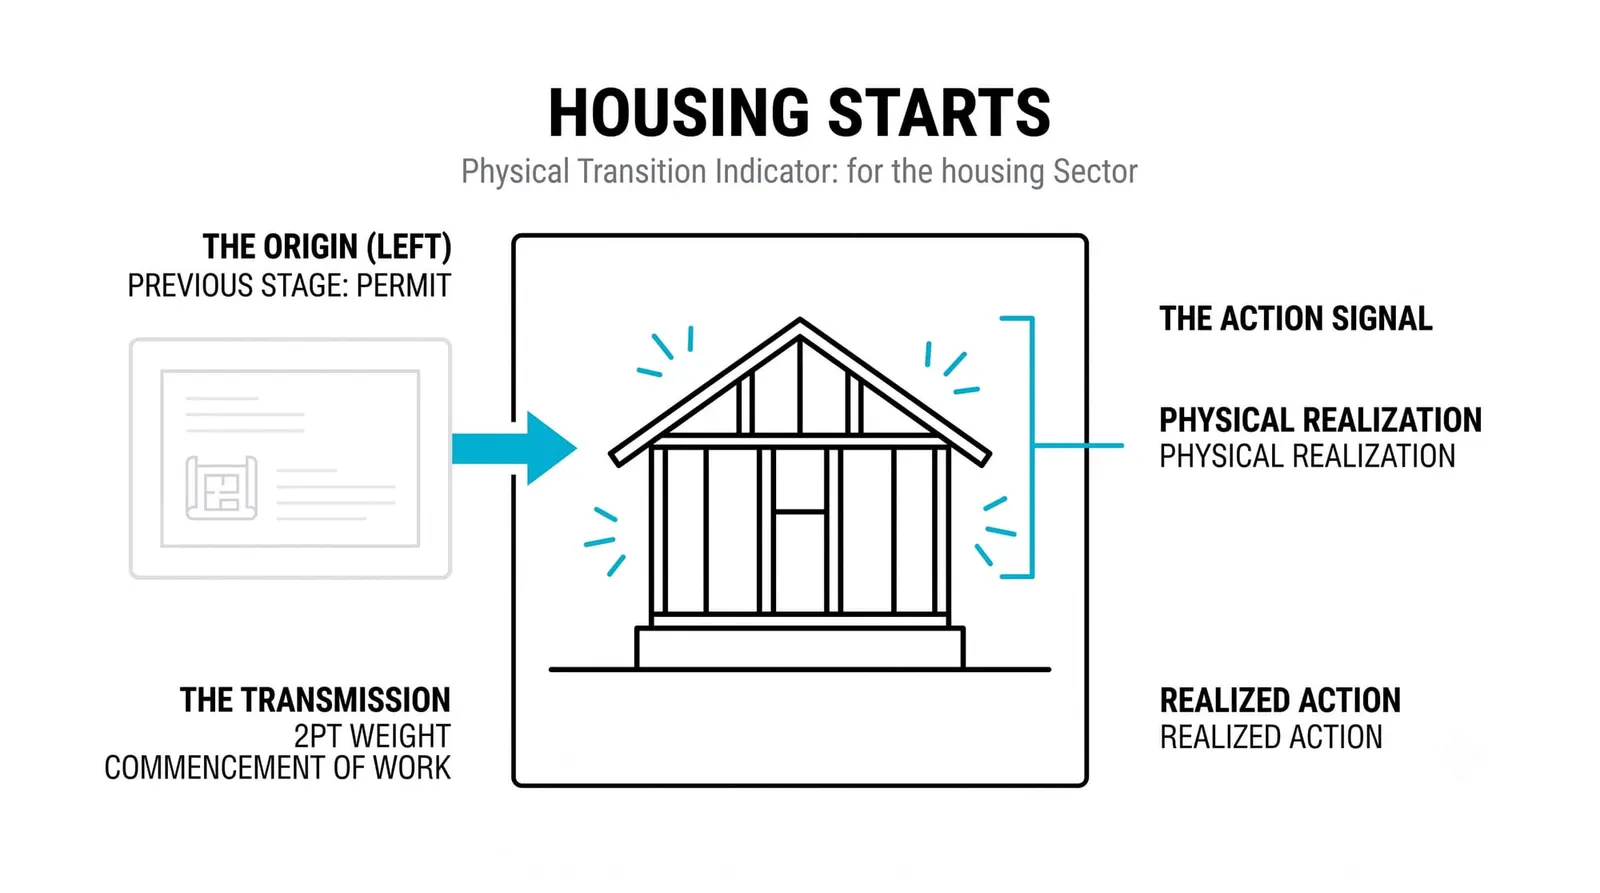
Starts measure ground broken. The permit existed, the financing held, and the crew showed up. This is the moment intention becomes economic activity, because a start triggers real spending on labor, lumber, concrete, and everything else a build consumes.
The single most useful split inside this release is single-family versus multi-family. They answer different questions. Single-family starts reflect household demand for owned homes, which tracks mortgage rates and buyer confidence closely. Multi-family starts, buildings of five units or more, reflect developer and investor decisions, and they arrive in lumpy chunks. One apartment complex can add hundreds of units to a single month's count.
Because of that lumpiness, the multi-family component is volatile and the headline starts number can mislead. A big month driven by apartment projects tells you little about the family-buyer market. Read the components, not only the total.
Weather and seasonality distort the series too. Construction slows in winter across much of the country, so the data is seasonally adjusted, but an unusually harsh or mild season can still throw the adjustment off. A weak January print after heavy storms deserves more skepticism than a weak print in calm conditions.
Existing Home Sales: The Bigger, Slower-Moving Market
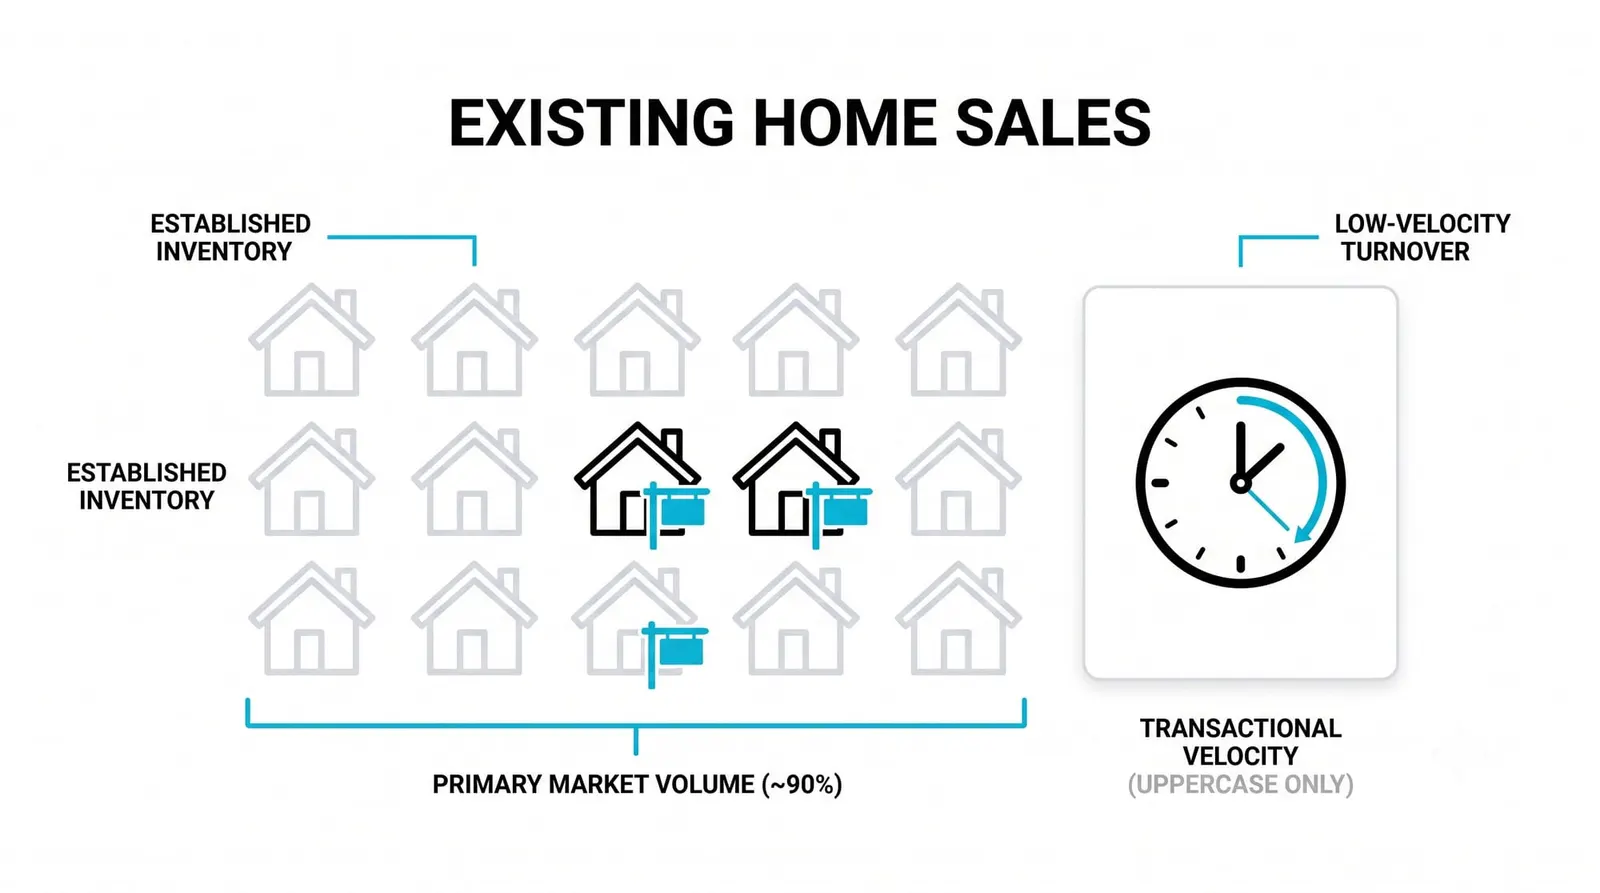
Resales dwarf new-home sales by volume. Most homes that change hands in any month were built years or decades ago, and the existing home sales series counts those closings.
The timing detail matters more than the size. The release counts closed transactions, and a closing typically happens weeks after the contract was signed. So the series reflects decisions made under mortgage rates from a month or two earlier. When rates jump, existing home sales keep printing strong numbers for a while, because the pipeline of signed contracts is still draining.
That lag makes existing home sales a confirmation tool rather than an early warning. If you want the forward edge of the resale market, look at pending home sales, which count contracts signed rather than closings completed. Pending sales turn roughly in line with rate moves; closings follow behind.
Inventory shapes this series too. When rates rise fast, owners holding cheap old mortgages refuse to sell and take on expensive new ones. Supply locks up. Sales volume can then fall hard even while prices stay firm, and the headline number understates how tight the market actually is.
Why Housing Data Matters for Rates and the Wider Economy
A finished home pulls a long tail of spending behind it. Construction employs crews directly, and a new household then buys furniture, appliances, and services for years. When starts fall, that whole tail shrinks with a delay, which is why housing weakness tends to precede broader softness in employment and consumption data.
The feedback loop to the central bank runs in both directions. When policy tightens, mortgage rates rise and housing cools first, which is partly the point of tightening. When policy eases, housing revives early and helps pull the wider economy up. Central bankers watch these series precisely because they show whether policy is biting where it should.
Traders use the same logic as a check on the rate path already priced in. If the market expects cuts and permits keep sliding, the data supports the pricing. If permits rebound while the market expects cuts, something has to give. You are not forecasting housing for its own sake. You are testing the rate story against its most sensitive witness.
One caution applies to all of it. These series are noisy month to month, revised, and seasonally distorted. Direction over a quarter tells you far more than any single release.
One Rate Hike, Three Series
Imagine a central bank lifts its policy rate by 1 percentage point across two quarters, in two half-point steps. Every number below is invented for illustration.
Mortgage rates climb quickly, say from 5 percent to 6.5 percent. Within weeks, builders recalculate. Permits, which had been running at a pace of 1,500,000 units a year in this example, slip to 1,350,000. Permits move first because they are pure intention, and intention changes the moment financing costs do.
Next quarter, starts follow. Projects already permitted get finished, but fewer new ones break ground, and starts drop from 1,400,000 to 1,200,000. Construction employment and materials orders soften behind them.
Existing home sales fade last. Contracts signed at the old 5 percent rates keep closing for a month or two, so the series holds near 4,500,000 before sliding to 3,900,000 as the old pipeline drains. Anyone watching only this series would have concluded, wrongly, that the hikes were not working.
Now run it in reverse. The central bank cuts by 1 percentage point over two quarters. Permits recover within weeks, starts follow a quarter later, and existing home sales pick up only after newly signed contracts work through to closing. Same dominoes, opposite direction.
| Series | Where It Sits in the Pipeline | How Fast It Turns |
|---|---|---|
| Building permits | Intention, before any work begins | Fastest; reacts within weeks of rate moves |
| Housing starts | Ground broken, spending begins | Follows permits by roughly a quarter |
| New home sales | Contract signed on a new build | Intermediate; tracks current mortgage rates |
| Existing home sales | Resale closings, weeks after contracts | Slowest; lags rate moves by one to two months |
Housing Data, Answered
Why do permits matter more than starts for forecasting?
Permits sit earlier in the pipeline, so they capture builder sentiment before any money is committed. A turn in permits leads starts by weeks to months, which makes it the cleaner leading signal even though starts carry more immediate economic weight.
Does housing data move currencies?
Indirectly, yes. A strong or weak housing print shifts expectations for the central bank's rate path, and rate expectations move currencies. The release rarely sparks a big move on its own, but a string of surprises in either direction can reprice the policy outlook.
Why do the series disagree with each other?
Because they measure different stages with different lags. Permits can fall while existing home sales hold up, simply because closings reflect contracts signed months earlier. Disagreement between the series is usually timing, not contradiction.
What single housing number should a new trader watch?
Building permits, watched as a trend over several months. It is the earliest stage, the least distorted by closing lags, and the most direct read on how builders expect rates and demand to evolve.
Next, the survey side of the family: consumer and business confidence, the readings that try to get ahead of all this hard data by asking people what they intend to do next.