Gann Angles: The 1x1 Line and the Trend
Gann angles are trend lines drawn as fixed ratios of price to time instead of lines connecting swing points. The master line is the 1x1, one unit of price per one unit of time, drawn from a significant low or high. Everything else in the method is a steeper or shallower cousin of that one slope.

Think of a roof's pitch: chosen once at the build, carrying every line of the house upward at the same tilt, the structure rising along the angle or not at all. Gann built the fan and the squaring work on exactly that idea. The earlier trendline and channel lessons drew lines between swing points the market had already printed. This lesson draws the line from one point at a fixed slope, before the market has confirmed anything.
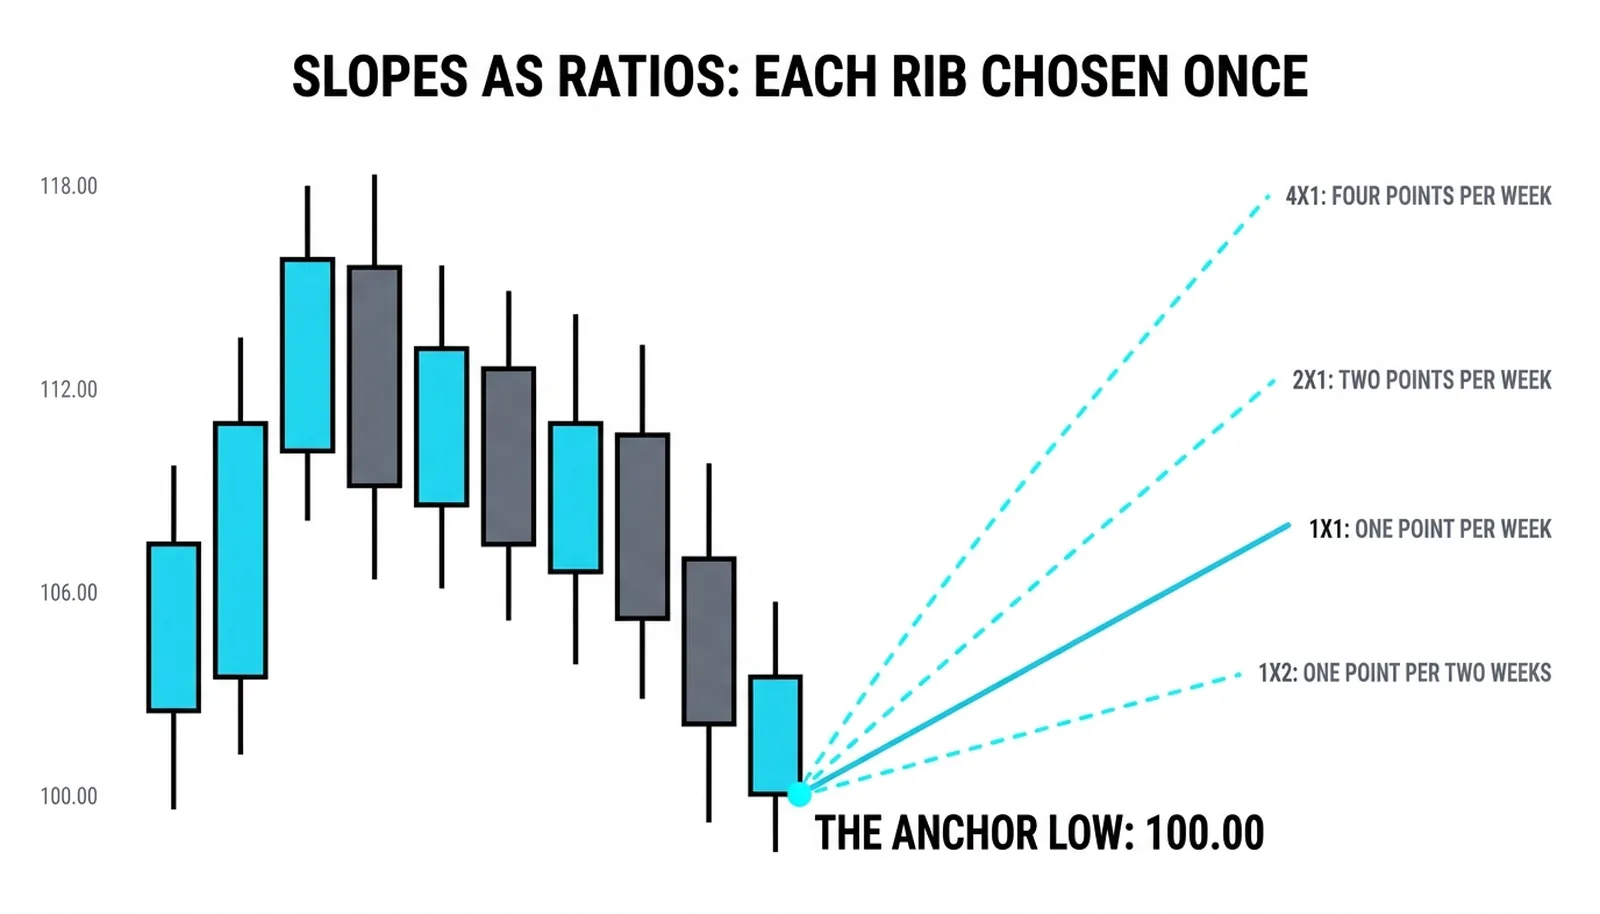
Slopes as Ratios
The 1x1 rises one unit of price per one unit of time from a major low. If the unit is one point per week and the low sits at 100.00, the line passes through 101.00 in week one, 108.00 in week eight, and so on. It is a slope, not a connection between two pivots.
The steeper lines multiply the price side. The 2x1 rises two units of price per unit of time, the 4x1 four units. These lines describe trends running hot, prices advancing faster than the balanced pace.
The shallower lines divide it. The 1x2 rises one unit of price per two units of time, the 1x4 one unit per four. These describe trends that are still up but tiring, grinding along at half or quarter pace.
Together the lines form a fan spreading upward from the low. The word fan here is the literal trading term: a set of rays from one origin, each a different slope, each a different reading on trend health.
The use is simple. A trend holding above its 1x1 is healthy. The first pullback that reaches the 1x1 is the trend's exam, the moment the balanced slope either holds as support or does not. A close below the 1x1 does not end the world; it hands the trend down to the next shallower line, the 1x2, and the trader re-reads the trend as slower than it looked.
That downgrade matters. A market that breaks the 1x1 and then holds the 1x2 is still rising, but it is rising at half the assumed pace, and position sizing, targets, and patience should all adjust to that fact.
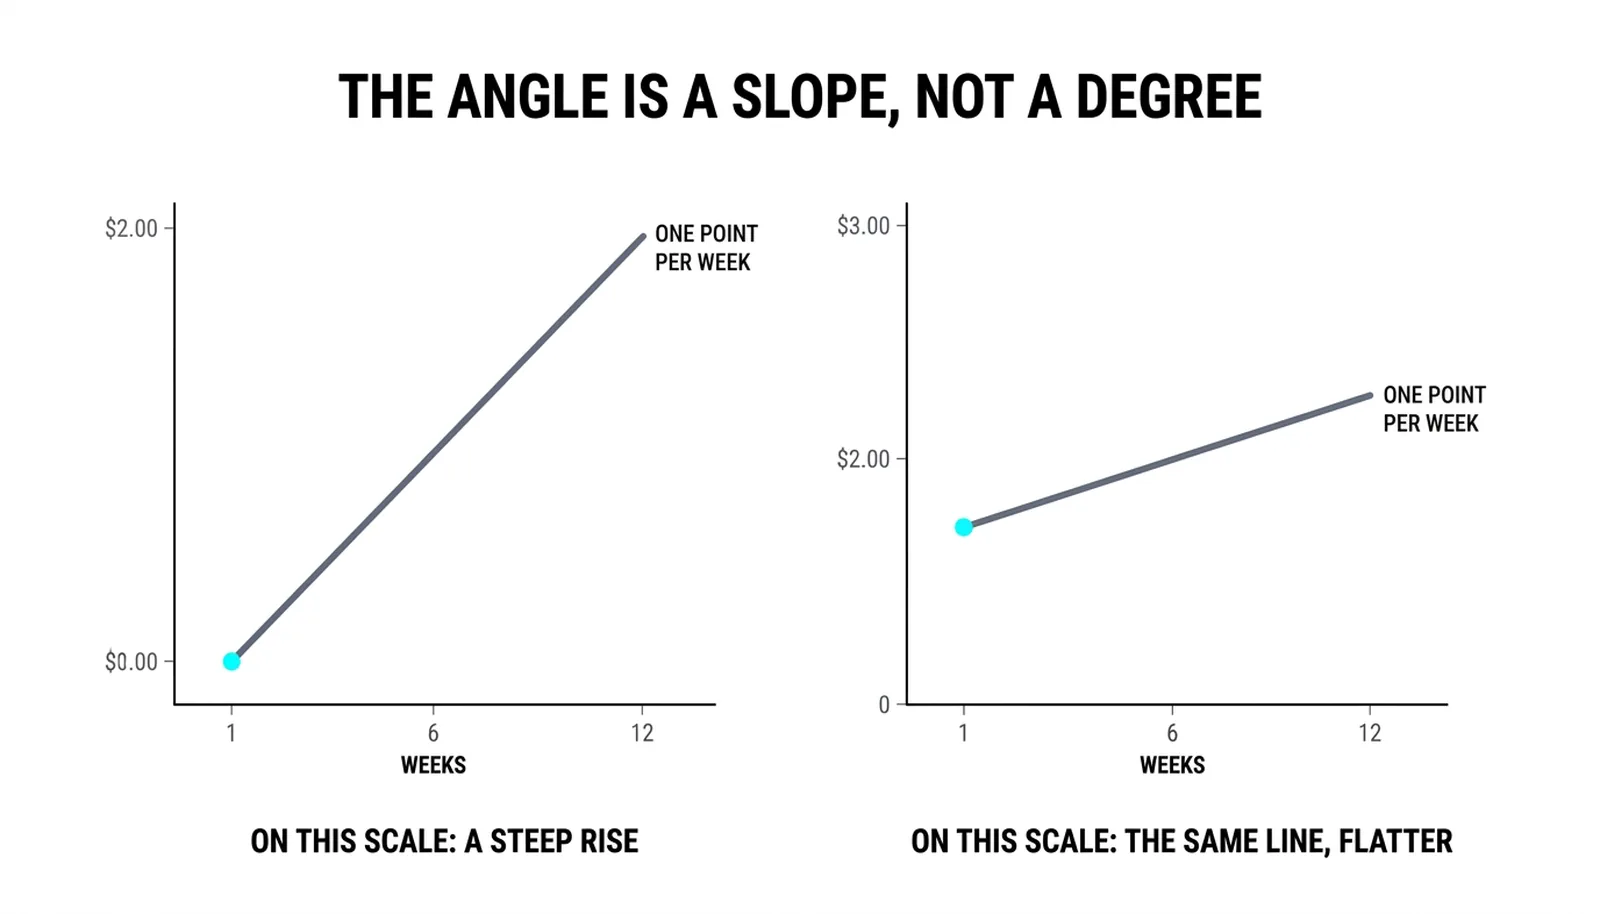
The Forty-Five Degree Caveat
The famous claim says the 1x1 is a forty-five degree line. That is true only on a chart where one unit of price occupies the same physical space as one unit of time. No working chart is scaled that way. Stretch the vertical axis and the line steepens; compress it and the line flattens. The angle on the screen is a display artifact.
So be honest about what the 1x1 actually is: a slope, one point per bar, not a geometric angle. The trader chooses the unit. One point per day. Ten cents per hour. Five points per week. That choice is the method's real decision, and it is made by the trader, not handed down by the geometry.
A practical way to choose: look at the trend being measured and pick the unit that makes the 1x1 sit roughly along the trend's own average pace. If price has been gaining about two points a week, a one-point-per-week 1x1 will sit below the action as a support rail, which is what the line is for. If the chosen unit makes the line useless, far above or far below the price path, the unit is wrong for that chart.
The blunt version: the discipline is real, the forty-five degrees is decoration.
Write the unit down before the pullback arrives. A trader who picks the scale after seeing the dip can always make the line land wherever the trade needs it to land, and then the line is confirming a decision instead of testing a trend. The unit chosen in advance is a hypothesis. The unit chosen afterward is a rationalization.
Once the unit is fixed, the rest is standard trend practice. Draw the slope from the significant low. Treat the first touch as the trend's defining test. Treat a close through the line as the end of that pace of trend, and look to the next shallower line for the slower answer.
The Test at 111.00
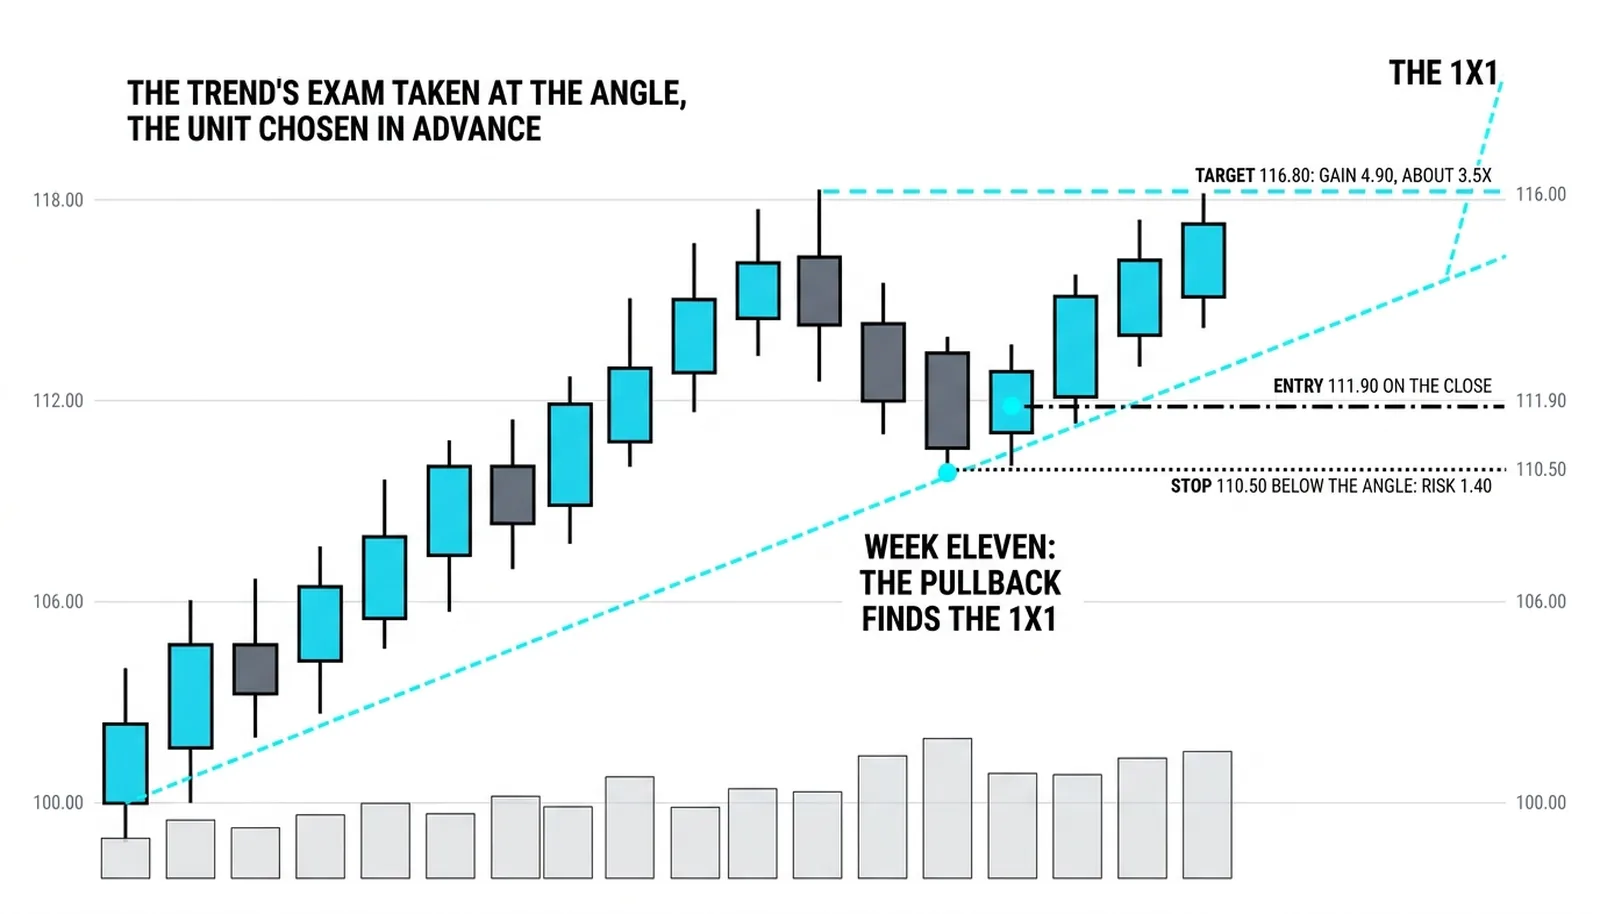
A worked example, all numbers hypothetical and round. A market bottoms at 100.00 and the trader marks that low as significant. The chosen unit is one point per week, so the 1x1 from the low passes through 101.00 in week one, 104.00 in week four, 108.00 in week eight.
The rally runs faster than the line. By week eight price reaches 116.00, a pace of two points per week, well above the 1x1. The trend is healthy by the rule: price above the master slope.
Then the pullback comes. In week eleven price dips to 111.20. The 1x1 that week passes through 111.00, so the dip has arrived within reach of the line. This is the exam. The trader is not predicting; the trader is watching the test the method was built to frame.
A reversal candle forms and closes at 111.90. The long is taken at 111.90. The stop sits at 110.50, below the angle, risking 1.40. The first target is 116.80, just above the old high, a gain of 4.90. That is about 3.5 times the risk, a sound asymmetric trade built entirely off one slope and one candle.
The failed version deserves equal time. Suppose the pullback does not hold and price closes at 110.20, below the 1x1. No long is taken, or the long is exited. The trend at the one-point-per-week pace is over. The next shallower line, the 1x2, becomes the new reference, and the trader waits for the market to prove it can hold even that slower slope.
Now the deeper honesty. A second trader, using a unit of half a point per week, would have drawn a 1x1 passing through 105.50 in week eleven. That trader would have called the identical pullback at 111.20 a non-event, far above the line, or, on a different unit, a clean break. same market, same week, opposite readings. The line is a slope the trader chose. The trend test is real. The unit must be written down before the pullback, not after, or the method quietly becomes a mirror.
| Angle | Slope in plain words | What it says about the trend | What a close through it means |
|---|---|---|---|
| 4x1 | Four units of price per unit of time | The trend is running at an extreme, rarely sustainable pace | The hot phase is over; expect a fall toward the 2x1 |
| 2x1 | Two units of price per unit of time | A strong trend advancing at double the balanced pace | Strength is fading; the 1x1 becomes the next test |
| 1x1 | One unit of price per unit of time | A balanced, healthy trend at the assumed pace | The trend at this pace is broken; hand down to the 1x2 |
| 1x2 | One unit of price per two units of time | A slower trend, still rising but at half pace | The uptrend itself is in question; expect deeper retracement |
Angle Questions, Answered
What is a gann angle?
A gann angle is a trend line drawn from a significant high or low at a fixed ratio of price to time, such as one point per week, rather than a line connecting two swing points. The 1x1 is the master slope, and the steeper and shallower lines around it form the fan.
Why is the 1x1 called forty-five degrees?
Because on a chart where one unit of price and one unit of time occupy equal physical space, a one-to-one slope draws at forty-five degrees. Real charts are almost never scaled that way, so the label survives as tradition while the working truth is a slope of one price unit per time unit.
How do you choose the scale for a gann angle?
Choose the unit that places the 1x1 along the trend's own average pace, so the line sits as a meaningful support rail beneath the advance. Fix the unit in writing before any pullback begins, because a unit chosen after the fact can be bent to justify any trade.
What happens when the 1x1 breaks?
A close below the 1x1 ends the trend at that pace and hands analysis to the next shallower line, the 1x2. The market may still be rising, but at a slower rate, and the trader treats the break as a downgrade, not an automatic reversal signal.
The fan gives a trader a range of paces, from the frantic 4x1 down to the grinding 1x4, and the discipline is in picking the unit early and honoring the close through the line. The next lessons in this cluster take the same attitude toward geometry and apply it to the harmonic shapes and the patterns that fail, where the honest autopsy matters more than the pretty drawing.