Fibonacci Confluence with Trendlines
Confluence with trendlines is the meeting of a fibonacci measurement with a rising or falling line of higher lows or lower highs, a fixed price and a moving one arriving at the same place at the same time. The meeting is powerful because the trendline crowd and the retracement crowd get their answer from the same candle. Two independent groups of traders, watching two different tools, act on the same bar at the same price.

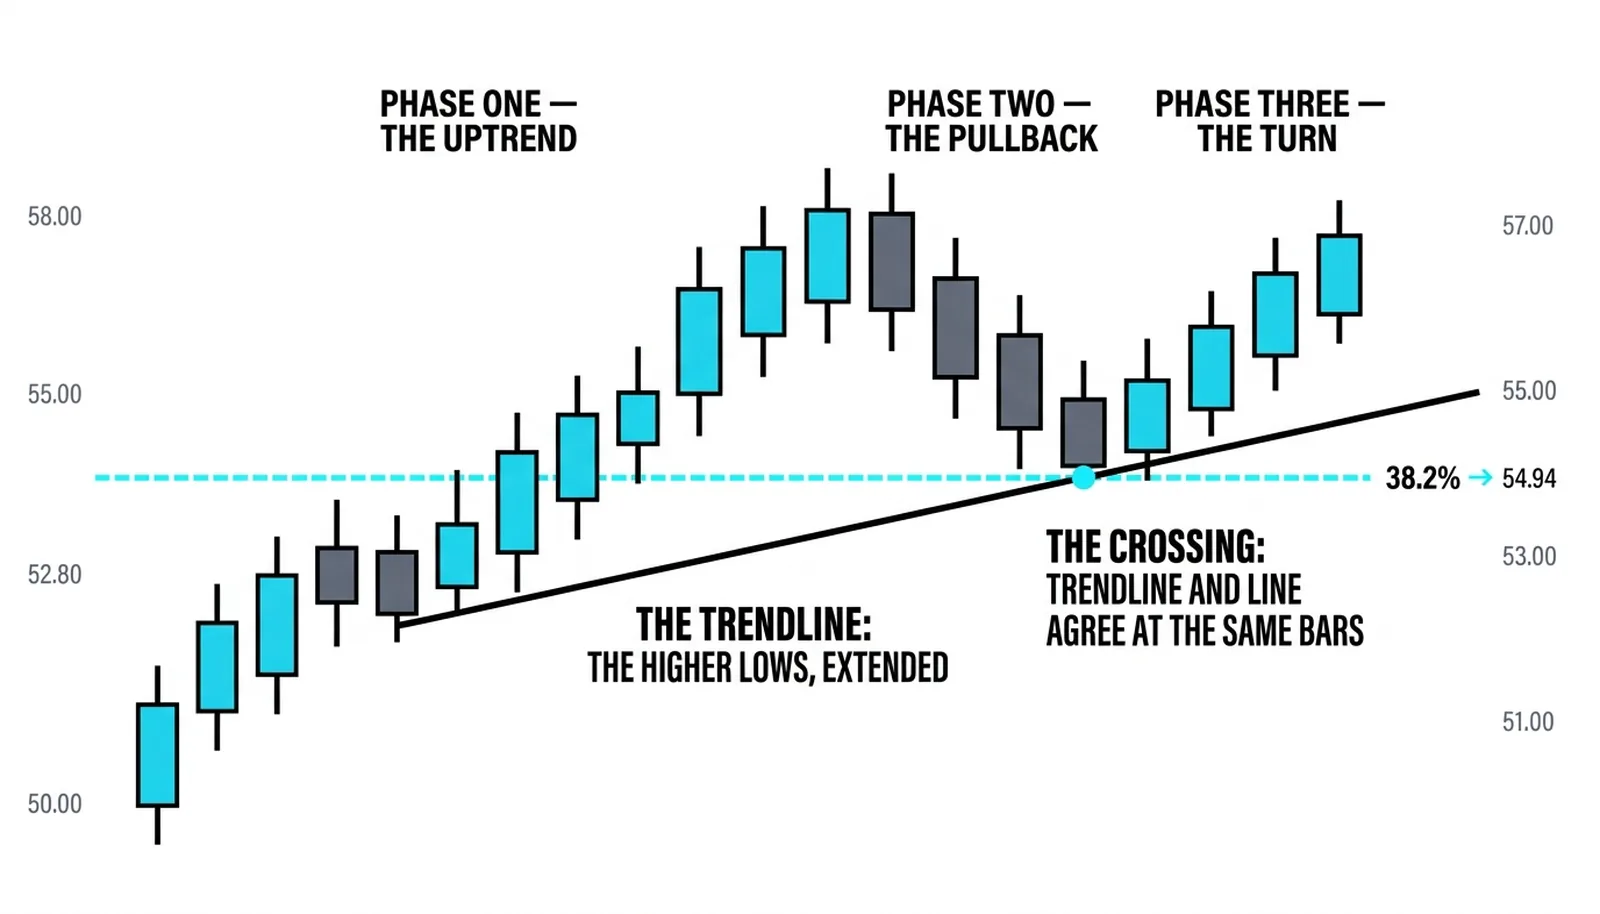
Think of the switchbacks of a mountain trail, each turn of the path a step higher, the ridgeline rising with them. The trendline is that path: it does not sit still and wait, it climbs as the trend climbs. When a horizontal fibonacci line crosses that ascending path, the two measurements agree on one bar and one price, and that agreement is the trade.
A Fixed Line Meets a Moving One
The supply-and-demand lessons joined a fibonacci line to a horizontal zone, a shelf that waited in place. This lesson joins the same measurement to a moving line, the trendline that travels with the trend. The horizontal confluences wait for price to come to them. The trendline does not wait, and that changes everything about how the meeting is found.
The confluence happens only at the bar where the rising line of higher lows crosses the retracement line's price. Before that bar, the trendline sits below the fibonacci level. After it, the trendline has climbed above. The crossing is a scheduled event, and the schedule can be read in advance.
The method is mechanical. Draw the trendline from the confirmed higher lows of the trend. Extend it forward. Mark the 38.2 percent retracement of the last leg. The price where the extended line meets that level is known before price ever gets there. That is the zone where the trend's own support and the leg's measurement agree.
The cluster method rests on clustering fixed measurements on one price; the trendline version adds a second dimension, because one of the two lines is moving through time as well as price.
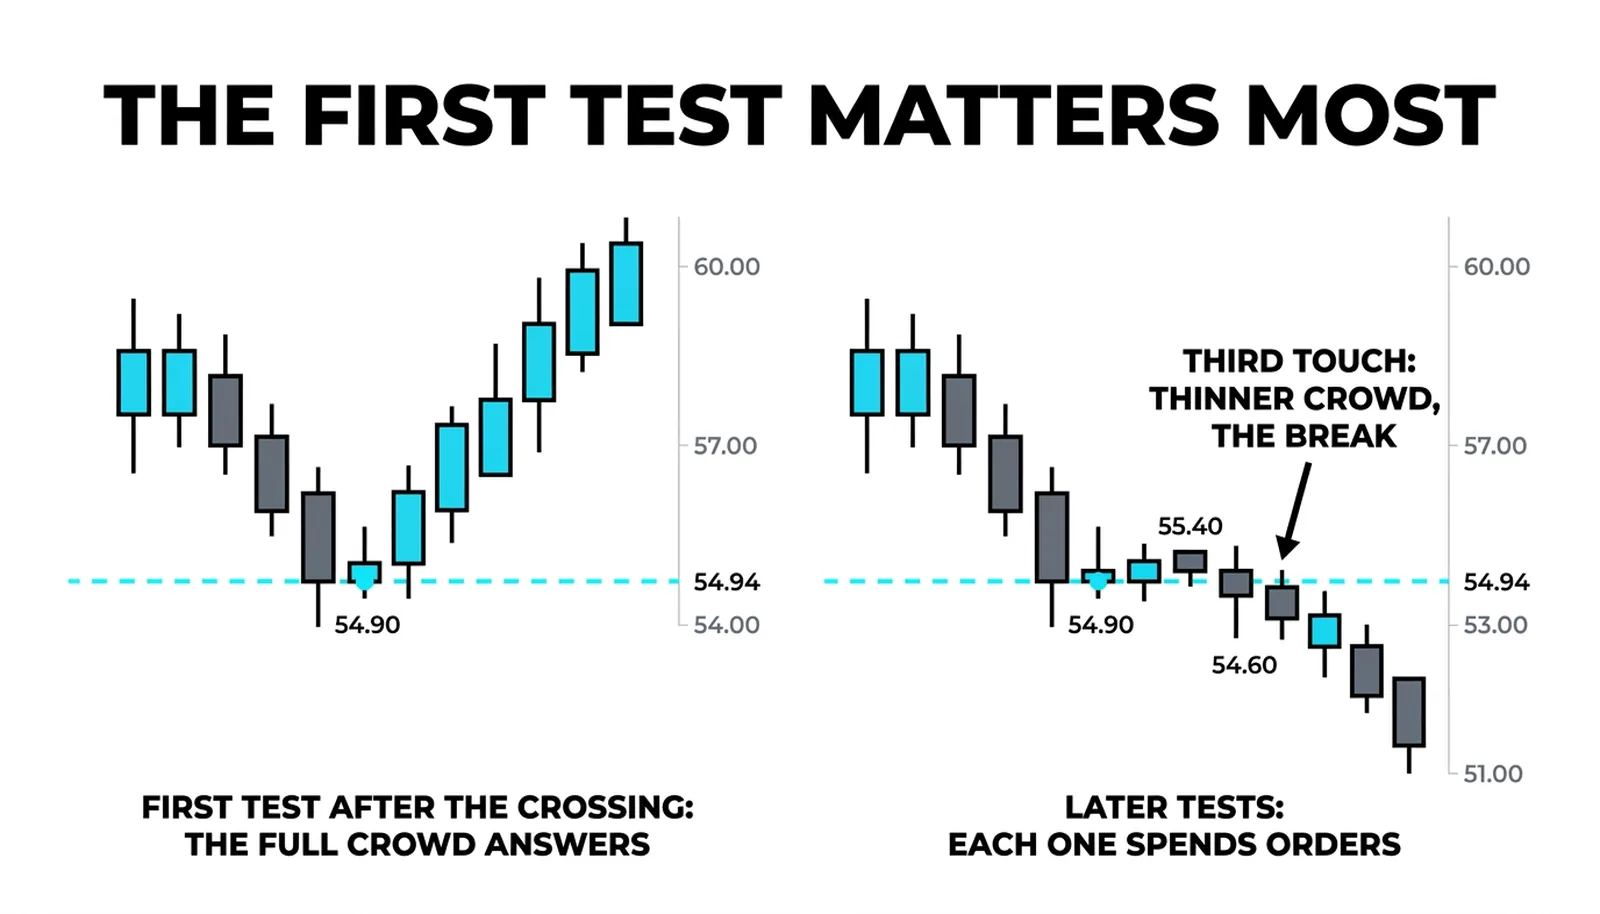
One timing rule governs the whole setup. The confluence matters most on the first test after the crossing. Each later test meets a thinner crowd, because the traders who wanted that zone have already acted. A trendline touched for the fourth time at the same fibonacci line is an old idea, not a fresh one.
What the Trendline Brings
A trendline is not a decoration. It is the record of where buyers defended the trend, and it earns its authority through repetition. The line needs at least two confirmed touches before it earns a third opinion. One touch is a coincidence. Two touches make a line the market has respected, and the third touch is the first one worth trading.
The trendline brings its own crowd to the meeting. Trend-following traders watch the line of higher lows and buy the pullbacks that reach it. Their orders sit along that rising path, and they are a different population from the fibonacci traders waiting at the retracement level. When the two lines cross, both populations fire at once, and the combined response is what gives the confluence its force.
Certain lines are disqualified from the start:
- A line drawn through only one touch, with the second touch assumed rather than confirmed.
- A line that cuts through candle bodies to fit, rather than resting on the actual lows.
- A line so steep that price cannot pull back to it without the trend itself being broken.
- A line drawn across old swings while the current leg has already made a lower low.
The price action canon has covered trend channels and the lines that bound them at length, and the consistent thread in that work is that a line matters only because traders believe it matters and act on it. A line nobody respects is ink on a screen. The two-touch requirement is the test that separates a defended line from a hopeful one.
Trading the Crossing
The trade follows the same logic as every confluence trade in this section, with one adjustment for the moving line. Wait for the crossing bar. Let price touch the zone and show the turn. Enter on the turn, not in anticipation of it.
The stop is where this trade differs from the horizontal version. With a fixed zone, the stop sits just below the zone's lower edge. With a trendline confluence, the stop belongs below the trendline, because the trendline is the lower of the two defenses and the one that defines the trend itself. A stop tucked a hair under the fixed fibonacci line can be hit while the trendline still holds, which means being stopped out of a trade whose premise is still intact.
The wider stop is the cost of the stronger location. Accept it and size the position so the risk in currency stays constant.
The risk itself is defined by the shared failure. When the trendline and the fibonacci line sit in the same place, they fail in the same candle. A close below both ends the trend's rising defense and the pullback's measurement at once. That is a clean, unambiguous exit signal. There is no ambiguity about whether the setup is still alive, because both of its pillars fell together.
This double break cuts both ways, and it deserves a blunt statement. Confluence concentrates risk exactly where it concentrates conviction. The same overlap that makes the entry strong makes the failure decisive, so the trader who takes these setups must take the stop without negotiation when the shared line gives way.
The Crossing at 54.80
The numbers below are invented and round, a worked illustration rather than a record of any real market.
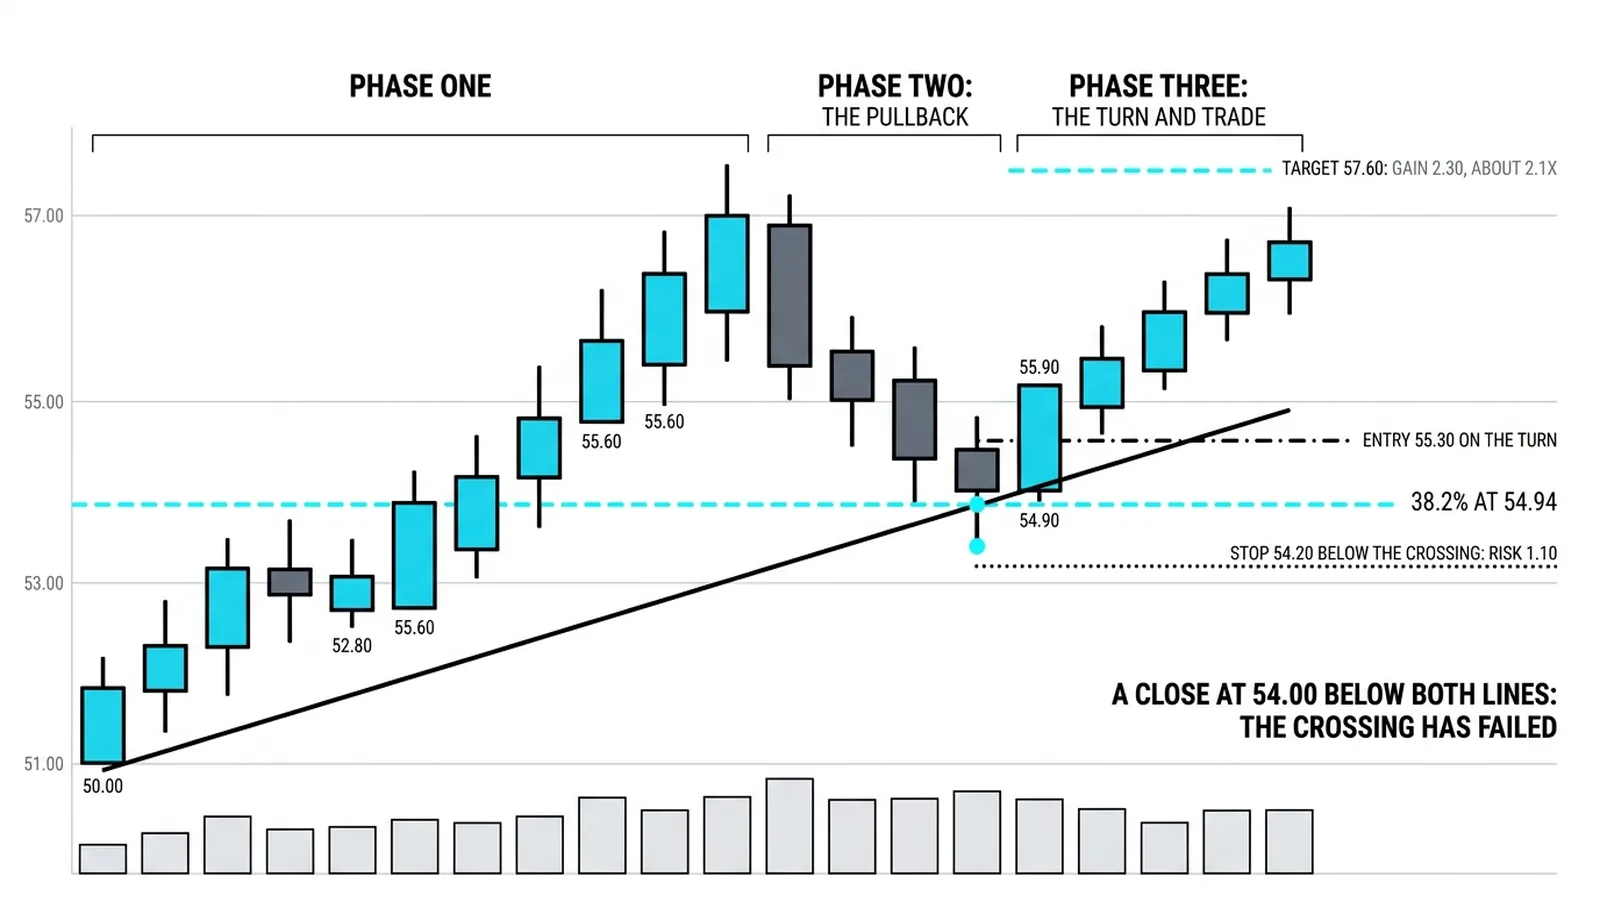
A leg runs 8.00 points, from 50.00 up to 58.00. The 38.2 percent retracement of that leg sits at 54.94. The rising trendline, drawn from the two confirmed higher lows of the trend and extended forward, passes 54.80 at the current bars. The confluence zone spans 54.80 to 54.94, a band fourteen cents wide where the fixed measurement and the moving line overlap.
Price pulls back into the zone and touches 54.90, right at the crossing, then turns. The turn confirms that both crowds responded. The long is taken at 55.40, on the reversal bar rather than inside the zone.
The stop goes at 54.30, below the trendline rather than beneath the fixed line. The risk is 1.10 per share. The first target sits at 57.70, just under the old high at 58.00, because highs attract selling before they are reached. The gain at that target is 2.30, about 2.1 times the risk.
Now the failed version. Instead of turning, price closes at 54.10. That single close sits below the trendline at 54.80 and below the fibonacci line at 54.94. Both defenses die in the same candle. The trend's rising support is broken and the leg's measurement is broken, and there is nothing left of the setup to defend. The stop at 54.30 would already have exited the position, but even a trader watching without a resting stop has a clear answer: the confluence failed, the trade is over.
The table below sets out what each element contributed.
| Component | Its own line | Its own crowd | The shared failure |
|---|---|---|---|
| Fibonacci retracement | Fixed at 54.94, the 38.2 percent line of the 50.00 to 58.00 leg | Retracement buyers waiting at the measured level | A close at 54.10 breaks both lines in one candle, ending the trend's defense and the pullback's measurement together |
| Rising trendline | Moving, passing 54.80 at the crossing bars | Trend followers buying the line of higher lows | |
| The crossing zone | 54.80 to 54.94, where the two lines overlap | Both crowds acting on the same bar | The stop at 54.30 exits before the shared failure confirms |
| The trade | Entry 55.40, stop 54.30, target 57.70 | Risk 1.10 against a gain of 2.30, roughly 2.1 to 1 | The wider stop is accepted as the price of the stronger location |
Trendline Questions, Answered
What is confluence with trendlines?
Confluence with trendlines is the meeting of a fibonacci retracement level with a rising or falling trendline at the same price on the same bar. A fixed measurement and a moving line arrive together, and the traders who follow each tool respond to the same candle, which gives the zone its strength.
How many touches does a trendline need?
A trendline needs at least two confirmed touches before it earns a third opinion. Two touches show the market has respected the line; the third touch is the first one worth trading. A line drawn from a single touch, or bent through candle bodies to fit, is not a trendline at all.
Why does the stop go below the trendline?
The stop goes below the trendline because the trendline is the lower and more fundamental of the two defenses. A stop placed just under the fixed fibonacci line can be triggered while the trendline still holds, removing the trader from a setup whose premise remains intact. Below the trendline, the premise is genuinely dead.
What does it mean when price breaks the trendline and the fib line together?
A close below both lines at once means the setup has failed completely, the trend's rising support and the leg's measurement ending in the same candle. That shared failure is the defined risk of the trade, and it is also the clearest possible exit signal, because nothing about the original idea survives it.
The next lesson adds the final piece: the candlestick signal that fires inside the prepared zone, the location proposing and the reaction disposing.