Gann Fan: How to Draw and Use It
The gann fan is the full family of angles drawn from one pivot at once: a set of fixed slopes radiating from a single significant low or high, with the 1x1 in the middle and steeper and flatter lines above and below it. The working rule is simple. When price closes through one rib, the next rib becomes the line that matters, and on the way back up each broken rib becomes a target in turn.

Think of a pocket fan opened from one rivet: every rib sits at a fixed spread from the last, and the eye reads the whole shape rib by rib rather than line by line. The single-angle lesson drew one master slope from one pivot and asked what price did at it. This lesson draws the entire family from that same pivot and trades the rungs between the ribs.
One Pivot, Eight Ribs
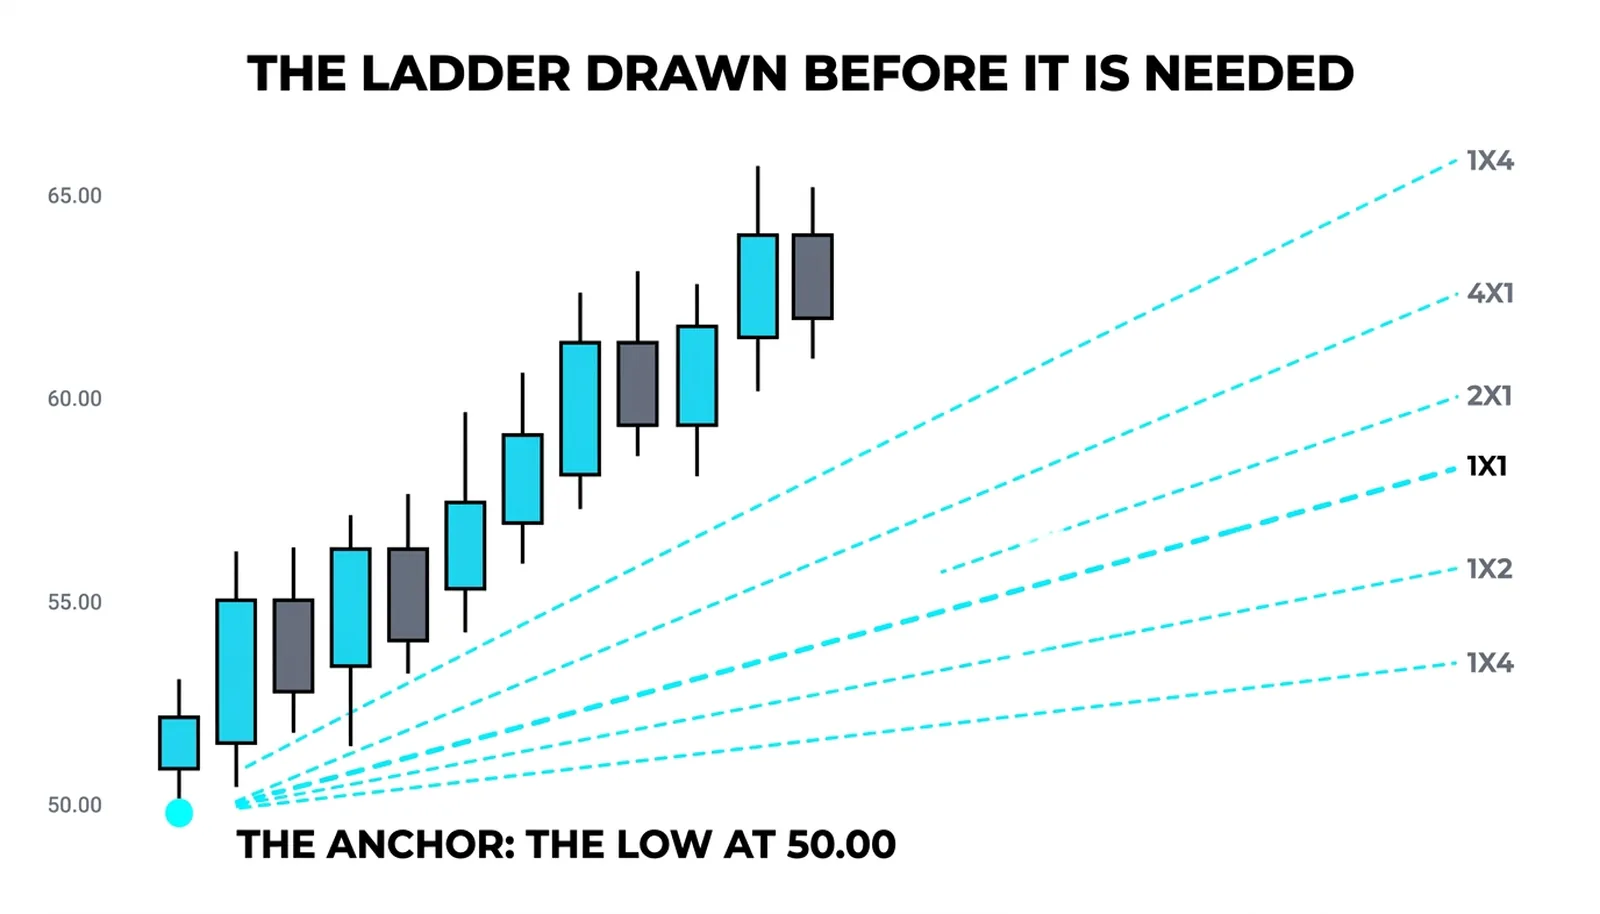
Everything in a gann fan hangs on the anchor point. The fan starts at a major swing low for an upward fan, or a major swing high for a downward one. Major means the turn that the whole chart agrees on, the low that ended a real decline, not a wiggle inside a range.
From that pivot the ribs are drawn at fixed ratios of price per unit of time. The 1x1 sits in the middle at one unit of price per one unit of time. Above it run the 2x1 and the 4x1, steeper lines that price rarely sustains for long. Below it run the 1x2 and the 1x4, flatter lines that mark progressively weaker trends. Some charting packages extend the family to 8x1 and 1x8, but the core five carry most of the work.
Each rib is a slope chosen once and never moved. That is the discipline of the method. The trader does not adjust the fan because price is drifting away from it. The fan is a fixed grid laid over the chart at the moment the pivot forms, and every later decision is read against that grid as it stands.
Gann treated the 1x1 as the balance line of a trend. Price above it is strong, price below it is weak, and the crossing itself is information. The ribs above and below are gradations of that same judgment, so the fan turns one binary read into a graded scale.
Choosing the scale, the price-per-time ratio, is the one free variable. A common convention is one point per week on a weekly chart or one point per day on a daily chart, but the honest approach is to test the scale against history: if past swings repeatedly turned at the ribs, the scale fits that market. If they never did, the fan on that scale is decoration.
The Descent and the Return
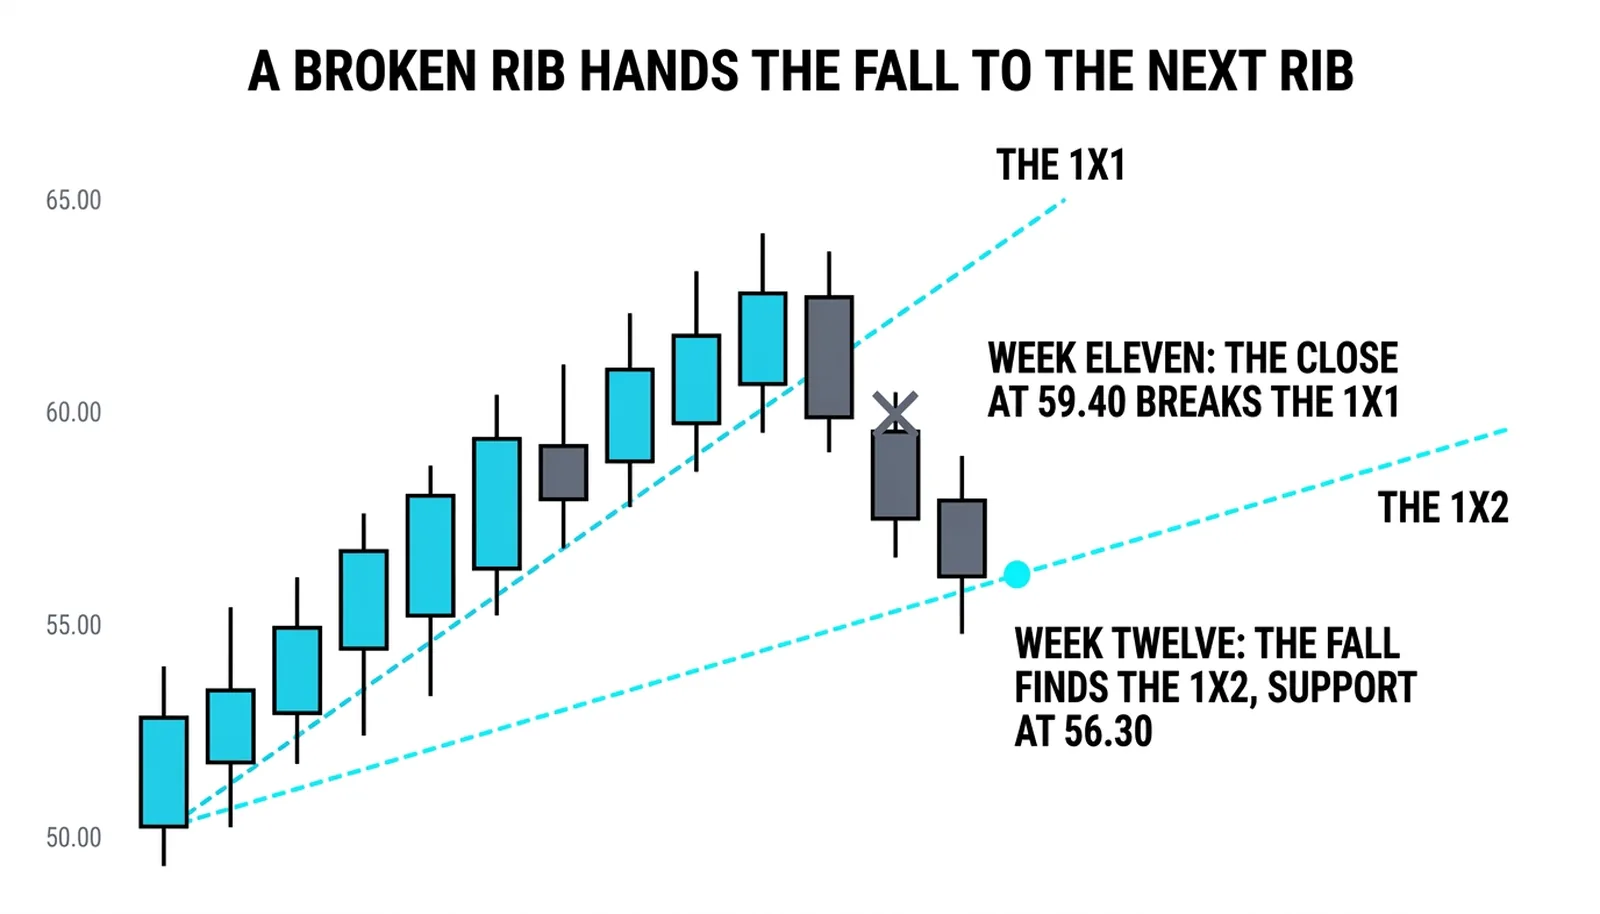
The descent rule does the heavy lifting. When price closes through a rib, the next rib below becomes the line that matters. A close under the 1x1 sends attention to the 1x2. A close under the 1x2 sends it to the 1x4. Each step down is a downgrade in trend health, announced in advance by a line that was drawn weeks earlier.
This is where the fan earns its keep. The lower ribs put supports under the move before the fall begins, a set of pre-drawn supports the trader did not have to find in the panic. While everyone else is asking where the decline might stop, the trader with the fan already has three candidates on the chart, with dates attached.
The recovery rule mirrors it. Once a rib is broken, that rib becomes the first target on the way back up. Price that fell from the 1x1 to the 1x2 will typically meet selling at the underside of the 1x1. And a close back above the 1x1 hands the trend back to the buyers. The reclaim is the fan's all-clear signal.
Now the honesty, stated plainly. The fan looks like a map of the future and is nothing of the kind. The ribs are slopes chosen by the trader, not structures the market is obliged to respect. In fast markets price slices through several ribs without a pause, and the rungs give no footing at all. The fan organizes a fall; it does not cushion one.
The anchor is the method's real decision. A fan drawn from a minor swing is noise, because every rib inherits the error of the pivot. Two traders drawing from different lows will disagree about everything downstream, and both will have tidy charts. The tool is only as good as the pivot it hangs from.
The Rib at 56.00
A worked example, all numbers hypothetical and round. A market bottoms at 50.00, a clean major low after a long decline. The trader anchors a fan there with the 1x1 scaled at one point per week. On that slope, the 1x1 crosses 60.00 in week ten.
Price rises along and above the 1x1 for ten weeks. In week eleven the weekly close prints at 59.40, below the 1x1, which by then sits near 60.00. The descent rule fires: the trend is downgraded, and the next rib below, the 1x2, becomes the line that matters. The 1x2 passes through 56.00 that week.
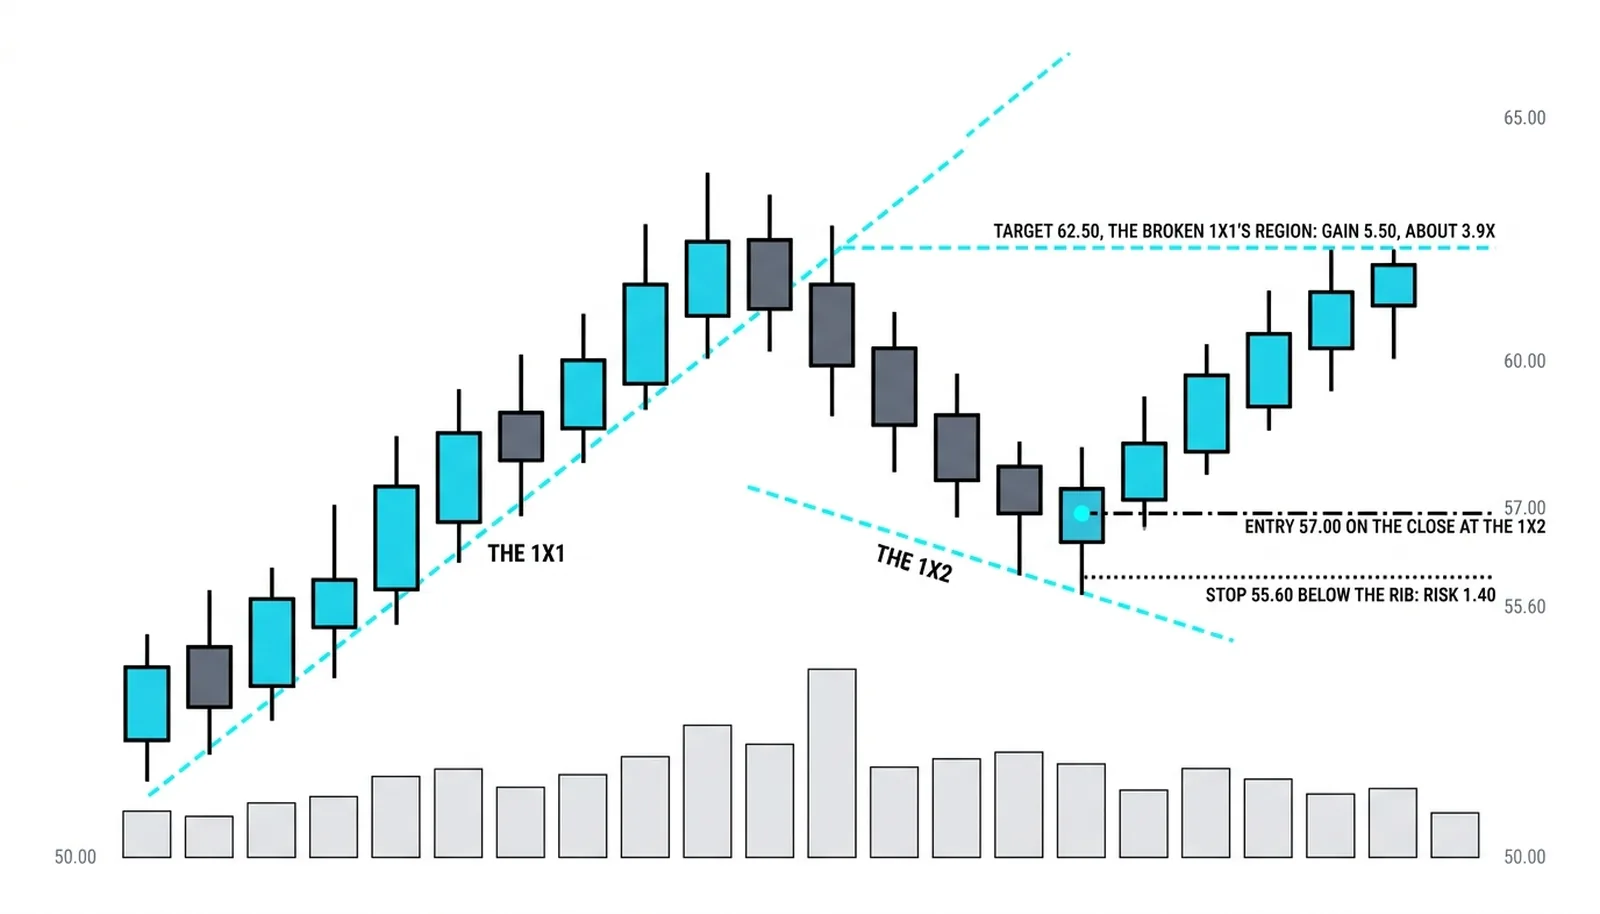
Price falls into that rib and support holds at 56.30. A reversal candle then closes at 57.00. The trader takes the long at 57.00, with the stop at 55.60, just under the rib, risking 1.40. The first target is the broken 1x1 above, which on the current count sits near 62.50. The gain to that target is 5.50, about 3.9 times the risk.
The trade works because the fan supplied every number in it. Entry came from the reversal at the rib, the stop sat under the rib, and the target was the next rib overhead. Nothing was improvised mid-trade.
The failed version deserves equal time. Suppose the week closes at 55.20 instead, through the 1x2 as well. Two ribs gone in one week. The long thesis is dead before it forms, and any trader who bought the touch of the 1x2 without waiting for a reversal close is stopped or underwater. The ribs are evenly spaced slopes in a market that moves unevenly. When the fall accelerates, the fan still records it faithfully, rib by rib, but recording is all it does.
| Rib | Slope in plain words | Role in a rise | Role after the break |
|---|---|---|---|
| 2x1 | Two points per week, steep | Marks an unsustainably fast advance | First overhead target once reclaimed territory builds |
| 1x1 | One point per week, the balance line | Healthy trend holds above it | First target on recovery; reclaiming it restores the uptrend |
| 1x2 | One point per two weeks, gentle | Weakening trend, first support on a break of the 1x1 | Becomes resistance until price closes back above it |
| 1x4 | One point per four weeks, nearly flat | Last line of trend defense | A break signals the move from correction to reversal |
Fan Questions, Answered
What is a gann fan?
A gann fan is a set of fixed-ratio trendlines drawn from one significant pivot, with the 1x1 in the middle and steeper and flatter ribs above and below it. It grades trend health by which rib currently holds price, and it pre-draws supports and targets for any decline or recovery.
How do you draw a gann fan?
Pick a major swing low or high, choose a price-per-time scale that fits the market's history, and draw the rib family from that pivot: 1x1 in the middle, 2x1 and 4x1 above, 1x2 and 1x4 below. Then leave it alone. The fan is drawn once and read, never redrawn to chase price.
Which anchor point should the fan use?
The fan should anchor at the most significant pivot on the chart, the low that ended a real decline or the high that ended a real advance. A minor swing produces a fan that looks precise and means nothing, because every rib inherits the error of a weak pivot.
What does it mean when price breaks multiple fan lines?
A break of several ribs in one bar or one week means the move is running faster than the fan's geometry, and the rungs offer no footing. Stand aside on the long side, note which ribs now sit overhead as future resistance, and wait for price to base before the fan becomes useful again.
With the fan drawn and the descent and recovery rules in hand, the next step in the geometry thread is putting Gann angles beside the modern tools on a live chart and seeing where the old slopes and the new levels agree, because agreement between unrelated methods is where the strongest zones come from.