Common Fibonacci Retracement Mistakes
The common retracement mistakes are handling errors, not tool errors. The tool measures correctly every time; the trader anchors on internal wiggles instead of completed swings, runs the anchors backwards, redraws on every bar, expects the line to be a signal, demands precision the market does not offer, and reads the lines with no structure underneath. Every one of those habits produces levels that look official and mean nothing.

The drawing lesson walked the correct procedure end to end. This lesson catalogs the failure modes: the drawing mistakes that misplace the lines, and the usage mistakes that waste correctly drawn ones. Think of the right notes played on an out-of-tune piano, where the musician's fingers are correct and the sound is still wrong until the instrument itself is fixed. Fix the handling and the same tool starts telling the truth.
The Drawing Mistakes
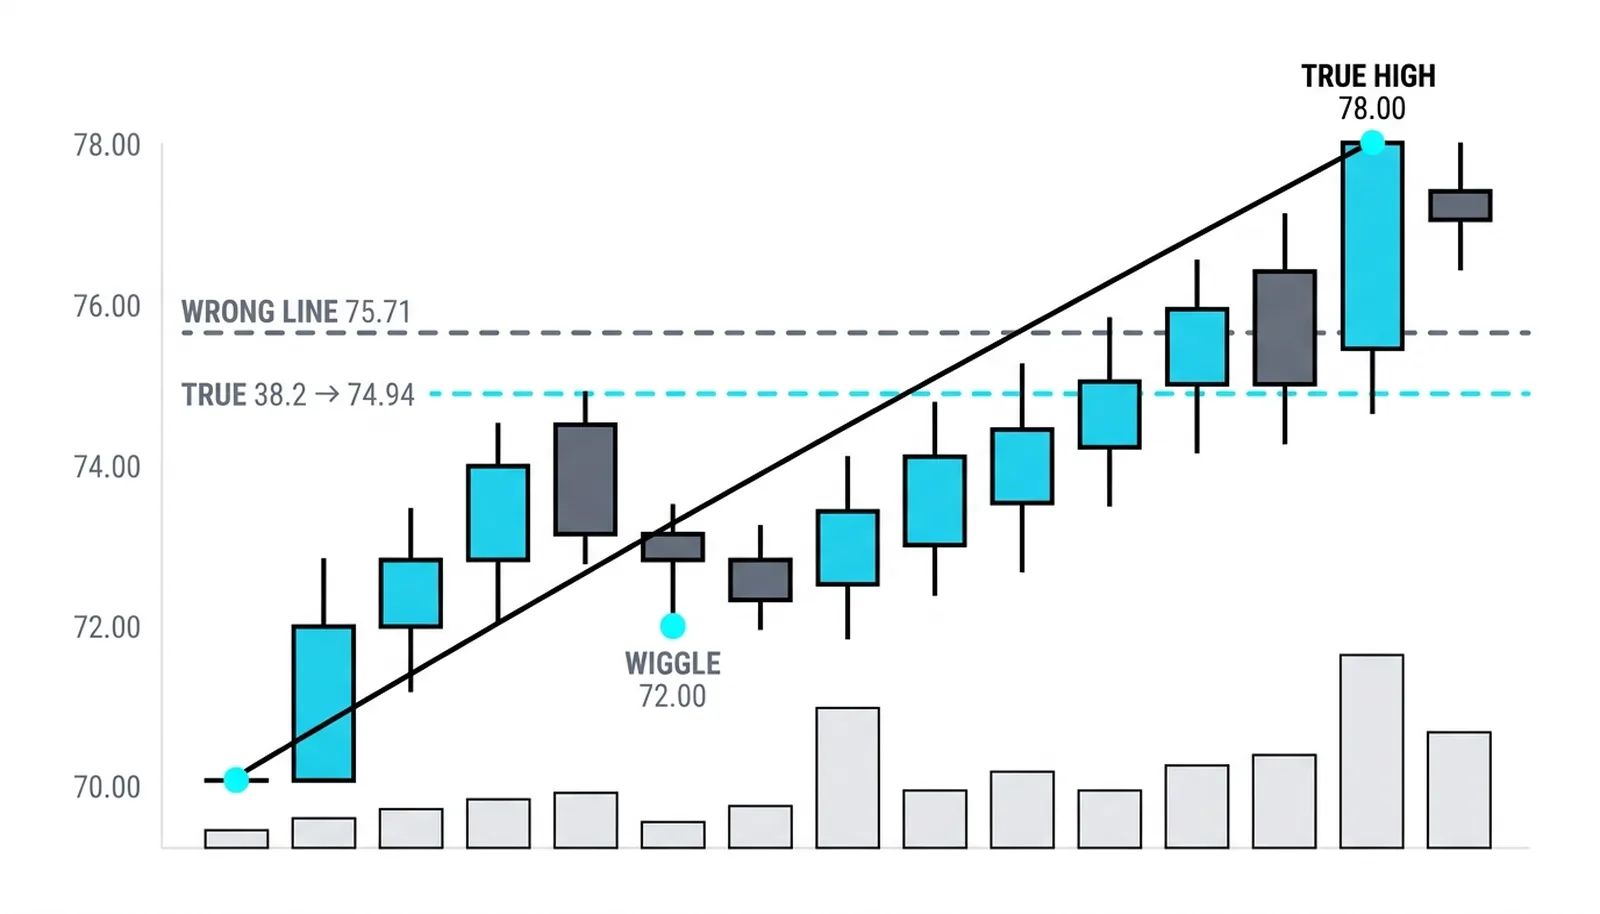
The first and most common error is anchoring on an internal wiggle instead of the completed swing. Inside every real impulse leg there are smaller pauses and pullbacks, and an untrained eye grabs one of those as the start of the move. The result is a set of lines shifted up or down by an amount nobody intended. Every level on the chart is now wrong by the same offset, and the trader has no way to see it from inside the chart.
The second error is running the anchors backwards. In an uptrend the measurement runs from the swing low to the swing high, so the retracement lines sit inside the leg where the pullback will actually travel. Draw it high to low and the lines land above the high, in territory the pullback will never visit. The levels are mathematically valid and practically useless.
The third error is redrawing on every minor bar. A new candle prints, the trader nudges an anchor, and the lines drift a few ticks. Do that thirty times in a session and the tool stops being a measurement and becomes a mood. A measurement has to hold still long enough to be tested.
The fourth error is anchoring on unconfirmed extremes. A swing high is not a swing high until price has turned away from it with enough conviction to prove the turn. Anchor on a high that is still forming and the swing completes somewhere else, forcing a redraw in regret. Patience at the anchor point is the cheapest accuracy available.
The Usage Mistakes
Perfectly drawn lines still lose money when they are used badly. The first usage mistake is treating the line as a signal. Price touches the 38.2 line and the trader enters, as if the level itself were a reason to act. A level is a place to watch, not an instruction. The entry belongs to the reaction at the level, the rejection candle or the turn in structure, never to the touch alone.
The second usage mistake is demanding precision. The trader expects the turn to arrive at 74.00 exactly, and when price reverses at 74.20 the trade is dismissed as sloppy. Reactions scatter around a level as a matter of course, because the level marks a zone of interest rather than a single tick where the market must obey. Demanding exactness from a tool built on approximation is a self-inflicted wound.
The third usage mistake is reading retracements alone. No structure, no prior swings, no confluence, just a grid of lines and a hope. That asks one measurement to carry a decision that needs corroboration. The cluster method is the corrective: the lines are drawn to find where the correction should end, and the drawing earns its keep only when structure agrees, with prior swings and congestion confirming or refusing what the tool proposes. The price action canon adds the discipline: a level is context, and context without a confirmed turn is not a trade.
Fixing the Habit
The corrected workflow is short. Identify the completed impulse leg, confirmed on both ends. Anchor low to high in an uptrend, high to low in a downtrend. Draw once, then leave the tool alone until the swing resolves. Wait for price to reach a level, then wait again for the reaction. Enter on the turn, place the stop beyond the next level down, and define in advance what kills the read.
A simple confirmation checklist keeps the process honest:
- Is the anchor a completed swing, proven by a real turn away from it?
- Does the direction of the drawing match the direction of the trend?
- Does the level coincide with structure, a prior swing, or congestion from earlier trading?
- Has price actually reacted at the level, or only touched it?
- Is there a defined price where the read is wrong?
Once the handling is right, a level is worth exactly one thing: a location where a decision gets cheaper. The turn confirms, the risk is small and defined, and the trade becomes arithmetic instead of hope. That is all a retracement line has ever offered, and it is enough.
The Wrong Line and the Right One
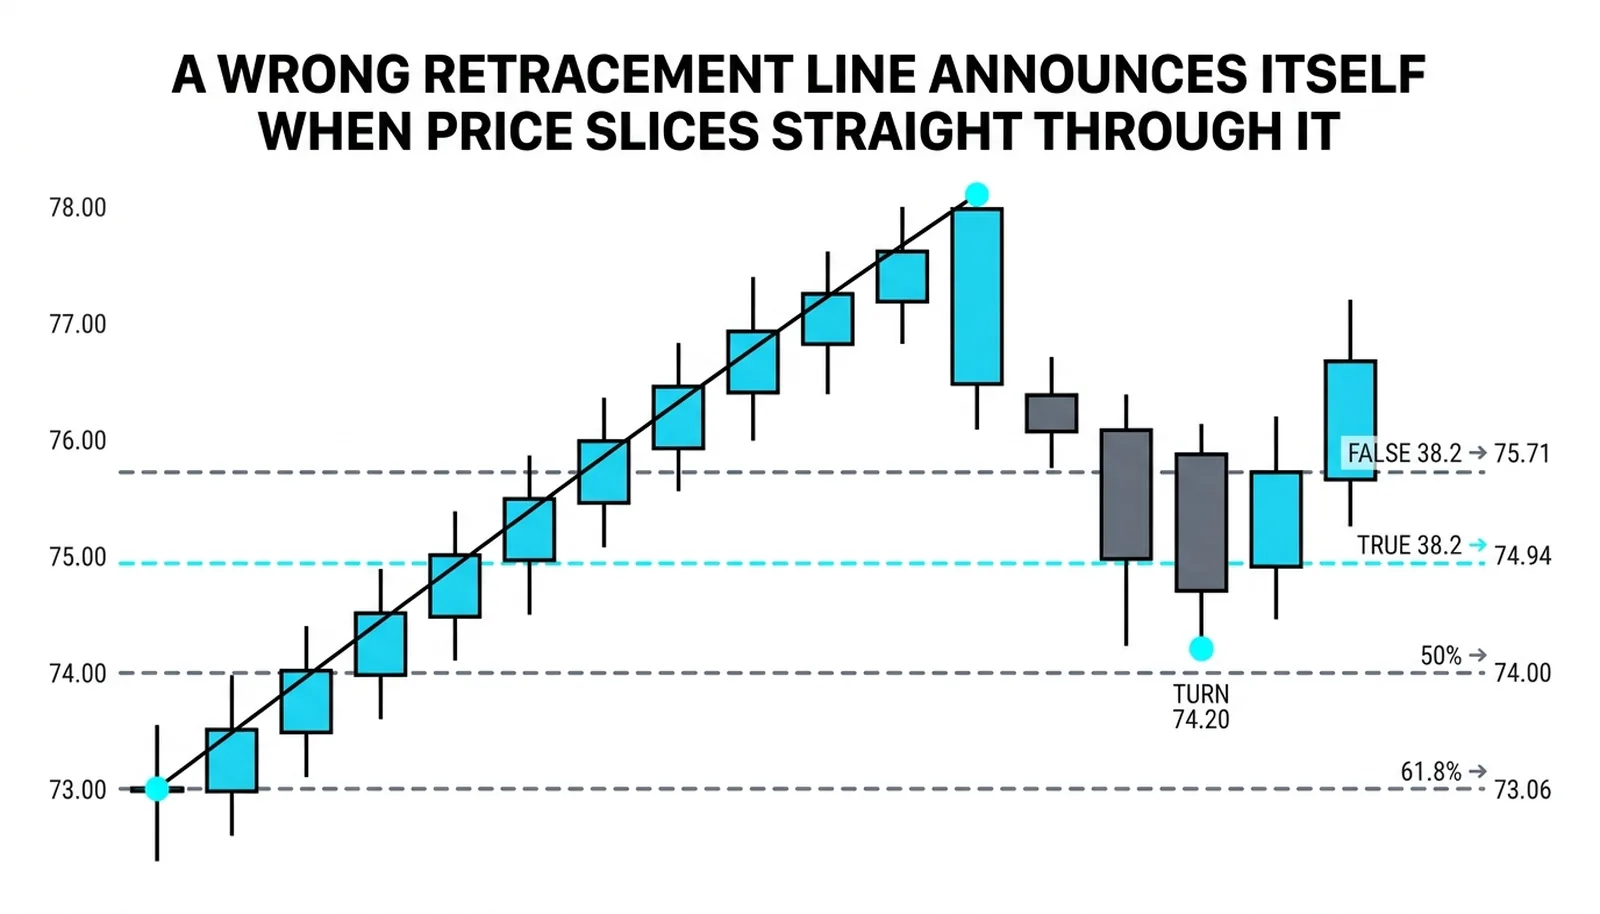
Consider a hypothetical example with round numbers. The true impulse leg runs 8.00 points, from 70.00 to 78.00. Drawn correctly, the 38.2 percent retracement sits at 74.94, the 50 percent at 74.00, and the 61.8 at 73.06.
Now the mistake. The trader anchors the low end on an internal wiggle at 72.00 instead of the true swing low at 70.00. The tool dutifully computes a 38.2 line at 75.71, more than three quarters of a point above the real one. The chart looks official. The level is fiction.
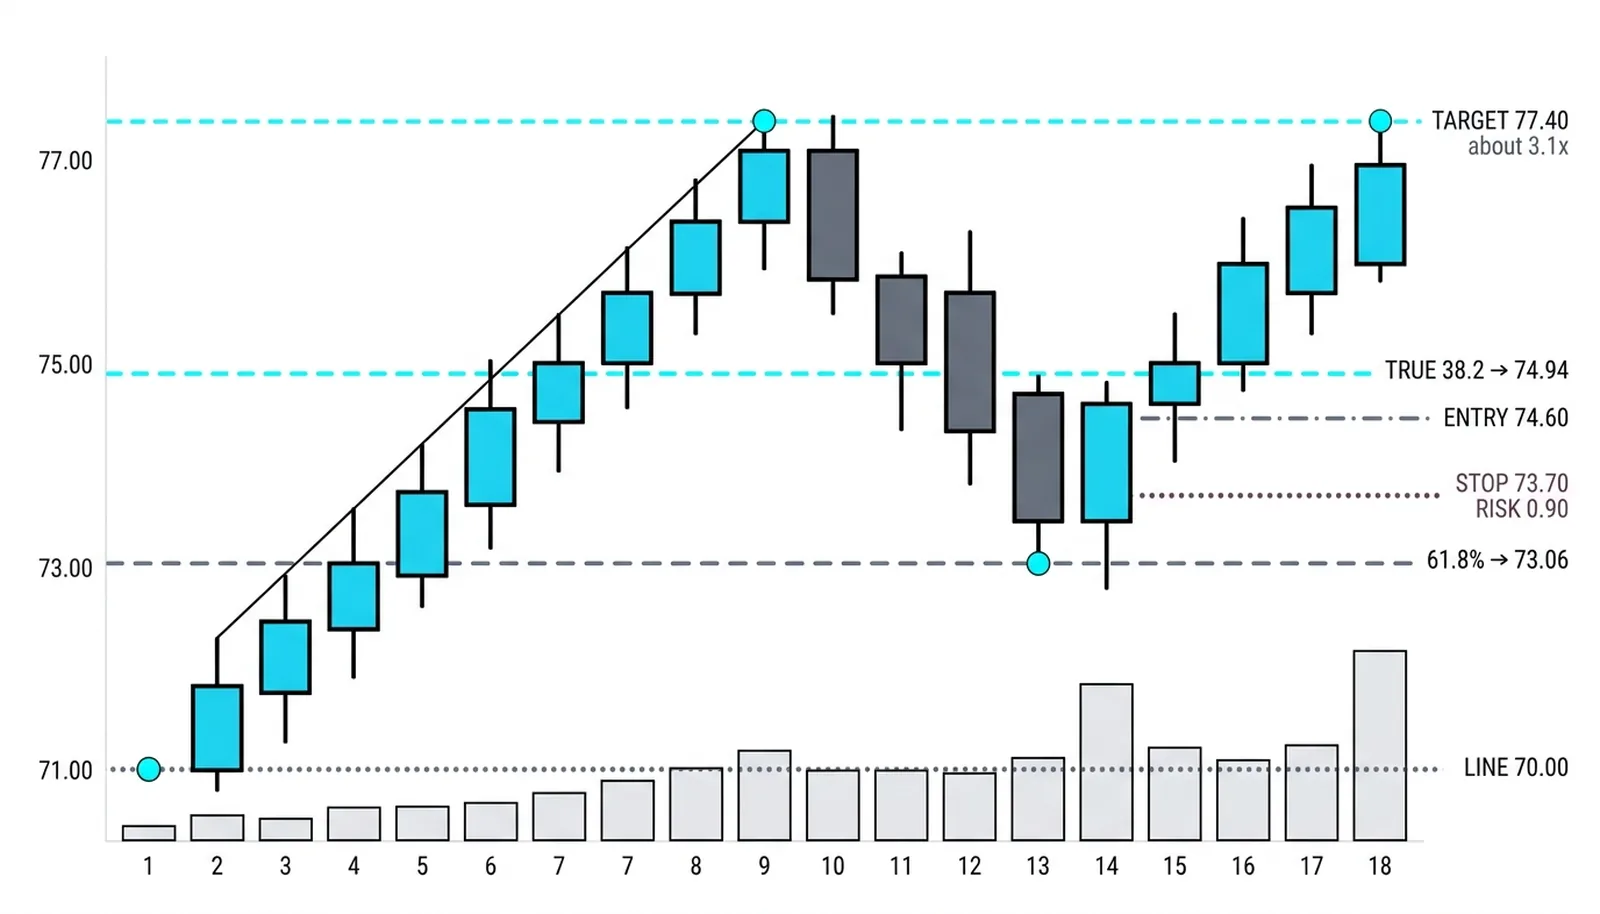
Price pulls back and slices through 75.71 without pausing, as if the line were not there, because to the market it was not. The decline continues to 74.20, between the true 38.2 and 50 percent lines, and turns there with a clear rejection. The trader enters long at 74.60 on the confirmation, places the stop at 73.70 beneath the 50 percent line, and risks 0.90. The first target is 77.40, a gain of 2.80, roughly 3.1 times the risk.
The honesty deserves stating plainly. The false line cost nothing but confidence; price blew through it and told the trader the anchor was wrong, and the true lines did the work. The deeper honesty is that even correctly drawn lines are only half the job. The turn at 74.20 still had to confirm before the entry. And the failed version is always waiting: a close at 72.80, below the 61.8 line, kills the read entirely and hands the watch to the swing low at 70.00. When that happens, the correct response is to stand down, not to redraw.
| The Mistake | What It Looks Like | The Cost | The Fix |
|---|---|---|---|
| Anchoring on an internal wiggle | Lines shifted from where the swing truly started | Every level wrong by the same hidden offset | Anchor only on completed, confirmed swings |
| Running the anchors backwards | Levels plotted above the high in an uptrend | Lines the pullback will never reach | Draw low to high in uptrends, high to low in downtrends |
| Redrawing on every bar | Levels drifting a few ticks with each candle | A measurement that can never be tested | Draw once and hold until the swing resolves |
| Treating the line as a signal | Entering the moment price touches a level | Entries with no evidence of a turn | Wait for the reaction; the level is context, not a trigger |
Retracement Mistake Questions, Answered
Why do my Fibonacci levels not line up with anything?
Because the anchors are wrong, almost always. An internal wiggle used as a start point shifts every line by the same offset, so none of them match the reactions on the chart. Re-anchor on the completed swing, confirmed at both ends, and the lines usually start agreeing with price.
Should you draw Fibonacci retracement from high to low or low to high?
Follow the direction of the move being measured. In an uptrend, draw from the swing low to the swing high so the retracement lines sit inside the leg where the pullback will travel. Reversing the order puts the levels where price will never go.
How often should you redraw a Fibonacci retracement?
Once per completed swing, and not again until that swing resolves. Redrawing on every bar turns a fixed measurement into a moving opinion and removes any chance of testing whether the levels work.
Can you trade Fibonacci levels without other confirmation?
You can, and it is the most expensive mistake on the list. A level marks a place to watch; the trade comes from the reaction at that level plus agreement from structure, prior swings, or congestion. A line alone is a location, and a location is not a reason.
With the retracement section closed, the next lesson moves from measuring the pullback to projecting the next leg: the fibonacci extension, and how it differs from the retracement this section measured.