How to Read Market Structure
Market structure is the pattern of a market's swing highs and swing lows, and reading it is like reading footprints in snow: the tracks show you who has been winning without you needing a single indicator. Before you touch a moving average, an oscillator, or a signal service, this is the skill to build. Price itself is the primary evidence. Everything else is commentary on it. The definitions behind that evidence are in what a trend is.

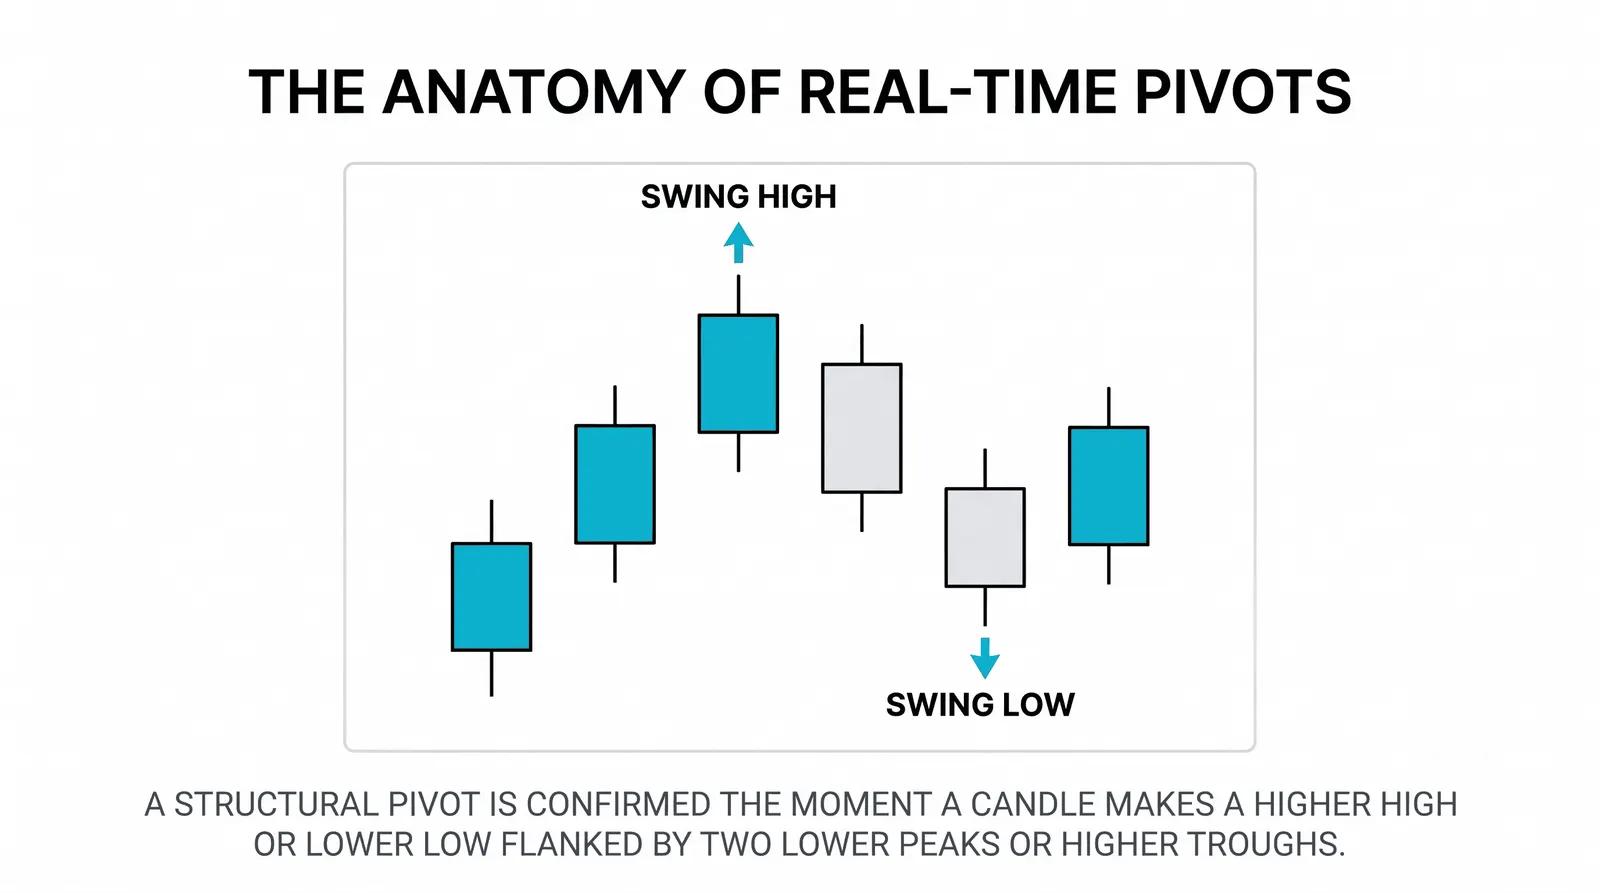
This lesson assumes you already know what an uptrend and a downtrend are. We will not re-derive them. Instead, we will slow down and look at the raw material trends are made of, because that is where the useful information hides.
The Building Blocks: Highs, Lows, and the Space Between
A swing high is a peak where price pushed up and then turned back down. A swing low is a trough where price dropped and then recovered. That is it. Every chart you will ever look at is a sequence of these two events.
The space between them matters as much as the points themselves. The distance from a swing low to the next swing high tells you how strong the buyers were on that push. The depth of the pullback tells you how hard sellers fought back. Structure is not just the dots. It is the rhythm connecting them.
One practical habit: mark your swing points by hand before you let any software do it. Drawing them forces you to decide what counts as a real swing and what is noise. That judgment is the actual skill.
Reading the Three Structures
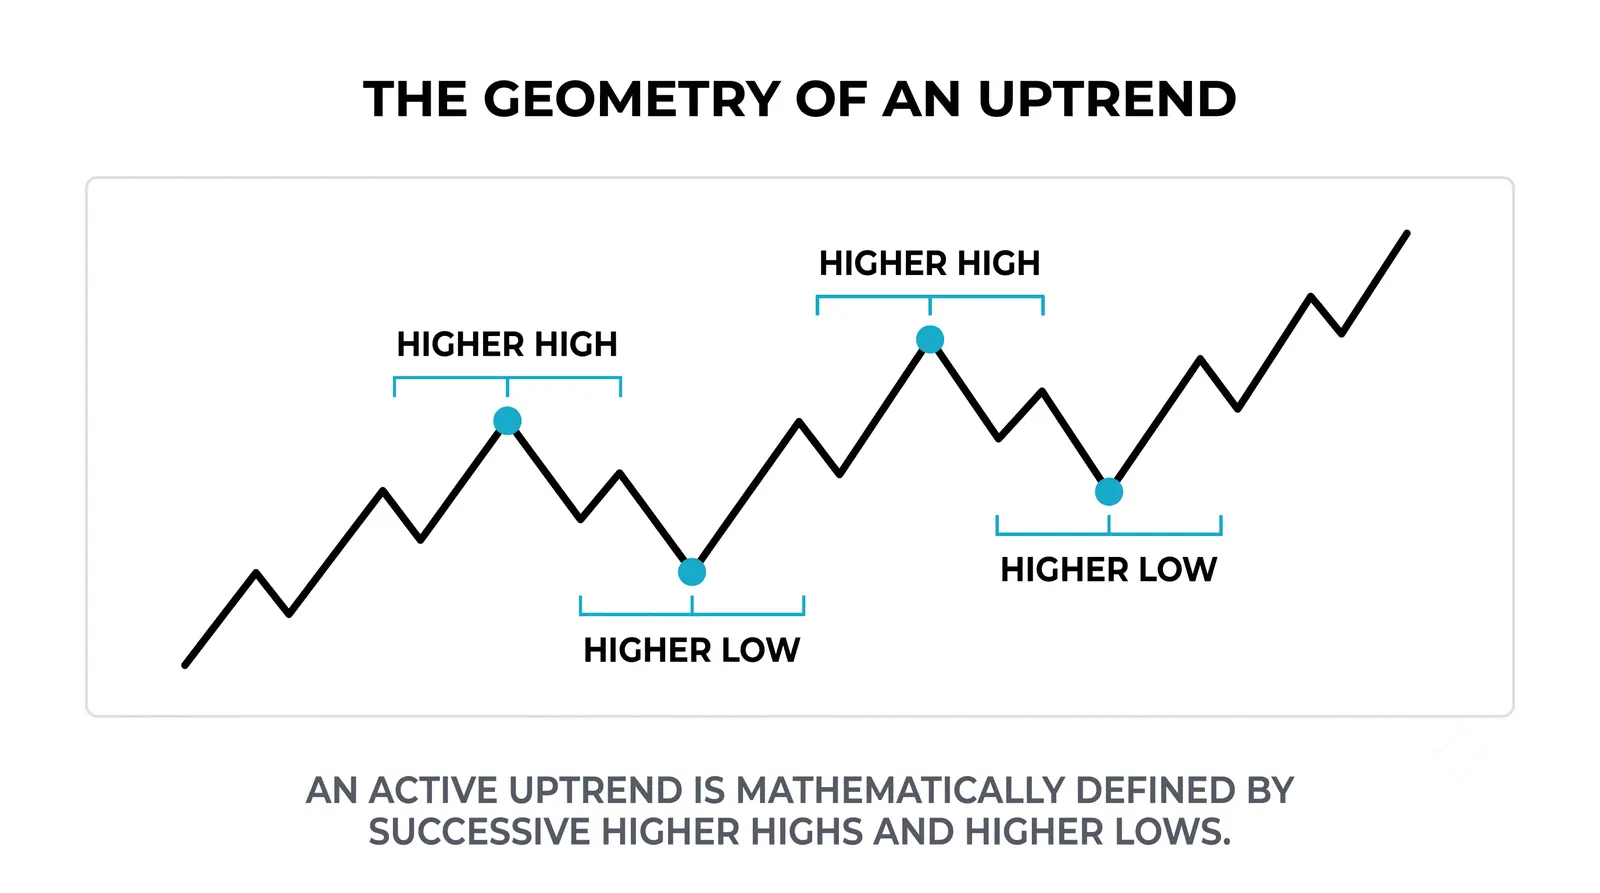
An uptrend is a sequence where each push higher exceeds the last high, and each dip stops above the last low. Higher highs, higher lows. You knew that. What you may not have noticed is the behavioral story: buyers are willing to pay more than last time, and sellers cannot even force price back to where it last found support. Both sides are voting, and both votes point the same way.
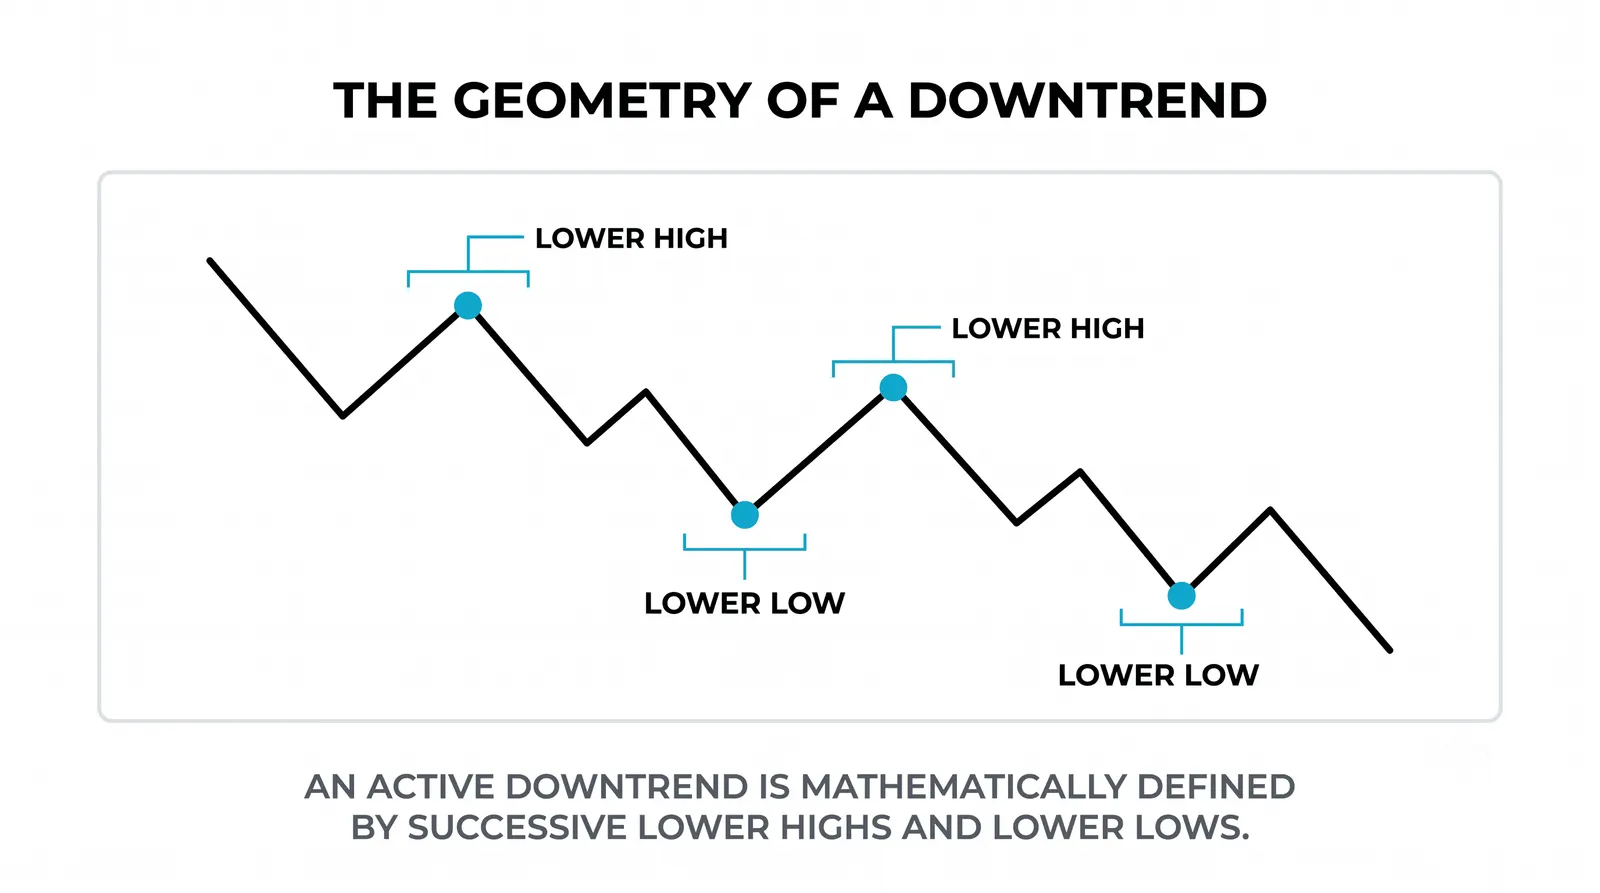
A downtrend is the mirror image. Lower highs, lower lows. Sellers press harder each time, and buyers cannot even muster a bounce back to the prior peak.
A range is the third structure, and traders underestimate it. Price swings between a ceiling and a floor, making roughly equal highs and roughly equal lows. Neither side can finish the job. Ranges are not the absence of structure. They are a structure, with their own rules and their own eventual break.
Most charts are not clean. Real markets produce overlapping swings, failed pushes, and messy pullbacks. Your job is not to find a perfect textbook pattern. Your job is to answer one question honestly: given the last few swings, who has been winning?
The Break That Matters
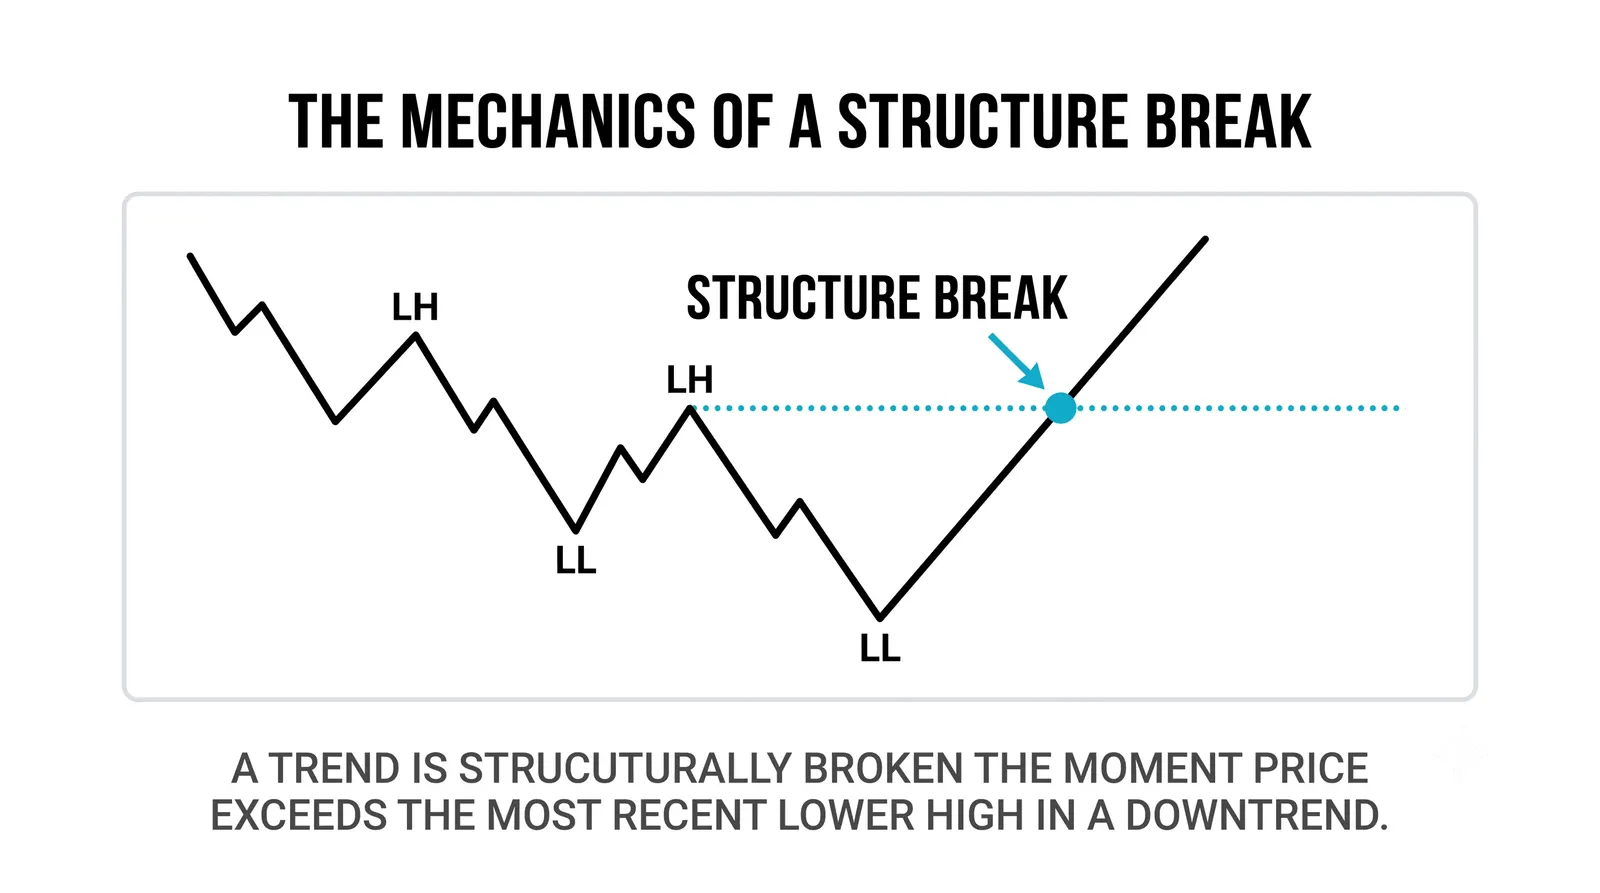
Structure changes are announced by a specific sequence, not by a feeling. In an uptrend, the warning comes in two parts. First, price fails to make a new high. Second, it breaks below the most recent higher low. The footprint pattern has changed. That second step is the confirmation, because a single failed push can just be a pause. The core sequence it tests is the one described in higher highs and higher lows.
Here is a hypothetical example with round numbers. Say a market closes at 50, rallies to 54, pulls back to 52, pushes to 57, then dips to 55. Label it: swing lows at 50, 52, and 55. Swing highs at 54 and 57. Higher highs, higher lows. Clean uptrend.
Now watch what a break looks like. Price drops under 52, taking out the last meaningful higher low. Then it tries to recover and stalls around 55, failing to reclaim the old high zone. That sequence, a broken low followed by a weak push, is the footprint of sellers taking over. No indicator was needed to see it. The structure itself told you the character of the market had shifted.
Be blunt with yourself here: a break is not a guarantee. It is a change in evidence. Sometimes structure breaks and immediately reasserts. That is why the failed push afterward matters so much. The break plus the weak recovery is a far stronger signal than the break alone.
What Each Structure Implies
Structure does not hand you a trade. It hands you a bias and a set of levels where your bias is proven wrong. The table below summarizes how the three structures typically frame decisions for longs, shorts, and traders waiting on the sideline.
| Structure | Implication for Longs | Implication for Shorts | Implication for Watchers |
|---|---|---|---|
| Uptrend (higher highs, higher lows) | Pullbacks toward prior lows are the lower-risk entries; bias stays long while lows hold | Fighting the sequence; shorts are counter-structure and demand fast exits | Wait for a pullback or a clean structure break before acting |
| Downtrend (lower highs, lower lows) | Counter-structure; longs are bounces, not trends, and need tight risk | Rallies toward prior highs are the lower-risk entries; bias stays short while highs hold | Wait for a rally to sell into or a base to form |
| Range (equal highs and lows) | Longs near the floor with invalidation just below it | Shorts near the ceiling with invalidation just above it | The eventual break of the boundary is the event worth waiting for |
| Structure break (failed high, broken low) | Existing longs are on notice; tighten or exit | First evidence that shorts may get a real trend to work with | Confirmation comes from the weak push after the break, not the break alone |
Notice what the table does not say. It never says "buy here" or "sell here." Structure defines context and invalidation. Entry timing is a separate decision layered on top.
Why Structure Beats Every Indicator Call
Every indicator is a transformation of price. A moving average smooths it. An oscillator rescales it. That processing takes time, which means every indicator is, by construction, late relative to the raw swings. Footprints come before the forecast.
There is a second problem. Indicators disagree. One says overbought while another says strong momentum. Structure rarely argues with itself. Either the last low held or it did not. Either price made a new high or it did not. These are observable facts, not interpretations.
None of this makes indicators useless. Some traders use them well as secondary confirmation. But if your indicator says buy while price is breaking a higher low and failing to recover, the indicator is describing the past and the structure is describing the present. Trust the footprints.
The traders who struggle most are usually the ones who can recite ten indicator settings but cannot mark the last three swing points on their own chart. Fix that order. Structure first, tools second.
Questions About Market Structure
How big must a swing be to count?
A swing counts when it is large enough to matter relative to the market's normal noise, and there is no universal number. A practical rule: if a pullback is smaller than the typical pullbacks already inside the move, treat it as noise, not structure. Some traders require a swing to exceed a fixed percentage or a multiple of average candle range. Pick one filter, apply it consistently, and your markings will stay honest.
Does structure differ per timeframe?
Yes, each timeframe has its own structure, and they can point in different directions at once. A daily uptrend contains many hourly downtrends inside its pullbacks. Neither is wrong. The standard approach is to read the higher timeframe for bias and the lower timeframe for timing, so you are not shorting a dip that is just a pullback inside a larger advance.
Can structure be traded directly?
Yes, many traders build entire methods on structure alone: buying higher-low pullbacks in uptrends, selling lower-high rallies in downtrends, and fading range boundaries until one breaks. The structure gives you the entry zone and, just as important, the invalidation point. If you buy a higher low and price takes it out, the reason for the trade is gone. That clarity is the main advantage.
What comes after reading structure?
The next step is combining structure with location: support and resistance, prior consolidation zones, and round numbers where decisions cluster. Structure tells you who is winning. Location tells you where the next fight is likely to happen. After that comes risk management, which is where good reads turn into an actual trading plan.
Start this week with a simple drill. Open any liquid chart, hide every indicator, and mark the last five swing highs and lows by hand. Label the structure, then scroll forward one bar at a time and watch when it breaks. Do that fifty times and you will see breaks forming before most traders around you do. From there, the natural next topic is mapping support and resistance onto those swings, which is where structure turns into levels you can actually trade against.